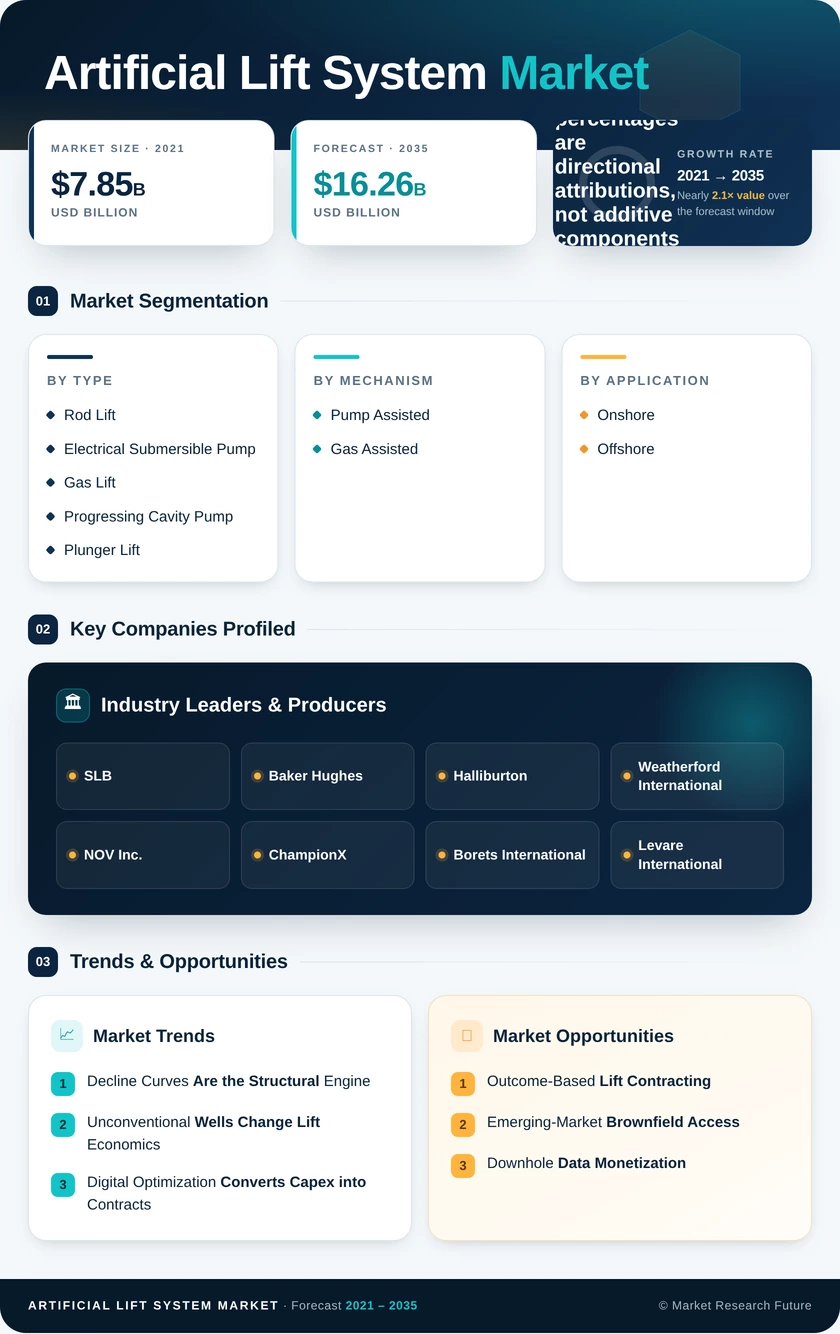
Artificial Lift System Market (2026 - 2035)

ID: MRFR/EnP/21091-HCR 100 Pages Chitranshi Jaiswal Last Updated: October 16, 2026
Artificial Lift System Market Research Report By Type (Rod Lift, Electrical Submersible Pump, Gas Lift, Progressing Cavity Pump, Plunger Lift, Hydraulic Pumping), By Mechanism (Pump Assisted, Gas Assisted), By Application (Onshore, Offshore), By Well Type (Horizontal, Vertical) - Forecast to 2035
Artificial Lift System Market
Market Size
Forecast Period2026-2035
CAGR (2026-2035)5.4%
2025 Market SizeUSD 9.60 Billion
2035 Market SizeUSD 16.26 Billion
Key Players
SLB
Baker Hughes
Halliburton
Weatherford International
NOV Inc.
ChampionX
Opportunities
  • Outcome-Based Lift Contracting
  • Emerging-Market Brownfield Access
  • Downhole Data Monetization
  1. 1 Market Overview | |
    1. 1.1 Study Assumptions & Market Definition | |
    2. 1.2 Scope of the Study | |
    3. 1.3 Research Methodology | |
  2. 2 Market Summary & Key Report Takeaways | |
    1. 2.1 Takeaways by Technology | |
    2. 2.2 Takeaways by Sector | |
    3. 2.3 Takeaways by Geography | |
  3. 3 Market Size & Forecast (2021–2035) | |
    1. 3.1 Historical Market Size (2021–2024) | |
    2. 3.2 Base Year Estimate (2025) | |
    3. 3.3 Forecast Market Size (2026–2035) | |
    4. 3.4 Year-over-Year Growth Analysis | |
  4. 4 Market Drivers Analysis | |
    1. 4.1 Decline Curves and Secondary Recovery | |
    2. 4.2 Unconventional Well Lift Conversions | |
    3. 4.3 Digital Lift Optimization Adoption | |
    4. 4.4 Wellsite Motor Efficiency Regulation | |
  5. 5 Market Restraints Analysis | |
    1. 5.1 Oil Price Volatility and Capex Cyclicality | |
    2. 5.2 Workover and Intervention Cost Inflation | |
    3. 5.3 Energy Transition Capital Reallocation | |
  6. 6 Market Opportunity Analysis | |
    1. 6.1 Outcome-Based Lift Contracting | |
    2. 6.2 Emerging-Market Brownfield Access | |
    3. 6.3 Downhole Data Monetization | |
    4. 6.4 Late-Life Gas Well De-liquefaction | |
    5. 6.5 Electrification of Wellsite Power | |
  7. 7 Regional Analysis | |
    1. 7.1 North America | | |
      1. 7.1.1 United States | | |
      2. 7.1.2 Canada | | |
      3. 7.1.3 Mexico | |
    2. 7.2 Europe | | |
      1. 7.2.1 Norway | | |
      2. 7.2.2 United Kingdom | | |
      3. 7.2.3 Romania | |
    3. 7.3 Asia-Pacific | | |
      1. 7.3.1 China | | |
      2. 7.3.2 India | | |
      3. 7.3.3 Indonesia | |
    4. 7.4 South America | | |
      1. 7.4.1 Brazil | | |
      2. 7.4.2 Argentina | | |
      3. 7.4.3 Colombia | |
    5. 7.5 Middle East & Africa | | |
      1. 7.5.1 Saudi Arabia | | |
      2. 7.5.2 United Arab Emirates | | |
      3. 7.5.3 Nigeria | |
  8. 8 Future Outlook (2026–2035) | |
    1. 8.1 Autonomous Production Operations | |
    2. 8.2 Fleet Economics and Run-Life Competition | |
    3. 8.3 Wellsite Electrification | |
    4. 8.4 Methane and Emissions Disclosure | |
  9. 9 Segmentation Analysis | |
    1. 9.1 By Type | | |
      1. 9.1.1 Rod Lift | | |
      2. 9.1.2 Electrical Submersible Pump | | |
      3. 9.1.3 Gas Lift | | |
      4. 9.1.4 Progressing Cavity Pump | | |
      5. 9.1.5 Plunger Lift | | |
      6. 9.1.6 Hydraulic Pumping | |
    2. 9.2 By Mechanism | | |
      1. 9.2.1 Pump Assisted | | |
      2. 9.2.2 Gas Assisted | |
    3. 9.3 By Application | | |
      1. 9.3.1 Onshore | | |
      2. 9.3.2 Offshore | |
    4. 9.4 By Well Type | | |
      1. 9.4.1 Horizontal | | |
      2. 9.4.2 Vertical | |
  10. 10 Competitive Landscape | |
    1. 10.1 Market Concentration Analysis | |
    2. 10.2 Competitive Benchmarking Matrix | |
    3. 10.3 Company Profiles | | |
      1. 10.3.1 SLB | | |
      2. 10.3.2 Baker Hughes | | |
      3. 10.3.3 Halliburton | | |
      4. 10.3.4 Weatherford International | | |
      5. 10.3.5 NOV Inc. | | |
      6. 10.3.6 ChampionX | | |
      7. 10.3.7 Borets International | | |
      8. 10.3.8 Levare International | | |
      9. 10.3.9 Novomet | | |
      10. 10.3.10 Dover Corporation | |
  11. 11 Recent Developments & News | |
  12. 12 Report Scope & Methodology | |
    1. 12.1 Study Period & Base Year | |
    2. 12.2 Valuation Approach | |
    3. 12.3 Abbreviations | |
  13. 13 Detailed Sources & Citations | |
  14. 14 Frequently Asked Questions | | LIST OF TABLES | |
  15. TABLE 1 Global Artificial Lift System Market Size & Forecast, by Revenue (USD Billion), 2021–2035 | |
  16. TABLE 2 Year-over-Year Growth Analysis, 2021–2035 | |
  17. TABLE 3 Driver Impact Analysis Matrix, 2026–2035 | |
  18. TABLE 4 Restraint Impact Analysis Matrix, 2026–2035 | |
  19. TABLE 5 Market Size by Region, 2021–2035 (USD Billion) | |
  20. TABLE 6 North America Market Size, by Country, 2021–2035 (USD Billion) | |
  21. TABLE 7 Europe Market Size, by Country, 2021–2035 (USD Billion) | |
  22. TABLE 8 Asia-Pacific Market Size, by Country, 2021–2035 (USD Billion) | |
  23. TABLE 9 South America Market Size, by Country, 2021–2035 (USD Billion) | |
  24. TABLE 10 Middle East & Africa Market Size, by Country, 2021–2035 (USD Billion) | |
  25. TABLE 11 Market Size by Type, 2021–2035 (USD Billion) | |
  26. TABLE 12 Market Size by Mechanism, 2021–2035 (USD Billion) | |
  27. TABLE 13 Market Size by Application, 2021–2035 (USD Billion) | |
  28. TABLE 14 Market Size by Well Type, 2021–2035 (USD Billion) | |
  29. TABLE 15 North America Market Size, by Type, 2021–2035 (USD Billion) | |
  30. TABLE 16 Europe Market Size, by Type, 2021–2035 (USD Billion) | |
  31. TABLE 17 Asia-Pacific Market Size, by Type, 2021–2035 (USD Billion) | |
  32. TABLE 18 South America Market Size, by Type, 2021–2035 (USD Billion) | |
  33. TABLE 19 Middle East & Africa Market Size, by Application, 2021–2035 (USD Billion) | |
  34. TABLE 20 United States Market Size, by Type, 2021–2035 (USD Billion) | |
  35. TABLE 21 Saudi Arabia Market Size, by Application, 2021–2035 (USD Billion) | |
  36. TABLE 22 China Market Size, by Mechanism, 2021–2035 (USD Billion) | |
  37. TABLE 23 Brazil Market Size, by Application, 2021–2035 (USD Billion) | |
  38. TABLE 24 Competitive Benchmarking Matrix, 2026 | |
  39. TABLE 25 Company Profiles — Key Players | |
  40. TABLE 26 Recent Developments & Strategic Announcements, 2023–2025 | |
  41. TABLE 27 Report Scope & Methodology Summary | |
  42. TABLE 28 Detailed Sources & Citations | | LIST OF FIGURES | |
  43. FIGURE 1 Market Dynamics — Drivers, Restraints, Opportunities | |
  44. FIGURE 2 Industry Value Chain Analysis | |
  45. FIGURE 3 Porter's Five Forces Analysis | |
  46. FIGURE 4 Market Size Trend, 2021–2035 (USD Billion) | |
  47. FIGURE 5 Year-over-Year Growth Trend, 2022–2035 | |
  48. FIGURE 6 Market Share by Type, 2025 vs 2035 | |
  49. FIGURE 7 Market Share by Mechanism, 2025 | |
  50. FIGURE 8 Market Share by Application, 2025 vs 2035 | |
  51. FIGURE 9 Market Share by Well Type, 2025 | |
  52. FIGURE 10 Regional Share Distribution, 2025 | |
  53. FIGURE 11 Regional CAGR Comparison, 2026–2035 | |
  54. FIGURE 12 Country-Level Contribution Heat Map, 2025 | |
  55. FIGURE 13 Competitive Landscape Positioning Matrix, 2026 | |
  56. FIGURE 14 Top-Five Supplier Share Concentration, 2026 | |
  57. FIGURE 15 Technology Adoption Curve, 2026–2035

Segmentation Quick Reference

DimensionSub-SegmentsDominant SegmentFastest Growing Segment
By TypeRod Lift; Electrical Submersible Pump; Gas Lift; Progressing Cavity Pump; Plunger Lift; Hydraulic PumpingRod LiftProgressing Cavity Pump
By MechanismPump Assisted; Gas AssistedPump AssistedGas Assisted
By ApplicationOnshore; OffshoreOnshoreOffshore
By Well TypeHorizontal; VerticalHorizontalHorizontal
By GeographyNorth America; Europe; Asia-Pacific; South America; Middle East & AfricaNorth AmericaMiddle East & Africa


Market Segmentation Overview

By Type

Sub-SegmentKey Trend
Rod LiftFiberglass rods and long-stroke units extend run life on stripper wells
Electrical Submersible PumpPermanent magnet motors and variable speed drives raise efficiency and reliability
Gas LiftDigital valve monitoring improves allocation across multi-well pads
Progressing Cavity PumpMetal-stator designs open high-temperature heavy-oil applications
Plunger LiftAutomated cycle control restores rates in liquid-loaded gas wells
Hydraulic PumpingJet configurations serve abrasive and highly deviated wellbores


Technology choice follows the production curve. Wells begin with high-volume systems and step down toward mechanical lift as rates decline, meaning a single asset can generate revenue for three or four distinct product lines across its life.

By Mechanism

Sub-SegmentKey Trend
Pump AssistedBroadest applicability; benefits most from electrification and drive upgrades
Gas AssistedPreferred where associated gas and compression infrastructure already exist


Mechanism selection depends heavily on gas-oil ratio and available surface infrastructure. Offshore platforms and Middle Eastern fields skew gas-assisted because compression is already installed; onshore North America skews pump-assisted.

By Application

Sub-SegmentKey Trend
OnshoreVolume-driven demand from dense, aging well populations
OffshoreEngineered subsea boosting systems with long qualification cycles


Onshore delivers scale while offshore delivers margin. Suppliers increasingly manage these as separate businesses, since the sales cycles, qualification requirements, and service models share little in common.

By Well Type

Sub-SegmentKey Trend
HorizontalComplex geometry drives multi-stage lift strategies and shorter run cycles
VerticalStable, low-rate production sustains long-tail equipment and parts demand


Horizontal completions dominate new installations and create the most frequent replacement demand. Vertical wells contribute less growth but supply a durable aftermarket base that cushions cyclical downturns.




Download PDF ×

We do not share your information with anyone. However, we may send you emails based on your report interest from time to time. You may contact us at any time to opt-out.