• Cat-intel
  • MedIntelliX
  • Resources
  • About Us
  • Hero Background
    English
    Chinese
    French
    Japanese
    Korean
    German
    Spanish

    Applied AI in Education Market Size

    ID: MRFR/ICT/10652-HCR
    128 Pages
    Shubham Munde
    October 2025

    Applied AI in Education Market Research Report: Information By Component (Solutions, Services) By Deployment (Cloud-based ,On-premises) By Technology (Machine Learning, Computer Vision, Virtual Assistants/Chatbots) By Application (Virtual Facilitators for IT Automation, Intelligent Tutoring Systems , Content Delivery Systems, Fraud and Risk Management, Student-centric Recommendation Systems) By...

    Share:
    Download PDF ×

    We do not share your information with anyone. However, we may send you emails based on your report interest from time to time. You may contact us at any time to opt-out.

    Applied AI in Education Market Infographic
    $ 4,950.0
    $ 5,950.0
    $ 7,250.0

    Applied Ai In Education Size

    Applied AI in Education Market Growth Projections and Opportunities

    The market dynamics of Applied Artificial Intelligence (AI) in Education are significantly influenced by the changing terrain of learning technologies, educational methodologies and a desire for personalized and effective learning experiences. A broad range of applied AI systems will be examined, including machine learning NLP natural language processing analytics aimed at optimizing various parts of the education process such as content delivery assessment student engagement and administrative tasks. This market is driven by several factors that reflect the transformational impact of AI on education and diverse needs of learners and educational institutions. One key driver that shapes market dynamics in Applied AI in Education is an increasing demand for personalization in adaptive learning. As a result, individual data about students such as tastes preferences or weak points can be analyzed using artificial intelligence algorithms in order to provide most suited training materials and interventions for these students. What this does is that it makes sure each student’s unique needs are taken into account thus enhancing participation, understanding and retention improving its effectiveness as a whole. The need for personalizing approaches to teaching has been one of reasons why AI has been integrated into various forms of education.

    Furthermore, the fast-changing online or remote learning environment determines how the market dynamics within the domain of Applied AI in Education behave. Shift towards digital education globally triggered by COVID-19 pandemic among other factors means there is more need for smart tools with scalable solutions. These applications include creating virtual classrooms, automated grading platforms or personalized study paths in which learners can choose their own pace based on their potentialities. The purpose behind this technology is not only to address challenges faced during distance learning but also open new doors for flexible accessible education without territorial restrictions.

    Additionally, education’s focus on making data-driven decisions affects Applied AI dynamics. Artificial intelligence analytic tools use large volumes of educational data to generate useful insights concerning learner performance patterns and institutional effectiveness That way decision-making involves relying on credible pieces of information regarding where resources should go instead mothering along with it since trends show returns on investments. The evidence-oriented performance-driven culture has led to the incorporation of AI technologies into educational institutions.
    Applied AI in Education Market Size Graph

    Market Summary

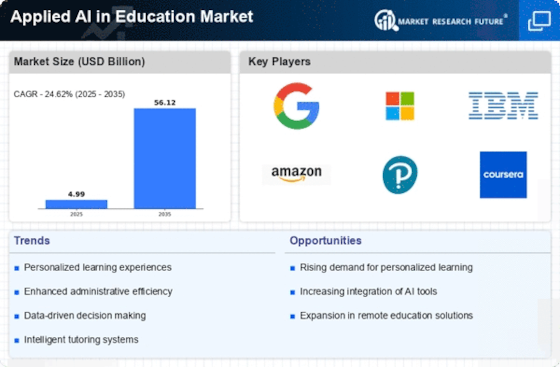
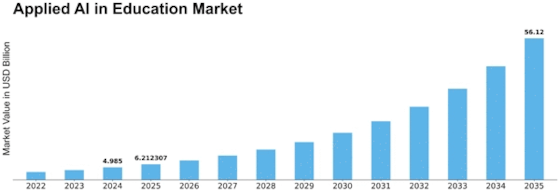
    As per Market Research Future Analysis, the Applied AI in Education Market is set to experience significant growth, expanding from USD 6.21 Billion in 2025 to USD 56.12 Billion by 2035, with a robust CAGR of 24.62% during the forecast period. The market was valued at USD 4.98 Billion in 2024. This growth is driven by the increasing demand for personalized learning experiences, automation of administrative tasks, and the integration of AI technologies in educational settings, enhancing teaching, learning, and assessment processes.

    Key Market Trends & Highlights

    Key trends driving the Applied AI in Education Market include:

    • Personalized learning is gaining traction, with AI technologies tailoring educational experiences to individual student needs.
    • The cloud-based deployment segment is rapidly growing due to its scalability and ease of access, expected to dominate the market.
    • Virtual assistants and chatbots are increasingly adopted for 24/7 student support, enhancing independent learning.
    • AI solutions are automating administrative tasks, allowing educators to focus more on instructional activities.

    Market Size & Forecast

    2024 Market Size USD 4.98 Billion
    2035 Market Size USD 56.12 Billion
    CAGR 24.62%

    Major Players

    Key players in the market include Microsoft, IBM, Google, AWS, Pearson, and Knewton.

    Market Trends

    Growing demand for personalized learning

    Personalized learning is an emerging trend in the field of applied artificial intelligence (AI) in education. This concept involves using AI technologies to tailor educational experiences and content to suit the unique needs, preferences, and learning pace of each individual student. Various tools and techniques, such as adaptive learning platforms, intelligent tutoring systems, and data analytics, can be applied to achieve personalized learning in education. These technologies collect and analyze data on students' performance, behavior, and learning patterns, enabling personalized recommendations, feedback, and interventions. The adoption of personalized learning in education brings several benefits.

    The integration of artificial intelligence in educational settings appears to enhance personalized learning experiences, thereby fostering improved student engagement and outcomes.

    U.S. Department of Education

    Applied AI in Education Market Market Drivers

    Market Growth Projections

    The Global Applied AI in Education Market Industry is poised for remarkable growth, with projections indicating a rise from 2.85 USD Billion in 2024 to 56.5 USD Billion by 2035. This trajectory suggests a robust compound annual growth rate (CAGR) of 31.2% from 2025 to 2035, reflecting the increasing integration of AI technologies in educational settings. Such growth is driven by various factors, including the demand for personalized learning, enhanced administrative efficiency, and the proliferation of data analytics. As educational institutions continue to embrace AI solutions, the market is likely to expand significantly, reshaping the future of education.

    Growing Investment in EdTech Startups

    The Global Applied AI in Education Market Industry is witnessing a surge in investment directed towards educational technology startups. Venture capitalists and educational institutions are increasingly recognizing the potential of AI-driven solutions to revolutionize learning experiences. This influx of funding enables startups to innovate and develop cutting-edge tools that address various educational challenges. For example, platforms that leverage AI for language learning or STEM education are gaining traction. As investment continues to flow into this sector, it is likely to foster a competitive landscape, driving further advancements in AI applications within education and enhancing overall market growth.

    Global Collaboration and Knowledge Sharing

    Global collaboration among educational institutions, technology providers, and researchers is emerging as a pivotal driver in the Global Applied AI in Education Market Industry. Initiatives aimed at sharing best practices and resources facilitate the development and implementation of AI solutions across diverse educational contexts. Collaborative projects often lead to the creation of innovative tools and methodologies that can be adapted to various learning environments. This collective effort not only accelerates the adoption of AI technologies but also enhances the overall quality of education on a global scale. As partnerships continue to flourish, the impact of AI in education is expected to broaden.

    Increased Demand for Personalized Learning

    The Global Applied AI in Education Market Industry experiences a notable surge in demand for personalized learning solutions. As educational institutions strive to cater to diverse learning styles and paces, AI-driven platforms offer tailored educational experiences. For instance, adaptive learning technologies utilize algorithms to assess student performance and adjust content accordingly. This trend is underscored by the projected market growth from 2.85 USD Billion in 2024 to an anticipated 56.5 USD Billion by 2035, reflecting a compound annual growth rate (CAGR) of 31.2% from 2025 to 2035. Such advancements indicate a shift towards more individualized educational pathways, enhancing student engagement and outcomes.

    Integration of AI in Administrative Processes

    The integration of AI technologies into administrative processes within educational institutions is a significant driver in the Global Applied AI in Education Market Industry. AI tools streamline operations such as enrollment, scheduling, and resource allocation, thereby improving efficiency and reducing operational costs. For example, chatbots are increasingly utilized for handling inquiries and providing support to students and staff, freeing up valuable human resources for more complex tasks. This operational enhancement not only optimizes resource management but also contributes to a more responsive educational environment. As institutions recognize these benefits, the adoption of AI in administrative functions is likely to accelerate.

    Enhanced Learning Outcomes through Data Analytics

    Data analytics powered by AI is transforming the educational landscape, serving as a crucial driver in the Global Applied AI in Education Market Industry. By analyzing vast amounts of student data, educators can identify trends, predict performance, and implement targeted interventions. For instance, learning management systems equipped with AI capabilities can track student engagement and provide insights into areas needing improvement. This data-driven approach has the potential to significantly enhance learning outcomes, as evidenced by institutions reporting improved student performance metrics. As educational stakeholders increasingly prioritize data-informed decision-making, the role of AI in analytics is expected to expand.

    Market Segment Insights

    Global Applied AI in Education Market- Segment Insights

    The global Applied AI in Education market, in this report, has been segmented based on component into Solutions, Services.

    The segment- Solution is expected to grow in the forecasted period. The demand for AI-powered educational solutions is on the rise as educational institutions strive to enhance learning outcomes and offer personalized education experiences to their students. AI solutions have the capability to analyze large amounts of student data and offer customized recommendations and interventions to improve learning effectiveness. Furthermore, AI-based solutions in education are gaining popularity because they can automate administrative tasks such as grading, scheduling, and student assessment.

    By automating these tasks, educators are able to save time and effort, allowing them to dedicate more attention to instructional activities. Moreover, AI solutions can also provide virtual learning environments and virtual tutors, enabling students to access educational resources and receive personalized support remotely. This flexibility is especially advantageous in situations such as the COVID-19 pandemic, where remote learning has become a necessity. In conclusion, the increasing demand for personalized education, automation of administrative tasks, and the provision of virtual learning environments are driving the growth of the solutions segment in the applied AI in education market.

    Global Applied AI in Education Market- Deployment Insights

    The global Applied AI in Education market, in this report, has been segmented on the basis of deployment into (Cloud-based, On-premises)

    The deployed cloud-based segment is demonstrating rapid growth in the applied AI in the education market. This is due to an increased adoption of cloud-based solutions by educational institutions, prompting more education vendors to offer their AI solutions through cloud platforms in order to expand their customer base. The numerous advantages associated with cloud-based AI solutions, including easy deployment, scalability, minimal maintenance, and flexible payment models, are driving higher adoption rates among educational organizations. Additionally, the web-based nature of cloud deployment enables users to access AI solutions from any location.

    Conversely, on-premises solutions necessitate substantial investments in infrastructure and dedicated IT staff for maintenance, thereby restricting their widespread use. Consequently, the cloud-based segment is projected to dominate the applied AI in education market and experience rapid growth in the upcoming years.

    The global Applied AI in Education market, in this report, has been segmented based on Technology into Machine Learning, Computer Vision, Virtual Assistants/Chatbots.

    The segment- Virtual Assistants/Chatbots is expected to grow in the forecasted period. The education sector is experiencing a rapid growth in the adoption of virtual assistants and chatbots, primarily because they offer round-the-clock support to students. These chatbots utilize conversational AI technology, allowing them to engage with students using natural language. They can effectively address common queries, guide students towards relevant study resources, and provide aid with assignments. By facilitating independent learning and alleviating the workload of teachers, these chatbots play a crucial role.

    Get more detailed insights about Applied AI in Education Market Research Report - Forecast till 2034

    Regional Insights

    Based on Region, the global Applied AI in Education is segmented into North America, Europe, Asia-Pacific, Middle East & Africa, and South America. Further, the major countries studied in the market report are the U.S., Canada, Germany, UK, Italy, Spain, China, Japan, India, Australia, UAE, and Brazil.

    North America is currently dominant and is expected to maintain its leadership in the upcoming years. This can be attributed to the substantial size of the K-12 and higher education sectors in the United States and Canada, which provide a massive customer base for AI education technologies. Furthermore, North America has become a fertile ground for education AI startups due to the early adoption of digital learning tools and the significant allocation of education budgets for innovative classroom solutions.

    The presence of leading technology companies that are spearheading AI advancements in education is also contributing to the growth of the market. With the increasing implementation of adaptive learning systems, virtual teaching assistants, intelligent tutoring, and other cognitive technologies in schools and universities, the demand for specialized AI education vendors will continue to rise. Therefore, due to the vast market size and high demand, North America holds the largest share in the applied AI in education industry.

    Asia-Pacific region has become the largest and fastest growing market for applied artificial intelligence. Countries like China, India, Japan, and South Korea have demonstrated strong dedication to integrating AI into mainstream education. This commitment is fueled by factors such as increasing student populations, higher education budgets, and government initiatives to equip young learners for a future that relies on AI technology. Moreover, the presence of prominent tech companies and edtech startups in the region has accelerated the adoption of AI.

    Consequently, the Asia-Pacific market for applied AI in education is projected to experience the highest annual growth rate globally in the next five years. The widespread utilization of AI in adaptive learning, virtual facilitators, intelligent tutoring systems, and automated student assessments will allow for more inclusive access to high-quality education. If this momentum persists, the Asia-Pacific region is likely to maintain its leadership position in market value and innovative AI-driven education models.

    FIGURE 3: APPLIED AI IN EDUCATION MARKET SIZE BY REGION 2022 VS 2032

    APPLIED AI IN EDUCATION MARKET SIZE BY REGION 2022 VS 2032

    Source: Secondary Research, Primary Research, Market Research Future Database, and Analyst Review

    Key Players and Competitive Insights

    The applied AI in the education market consists of a combination of technology giants, specialized edtech companies, and startups. Notable participants in this market include Microsoft, IBM, Google, AWS, Pearson, Knewton, and others. These companies are primarily focused on creating AI-powered learning platforms, virtual learning tools, and intelligent tutoring/assessment systems. Moreover, they are actively seeking partnerships with educational institutions to test new AI applications. Startups in this sector concentrate on specific areas such as adaptive learning, personalized recommendations, and virtual labs/simulations. To maintain a competitive edge in this rapidly evolving field, companies are making significant investments in research and development.

    Additionally, strategic collaborations and mergers and acquisitions are common as companies aim to expand their capabilities and market share.

    Key Companies in the Applied AI in Education Market market include

    Industry Developments

    May 2024 Eviden has announced a partnership with NVIDIA and the University of Maryland, Baltimore County (UMBC) Training Centers to establish a center for applied AI and edge AI training. This center aims to be a hub for advanced education, innovation, and practical use of artificial intelligence. This collaboration leverages the capabilities and knowledge of three prominent organizations in the technology and education industries, with the goal of providing professionals, entrepreneurs, and researchers with the necessary advanced skills and knowledge to succeed in the rapidly evolving field of artificial intelligence.

    Eviden AI experts conduct intensive three-day courses, utilizing their extensive industry knowledge and expertise to cater to the requirements of both current professionals and future difficulties. The center offers a comprehensive range of training programs, workshops, and materials that cover a wide range of applied AI and edge AI technologies. The center employs the NVIDIA Metropolis and NVIDIA NeMo platforms to play a leading role in developing the curriculum. Metropolis provides a comprehensive collection of tools for developers working with vision AI and smart city solutions. NeMo is a toolkit specifically designed for creating sophisticated conversational AI models.

    These platforms are essential components of the program, as they focus on developing, optimizing, and implementing AI solutions at the edge.

    Future Outlook

    Applied AI in Education Market Future Outlook

    The Applied AI in Education Market is projected to grow at a 24.62% CAGR from 2025 to 2035, driven by advancements in personalized learning, data analytics, and automation technologies.

    New opportunities lie in:

    • Develop AI-driven tutoring systems to enhance student engagement and learning outcomes.
    • Implement predictive analytics for student performance to optimize educational resources.
    • Create adaptive learning platforms that personalize content delivery based on individual learning styles.

    By 2035, the Applied AI in Education Market is expected to be a transformative force, reshaping educational methodologies globally.

    Market Segmentation

    Global Applied AI in Education Market- Regional Outlook

    • US
    • Canada
    • Mexico

    Global Applied AI in Education Market- Component Outlook

    • Solutions
    • Services

    Global Applied AI in Education Market- Deployment Outlook

    • Virtual Facilitators for IT Automation
    • Intelligent Tutoring Systems
    • Content Delivery Systems
    • Fraud and Risk Management
    • Student-centric Recommendation Systems

    Global Applied AI in Education Market- Technology Outlook

    • Machine Learning
    • Computer Vision
    • Virtual Assistants/Chatbots

    Report Scope

    Report Attribute/Metric Details
    Market Size 2024 4.98 (USD Billion)
    Market Size 2025 6.21 (USD Billion)
    Market Size 2035 56.12 (USD Billion)
    Compound Annual Growth Rate (CAGR) 24.62% (2025 - 2035)
    Report Coverage Revenue Forecast, Competitive Landscape, Growth Factors, and Trends
    Base Year 2024
    Market Forecast Period 2025 - 2035
    Historical Data 2019 - 2023
    Market Forecast Units USD Billion
    Segments Covered Component, Deployment, Technology, Application
    Geographies Covered Europe, North America, Asia-Pacific, Middle East & Africa, and South America
    Countries Covered The U.S, Germany, Canada, U.K., Italy, France, Spain, Japan, China, Australia, India, UAE, and Brazil
    Key Companies Profiled Microsoft Corporation, IBM Corporation, Google LLC, Amazon Web Services, Cognizant Technology Solutions, Pearson PLC, Samsung Electronics, Blackboard Inc., Educomp Solutions Limited, SAP SE, Others
    Key Market Opportunities Emerging markets Opportunity 2
    Key Market Dynamics Growing focus on personalized and adaptive learning Cost savings from automation of routine tasks. Driver 3

    Market Highlights

    Author

    Shubham Munde
    Research Analyst Level II

    She holds an experience of about 6+ years in market research and business consulting, working under the spectrum of information communication technology, telecommunications and semiconductor domains. aarti conceptualizes and implements a scalable business strategy and provides strategic leadership to the clients. her expertise lies in market estimation, competitive intelligence, pipeline analysis, customer assessment, etc.

    Leave a Comment

    Latest Comments

    John Doe
    john@example.com

    This is a great article! Really helped me understand the topic better.

    Posted on July 23, 2025, 10:15 AM
    Jane Smith
    jane@domain.com

    Thanks for sharing this. I’ve bookmarked it for later reference.

    Posted on July 22, 2025, 7:45 PM

    FAQs

    How much is Applied AI in the Education market?

    The Applied AI in Education Market was valued at USD 4.98 Billion in 2024.

    What is the growth rate of Applied AI in the Education market?

    The global market is projected to grow at a CAGR of 24.62% during the forecast period, 2025-2034.

    Which region held the largest market share in the Applied AI in Education market?

    North America had the largest share of the global market.

    Who are the key players in Applied AI in Education market?

    The key players in the market are Microsoft Corporation, IBM Corporation, Google LLC, Amazon Web Services, Cognizant Technology Solutions, Pearson PLC, Samsung Electronics, Blackboard Inc., Educomp Solutions Limited, SAP SE, Others.

    1. . EXECUTIVE SUMMARY
    2. . Market Attractiveness Analysis
    3. . Global Applied AI in Education Market, by Component
    4. . Global Applied AI in Education Market, by Deployment
    5. . Global Applied AI in Education Market, by Technology
    6. . Global Applied AI in Education Market, by Application
    7. . Global Applied AI in Education Market, by Region
    8. . MARKET INTRODUCTION
    9. . Definition
    10. . Scope of the Study
    11. . Market Structure
    12. . Key Buying Criteria
    13. . Macro Factor Indicator Analysis
    14. . RESEARCH METHODOLOGY
    15. . Research Process
    16. . Primary Research
    17. . Secondary Research
    18. . Market Size Estimation
    19. . Forecast Model
    20. . List of Assumptions
    21. . MARKET DYNAMICS
    22. . Introduction
    23. . Drivers
    24. . Growing focus on personalized and adaptive learning
    25. . Cost savings from automation of routine tasks
    26. . Driver 3
    27. . Drivers impact analysis
    28. . Restraints
    29. . Restraint impact analysis
    30. . Opportunities
    31. . Increased opportunities due to Generative AI’s capability of generating tailored solutions
    32. . Challenges
    33. . Challenge 1
    34. . Covid-19 Impact Analysis
    35. . Impact on Applied AI in Education Market
    36. . Impact on End Users during the Lockdowns
    37. . MARKET FACTOR ANALYSIS
    38. . Value Chain Analysis/Supply Chain Analysis
    39. . Porter’s Five Forces Model
    40. . Bargaining Power of Suppliers
    41. . Bargaining Power of Buyers
    42. . Threat of New Entrants
    43. . Threat of Substitutes
    44. . Intensity of Rivalry
    45. . GLOBAL APPLIED AI IN EDUCATION MARKET, BY COMPONENT
    46. . Introduction
    47. . Solutions
    48. . Services
    49. . GLOBAL APPLIED AI IN EDUCATION MARKET, BY DEPLOYMENT
    50. . Introduction
    51. . Cloud-based
    52. . On-premises
    53. . GLOBAL APPLIED AI IN EDUCATION MARKET, BY TECHNOLOGY
    54. . Introduction
    55. . Machine Learning
    56. . Computer Vision
    57. . Virtual Assistants/Chatbots
    58. . GLOBAL APPLIED AI IN EDUCATION MARKET, BY APPLICATION
    59. . Introduction
    60. . Virtual Facilitators for IT Automation
    61. . SAP SE ligent Tutoring Systems
    62. . Content Delivery Systems
    63. . Fraud and Risk Management
    64. . Student-centric Recommendation Systems
    65. . GLOBAL APPLIED AI IN EDUCATION MARKET SIZE ESTIMATION & FORECAST, BY REGION
    66. . Introduction
    67. . North America
    68. . Market Estimates & Forecast, by Country, 2018-2032
    69. . Market Estimates & Forecast, by Component, 2018-2032
    70. . Market Estimates & Forecast, by Deployment, 2018-2032
    71. . Market Estimates & Forecast, by Technology, 2018-2032
    72. . Market Estimates & Forecast, by Application, 2018-2032
    73. . US
    74. . Market Estimates & Forecast, by Component, 2018-2032
    75. . Market Estimates & Forecast, by Deployment, 2018-2032
    76. . Market Estimates & Forecast, by Technology, 2018-2032
    77. . Market Estimates & Forecast, by Application, 2018-2032
    78. . Canada
    79. . Market Estimates & Forecast, by Component, 2018-2032
    80. . Market Estimates & Forecast, by Deployment, 2018-2032
    81. . Market Estimates & Forecast, by Technology, 2018-2032
    82. . Market Estimates & Forecast, by Application, 2018-2032
    83. . Mexico
    84. . Market Estimates & Forecast, by Component, 2018-2032
    85. . Market Estimates & Forecast, by Deployment, 2018-2032
    86. . Market Estimates & Forecast, by Technology, 2018-2032
    87. . Market Estimates & Forecast, by Application, 2018-2032
    88. . Europe
    89. . Market Estimates & Forecast, by Country, 2018-2032
    90. . Market Estimates & Forecast, by Component, 2018-2032
    91. . Market Estimates & Forecast, by Deployment, 2018-2032
    92. . Market Estimates & Forecast, by Technology, 2018-2032
    93. . Market Estimates & Forecast, by Application, 2018-2032
    94. . UK
    95. . Market Estimates & Forecast, by Component, 2018-2032
    96. . Market Estimates & Forecast, by Deployment, 2018-2032
    97. . Market Estimates & Forecast, by Technology, 2018-2032
    98. . Market Estimates & Forecast, by Application, 2018-2032
    99. . Germany
    100. . Market Estimates & Forecast, by Component, 2018-2032
    101. . Market Estimates & Forecast, by Deployment, 2018-2032
    102. . Market Estimates & Forecast, by Technology, 2018-2032
    103. . Market Estimates & Forecast, by Application, 2018-2032
    104. . France
    105. . Market Estimates & Forecast, by Component, 2018-2032
    106. . Market Estimates & Forecast, by Deployment, 2018-2032
    107. . Market Estimates & Forecast, by Technology, 2018-2032
    108. . Market Estimates & Forecast, by Application, 2018-2032
    109. . Italy
    110. . Market Estimates & Forecast, by Component, 2018-2032
    111. . Market Estimates & Forecast, by Deployment, 2018-2032
    112. . Market Estimates & Forecast, by Technology, 2018-2032
    113. . Market Estimates & Forecast, by Application, 2018-2032
    114. . Spain
    115. . Market Estimates & Forecast, by Component, 2018-2032
    116. . Market Estimates & Forecast, by Deployment, 2018-2032
    117. . Market Estimates & Forecast, by Technology, 2018-2032
    118. . Market Estimates & Forecast, by Application, 2018-2032
    119. . Rest of Europe
    120. . Market Estimates & Forecast, by Component, 2018-2032
    121. . Market Estimates & Forecast, by Deployment, 2018-2032
    122. . Market Estimates & Forecast, by Technology, 2018-2032
    123. . Market Estimates & Forecast, by Application, 2018-2032
    124. . Asia-Pacific
    125. . Market Estimates & Forecast, by Country, 2018-2032
    126. . Market Estimates & Forecast, by Component, 2018-2032
    127. . Market Estimates & Forecast, by Deployment, 2018-2032
    128. . Market Estimates & Forecast, by Technology, 2018-2032
    129. . Market Estimates & Forecast, by Application, 2018-2032
    130. . China
    131. . Market Estimates & Forecast, by Component, 2018-2032
    132. . Market Estimates & Forecast, by Deployment, 2018-2032
    133. . Market Estimates & Forecast, by Technology, 2018-2032
    134. . Market Estimates & Forecast, by Application, 2018-2032
    135. . Japan
    136. . Market Estimates & Forecast, by Component, 2018-2032
    137. . Market Estimates & Forecast, by Deployment, 2018-2032
    138. . Market Estimates & Forecast, by Technology, 2018-2032
    139. . Market Estimates & Forecast, by Application, 2018-2032
    140. . India
    141. . Market Estimates & Forecast, by Component, 2018-2032
    142. . Market Estimates & Forecast, by Deployment, 2018-2032
    143. . Market Estimates & Forecast, by Technology, 2018-2032
    144. . Market Estimates & Forecast, by Application, 2018-2032
    145. . Australia
    146. . Market Estimates & Forecast, by Component, 2018-2032
    147. . Market Estimates & Forecast, by Deployment, 2018-2032
    148. . Market Estimates & Forecast, by Technology, 2018-2032
    149. . Market Estimates & Forecast, by Application, 2018-2032
    150. . Rest of Asia-Pacific
    151. . Market Estimates & Forecast, by Component, 2018-2032
    152. . Market Estimates & Forecast, by Deployment, 2018-2032
    153. . Market Estimates & Forecast, by Technology, 2018-2032
    154. . Market Estimates & Forecast, by Application, 2018-2032
    155. . Rest of the World
    156. . Market Estimates & Forecast, by Component, 2018-2032
    157. . Market Estimates & Forecast, by Deployment, 2018-2032
    158. . Market Estimates & Forecast, by Technology, 2018-2032
    159. . Market Estimates & Forecast, by Application, 2018-2032
    160. . Middle East & Africa
    161. . Market Estimates & Forecast, by Component, 2018-2032
    162. . Market Estimates & Forecast, by Deployment, 2018-2032
    163. . Market Estimates & Forecast, by Technology, 2018-2032
    164. . Market Estimates & Forecast, by Application, 2018-2032
    165. . South America
    166. . Market Estimates & Forecast, by Component, 2018-2032
    167. . Market Estimates & Forecast, by Deployment, 2018-2032
    168. . Market Estimates & Forecast, by Technology, 2018-2032
    169. . Market Estimates & Forecast, by Application, 2018-2032
    170. . COMPETITIVE LANDSCAPE
    171. . Introduction
    172. . Key Developments & Growth Strategies
    173. . Competitor Benchmarking
    174. . Vendor Share Analysis, 2022(% Share)
    175. . COMPANY PROFILES
    176. . Samsung Electronics Corporation
    177. . Company Overview
    178. . Financial Overview
    179. . Product Offered
    180. . Key Developments
    181. . SWOT Analysis
    182. . Key Strategies
    183. . IBM Corporation
    184. . Company Overview
    185. . Financial Overview
    186. . Product Offered
    187. . Key Developments
    188. . SWOT Analysis
    189. . Key Strategies
    190. . Google LLC
    191. . Company Overview
    192. . Financial Overview
    193. . Product Offered
    194. . Key Developments
    195. . SWOT Analysis
    196. . Key Strategies
    197. . Amazon Web Services
    198. . Company Overview
    199. . Financial Overview
    200. . Product Offered
    201. . Key Developments
    202. . SWOT Analysis
    203. . Key Strategies
    204. . COGNIZANT TECHNOLOGY SOLUTIONS
    205. . Company Overview
    206. . Financial Overview
    207. . Product Offered
    208. . Key Developments
    209. . SWOT Analysis
    210. . Key Strategies
    211. . Pearson PLC
    212. . Company Overview
    213. . Financial Overview
    214. . Product Offered
    215. . Key Developments
    216. . SWOT Analysis
    217. . Key Strategies
    218. . Samsung Electronics
    219. . Company Overview
    220. . Financial Overview
    221. . Product Offered
    222. . Key Developments
    223. . SWOT Analysis
    224. . Key Strategies
    225. . Blackboard Inc.
    226. . Company Overview
    227. . Financial Overview
    228. . Product Offered
    229. . Key Developments
    230. . SWOT Analysis
    231. . Key Strategies
    232. . EDUCOMP SOLUTIONS LIMITED
    233. . Company Overview
    234. . Financial Overview
    235. . Product Offered
    236. . Key Developments
    237. . SWOT Analysis
    238. . Key Strategies
    239. . SAP SE
    240. . Company Overview
    241. . Financial Overview
    242. . Product Offered
    243. . Key Developments
    244. . SWOT Analysis
    245. . Key Strategies LIST OF TABLES TABLE 1 PRIMARY INTERVIEWS 19 TABLE 2 LIST OF ASSUMPTIONS & LIMITATIONS 20 TABLE 3 GLOBAL APPLIED AI IN EDUCATION MARKET, BY COMPONENT, 2018–2032 (USD MILLION) 21 TABLE 4 GLOBAL APPLIED AI IN EDUCATION MARKET, BY DEPLOYMENT, 2018–2032 (USD MILLION) 22 TABLE 5 GLOBAL APPLIED AI IN EDUCATION MARKET, BY TECHNOLOGY, 2018–2032 (USD MILLION) 23 TABLE 6 GLOBAL APPLIED AI IN EDUCATION MARKET, BY APPLICATION, 2018–2032 (USD MILLION) 24 TABLE 7 GLOBAL APPLIED AI IN EDUCATION MARKET, BY REGION, 2018–2032 (USD MILLION) 25 TABLE 8 NORTH AMERICA APPLIED AI IN EDUCATION MARKET, BY COUNTRY, 2018–2032 (USD MILLION) 26 TABLE 9 NORTH AMERICA APPLIED AI IN EDUCATION MARKET, BY COMPONENT, 2018–2032 (USD MILLION) 27 TABLE 10 NORTH AMERICA APPLIED AI IN EDUCATION MARKET, BY DEPLOYMENT, 2018–2032 (USD MILLION) 28 TABLE 11 NORTH AMERICA APPLIED AI IN EDUCATION MARKET, BY TECHNOLOGY, 2018–2032 (USD MILLION) 29 TABLE 12 NORTH AMERICA APPLIED AI IN EDUCATION MARKET, BY APPLICATION, 2018–2032 (USD MILLION) 30 TABLE 13 US APPLIED AI IN EDUCATION MARKET, BY COMPONENT, 2018–2032 (USD MILLION) 31 TABLE 14 US APPLIED AI IN EDUCATION MARKET, BY DEPLOYMENT, 2018–2032 (USD MILLION) 32 TABLE 15 US APPLIED AI IN EDUCATION MARKET, BY TECHNOLOGY, 2018–2032 (USD MILLION) 33 TABLE 16 US APPLIED AI IN EDUCATION MARKET, BY APPLICATION, 2018–2032 (USD MILLION) 34 TABLE 17 CANADA APPLIED AI IN EDUCATION MARKET, BY COMPONENT, 2018–2032 (USD MILLION) 35 TABLE 18 CANADA APPLIED AI IN EDUCATION MARKET, BY DEPLOYMENT, 2018–2032 (USD MILLION) 36 TABLE 19 CANADA APPLIED AI IN EDUCATION MARKET, BY TECHNOLOGY, 2018–2032 (USD MILLION) 37 TABLE 20 CANADA APPLIED AI IN EDUCATION MARKET, BY APPLICATION, 2018–2032 (USD MILLION) 38 TABLE 21 MEXICO APPLIED AI IN EDUCATION MARKET, BY COMPONENT, 2018–2032 (USD MILLION) 39 TABLE 22 MEXICO APPLIED AI IN EDUCATION MARKET, BY DEPLOYMENT, 2018–2032 (USD MILLION) 40 TABLE 23 MEXICO APPLIED AI IN EDUCATION MARKET, BY TECHNOLOGY, 2018–2032 (USD MILLION) 41 TABLE 24 MEXICO APPLIED AI IN EDUCATION MARKET, BY APPLICATION, 2018–2032 (USD MILLION) 42 TABLE 25 EUROPE APPLIED AI IN EDUCATION MARKET, BY COUNTRY, 2018–2032 (USD MILLION) 43 TABLE 26 EUROPE APPLIED AI IN EDUCATION MARKET, BY COMPONENT, 2018–2032 (USD MILLION) 44 TABLE 27 EUROPE APPLIED AI IN EDUCATION MARKET, BY DEPLOYMENT, 2018–2032 (USD MILLION) 45 TABLE 28 EUROPE APPLIED AI IN EDUCATION MARKET, BY TECHNOLOGY, 2018–2032 (USD MILLION) 46 TABLE 29 EUROPE APPLIED AI IN EDUCATION MARKET, BY APPLICATION, 2018–2032 (USD MILLION) 47 TABLE 30 UK APPLIED AI IN EDUCATION MARKET, BY COMPONENT, 2018–2032 (USD MILLION) 48 TABLE 31 UK APPLIED AI IN EDUCATION MARKET, BY DEPLOYMENT, 2018–2032 (USD MILLION) 49 TABLE 32 UK APPLIED AI IN EDUCATION MARKET, BY TECHNOLOGY, 2018–2032 (USD MILLION) 50 TABLE 33 UK APPLIED AI IN EDUCATION MARKET, BY APPLICATION, 2018–2032 (USD MILLION) 51 TABLE 34 GERMANY APPLIED AI IN EDUCATION MARKET, BY COMPONENT, 2018–2032 (USD MILLION) 52 TABLE 35 GERMANY APPLIED AI IN EDUCATION MARKET, BY DEPLOYMENT, 2018–2032 (USD MILLION) 53 TABLE 36 GERMANY APPLIED AI IN EDUCATION MARKET, BY TECHNOLOGY, 2018–2032 (USD MILLION) 54 TABLE 37 GERMANY APPLIED AI IN EDUCATION MARKET, BY APPLICATION, 2018–2032 (USD MILLION) 55 TABLE 38 FRANCE APPLIED AI IN EDUCATION MARKET, BY COMPONENT, 2018–2032 (USD MILLION) 56 TABLE 39 FRANCE APPLIED AI IN EDUCATION MARKET, BY DEPLOYMENT, 2018–2032 (USD MILLION) 57 TABLE 40 FRANCE APPLIED AI IN EDUCATION MARKET, BY TECHNOLOGY, 2018–2032 (USD MILLION) 58 TABLE 41 FRANCE APPLIED AI IN EDUCATION MARKET, BY APPLICATION, 2018–2032 (USD MILLION) 59 TABLE 42 SPAIN APPLIED AI IN EDUCATION MARKET, BY COMPONENT, 2018–2032 (USD MILLION) 60 TABLE 43 SPAIN APPLIED AI IN EDUCATION MARKET, BY DEPLOYMENT, 2018–2032 (USD MILLION) 61 TABLE 44 SPAIN APPLIED AI IN EDUCATION MARKET, BY TECHNOLOGY, 2018–2032 (USD MILLION) 62 TABLE 45 SPAIN APPLIED AI IN EDUCATION MARKET, BY APPLICATION, 2018–2032 (USD MILLION) 63 TABLE 46 ITALY APPLIED AI IN EDUCATION MARKET, BY COMPONENT, 2018–2032 (USD MILLION) 64 TABLE 47 ITALY APPLIED AI IN EDUCATION MARKET, BY DEPLOYMENT, 2018–2032 (USD MILLION) 65 TABLE 48 ITALY APPLIED AI IN EDUCATION MARKET, BY TECHNOLOGY, 2018–2032 (USD MILLION) 66 TABLE 49 ITALY APPLIED AI IN EDUCATION MARKET, BY APPLICATION, 2018–2032 (USD MILLION) 67 TABLE 50 REST OF EUROPE APPLIED AI IN EDUCATION MARKET, BY COMPONENT, 2018–2032 (USD MILLION) 68 TABLE 51 REST OF EUROPE APPLIED AI IN EDUCATION MARKET, BY DEPLOYMENT, 2018–2032 (USD MILLION) 69 TABLE 52 REST OF EUROPE APPLIED AI IN EDUCATION MARKET, BY TECHNOLOGY, 2018–2032 (USD MILLION) 70 TABLE 53 REST OF EUROPE APPLIED AI IN EDUCATION MARKET, BY APPLICATION, 2018–2032 (USD MILLION) 71 TABLE 54 ASIA-PACIFIC APPLIED AI IN EDUCATION MARKET, BY COUNTRY, 2018–2032 (USD MILLION) 72 TABLE 55 ASIA-PACIFIC APPLIED AI IN EDUCATION MARKET, BY COMPONENT, 2018–2032 (USD MILLION) 73 TABLE 56 ASIA-PACIFIC APPLIED AI IN EDUCATION MARKET, BY DEPLOYMENT, 2018–2032 (USD MILLION) 74 TABLE 57 ASIA-PACIFIC APPLIED AI IN EDUCATION MARKET, BY TECHNOLOGY, 2018–2032 (USD MILLION) 75 TABLE 58 ASIA-PACIFIC APPLIED AI IN EDUCATION MARKET, BY APPLICATION, 2018–2032 (USD MILLION) 76 TABLE 59 CHINA APPLIED AI IN EDUCATION MARKET, BY COMPONENT, 2018–2032 (USD MILLION) 77 TABLE 60 CHINA APPLIED AI IN EDUCATION MARKET, BY DEPLOYMENT, 2018–2032 (USD MILLION) 78 TABLE 61 CHINA APPLIED AI IN EDUCATION MARKET, BY TECHNOLOGY, 2018–2032 (USD MILLION) 79 TABLE 62 CHINA APPLIED AI IN EDUCATION MARKET, BY APPLICATION, 2018–2032 (USD MILLION) 80 TABLE 63 JAPAN APPLIED AI IN EDUCATION MARKET, BY COMPONENT, 2018–2032 (USD MILLION) 81 TABLE 64 JAPAN APPLIED AI IN EDUCATION MARKET, BY DEPLOYMENT, 2018–2032 (USD MILLION) 82 TABLE 65 JAPAN APPLIED AI IN EDUCATION MARKET, BY TECHNOLOGY, 2018–2032 (USD MILLION) 83 TABLE 66 JAPAN APPLIED AI IN EDUCATION MARKET, BY APPLICATION, 2018–2032 (USD MILLION) 84 TABLE 67 INDIA APPLIED AI IN EDUCATION MARKET, BY COMPONENT, 2018–2032 (USD MILLION) 85 TABLE 68 INDIA APPLIED AI IN EDUCATION MARKET, BY DEPLOYMENT, 2018–2032 (USD MILLION) 86 TABLE 69 INDIA APPLIED AI IN EDUCATION MARKET, BY TECHNOLOGY, 2018–2032 (USD MILLION) 87 TABLE 70 INDIA APPLIED AI IN EDUCATION MARKET, BY APPLICATION, 2018–2032 (USD MILLION) 88 TABLE 71 SOUTH KOREA APPLIED AI IN EDUCATION MARKET, BY COMPONENT, 2018–2032 (USD MILLION) 89 TABLE 72 SOUTH KOREA APPLIED AI IN EDUCATION MARKET, BY DEPLOYMENT, 2018–2032 (USD MILLION) 90 TABLE 73 SOUTH KOREA APPLIED AI IN EDUCATION MARKET, BY TECHNOLOGY, 2018–2032 (USD MILLION) 91 TABLE 74 SOUTH KOREA APPLIED AI IN EDUCATION MARKET, BY APPLICATION, 2018–2032 (USD MILLION) 92 TABLE 75 REST OF ASIA-PACIFIC APPLIED AI IN EDUCATION MARKET, BY COMPONENT, 2018–2032 (USD MILLION) 93 TABLE 76 REST OF ASIA-PACIFIC APPLIED AI IN EDUCATION MARKET, BY DEPLOYMENT, 2018–2032 (USD MILLION) 94 TABLE 77 REST OF ASIA-PACIFIC APPLIED AI IN EDUCATION MARKET, BY TECHNOLOGY, 2018–2032 (USD MILLION) 95 TABLE 78 REST OF ASIA-PACIFIC APPLIED AI IN EDUCATION MARKET, BY APPLICATION, 2018–2032 (USD MILLION) 96 TABLE 79 REST OF WORLD APPLIED AI IN EDUCATION MARKET, BY COUNTRY, 2018–2032 (USD MILLION) 97 TABLE 80 REST OF WORLD APPLIED AI IN EDUCATION MARKET, BY COMPONENT, 2018–2032 (USD MILLION) 98 TABLE 81 REST OF WORLD APPLIED AI IN EDUCATION MARKET, BY DEPLOYMENT, 2018–2032 (USD MILLION) 99 TABLE 82 REST OF WORLD APPLIED AI IN EDUCATION MARKET, BY TECHNOLOGY, 2018–2032 (USD MILLION) 100 TABLE 83 REST OF WORLD APPLIED AI IN EDUCATION MARKET, BY APPLICATION, 2018–2032 (USD MILLION) 101 TABLE 84 MIDDLE EAST & AFRICA APPLIED AI IN EDUCATION MARKET, BY COMPONENT, 2018–2032 (USD MILLION) 102 TABLE 85 MIDDLE EAST & AFRICA APPLIED AI IN EDUCATION MARKET, BY DEPLOYMENT, 2018–2032 (USD MILLION) 103 TABLE 86 MIDDLE EAST & AFRICA APPLIED AI IN EDUCATION MARKET, BY TECHNOLOGY, 2018–2032 (USD MILLION) 104 TABLE 87 MIDDLE EAST & AFRICA APPLIED AI IN EDUCATION MARKET, BY APPLICATION, 2018–2032 (USD MILLION) 105 TABLE 92 SOUTH AMERICA APPLIED AI IN EDUCATION MARKET, BY COMPONENT, 2018–2032 (USD MILLION) 110 TABLE 93 SOUTH AMERICA APPLIED AI IN EDUCATION MARKET, BY DEPLOYMENT, 2018–2032 (USD MILLION) 111 TABLE 94 SOUTH AMERICA APPLIED AI IN EDUCATION MARKET, BY TECHNOLOGY, 2018–2032 (USD MILLION) 112 TABLE 95 SOUTH AMERICA APPLIED AI IN EDUCATION MARKET, BY APPLICATION, 2018–2032 (USD MILLION) 113 TABLE 96 BUSINESS EXPANSIONS/PRODUCT LAUNCHES 114 TABLE 97 PARTNERSHIPS/AGREEMENTS/CONTRACTS/COLLABORATIONS 115 TABLE 98 ACQUISITIONS/MERGERS 116 TABLE 99 SAMSUNG ELECTRONICS CORPORATION : PRODUCTS OFFERED 117 TABLE 100 SAMSUNG ELECTRONICS CORPORATION : KEY DEVELOPMENT 118 TABLE 101 IBM CORPORATION : PRODUCTS OFFERED 119 TABLE 102 IBM CORPORATION : KEY DEVELOPMENT 120 TABLE 103 GOOGLE LLC : PRODUCTS OFFERED 121 TABLE 104 GOOGLE LLC : KEY DEVELOPMENT 122 TABLE 105 AMAZON WEB SERVICES : PRODUCTS OFFERED 123 TABLE 106 AMAZON WEB SERVICES : KEY DEVELOPMENT 124 TABLE 107 COGNIZANT TECHNOLOGY SOLUTIONS : PRODUCTS OFFERED 125 TABLE 108 COGNIZANT TECHNOLOGY SOLUTIONS : KEY DEVELOPMENT 126 TABLE 109 IBM : PRODUCTS OFFERED 127 TABLE 110 IBM : KEY DEVELOPMENT 128 TABLE 111 SAMSUNG ELECTRONICS : PRODUCTS OFFERED 129 TABLE 112 SAMSUNG ELECTRONICS : KEY DEVELOPMENT 130 TABLE 113 BLACKBOARD INC. : PRODUCTS OFFERED 131 TABLE 114 BLACKBOARD INC. : KEY DEVELOPMENT 132 TABLE 115 EDUCOMP SOLUTIONS LIMITED : PRODUCTS OFFERED 133 TABLE 116 EDUCOMP SOLUTIONS LIMITED : KEY DEVELOPMENT 134 TABLE 117 SAP SE : PRODUCTS OFFERED 135 TABLE 118 SAP SE : KEY DEVELOPMENT 136   LIST OF FIGURES FIGURE 1 MARKET SYNOPSIS 25 FIGURE 2 MARKET ATTRACTIVENESS ANALYSIS: GLOBAL APPLIED AI IN EDUCATION MARKET 26 FIGURE 3 GLOBAL APPLIED AI IN EDUCATION MARKET ANALYSIS, BY COMPONENT 27 FIGURE 4 GLOBAL APPLIED AI IN EDUCATION MARKET ANALYSIS, BY DEPLOYMENT 28 FIGURE 5 GLOBAL APPLIED AI IN EDUCATION MARKET ANALYSIS, BY TECHNOLOGY 29 FIGURE 6 GLOBAL APPLIED AI IN EDUCATION MARKET ANALYSIS, BY APPLICATION 30 FIGURE 7 GLOBAL APPLIED AI IN EDUCATION MARKET ANALYSIS, BY REGION 31 FIGURE 8 GLOBAL APPLIED AI IN EDUCATION MARKET: STRUCTURE 32 FIGURE 9 RESEARCH PROCESS 33 FIGURE 10 TOP-DOWN AND BOTTOM-UP AND APPROACHES 34 FIGURE 11 NORTH AMERICA APPLIED AI IN EDUCATION MARKET SIZE (USD MILLION) & MARKET SHARE (%), BY COUNTRY (2022 VS 2032) 35 FIGURE 12 EUROPE APPLIED AI IN EDUCATION MARKET SIZE (USD MILLION) & MARKET SHARE (%), BY COUNTRY (2022 VS 2032) 36 FIGURE 13 ASIA PACIFIC APPLIED AI IN EDUCATION MARKET SIZE (USD MILLION) & MARKET SHARE (%), BY COUNTRY (2022 VS 2032) 37 FIGURE 14 MIDDLE EAST & AFRICA APPLIED AI IN EDUCATION MARKET SIZE (USD MILLION) & MARKET SHARE (%), BY COUNTRY (2022 VS 2032) 38 FIGURE 15 AFRICA APPLIED AI IN EDUCATION MARKET SIZE (USD MILLION) & MARKET SHARE (%), BY COUNTRY (2022 VS 2032) 39 FIGURE 16 SOUTH AMERICA APPLIED AI IN EDUCATION MARKET SIZE (USD MILLION) & MARKET SHARE (%), BY COUNTRY (2022 VS 2032) 40 FIGURE 17 MARKET DYNAMICS ANALYSIS OF THE GLOBAL APPLIED AI IN EDUCATION MARKET 41 FIGURE 18 DRIVER IMPACT ANALYSIS 42 FIGURE 19 RESTRAINT IMPACT ANALYSIS 43 FIGURE 20 VALUE CHAIN: GLOBAL APPLIED AI IN EDUCATION MARKET 44 FIGURE 21 PORTER'S FIVE FORCES ANALYSIS OF THE GLOBAL APPLIED AI IN EDUCATION MARKET 45 FIGURE 22 GLOBAL APPLIED AI IN EDUCATION MARKET, BY COMPONENT, 2022 (% SHARE) 46 FIGURE 23 GLOBAL APPLIED AI IN EDUCATION MARKET, BY COMPONENT, 2022 VS 2032 (USD MILLION) 47 FIGURE 24 GLOBAL APPLIED AI IN EDUCATION MARKET, BY DEPLOYMENT, 2022 (% SHARE) 48 FIGURE 25 GLOBAL APPLIED AI IN EDUCATION MARKET, BY DEPLOYMENT, 2022 VS 2032 (USD MILLION) 49 FIGURE 26 GLOBAL APPLIED AI IN EDUCATION MARKET, BY APPLICATION, 2022 (% SHARE) 50 FIGURE 27 GLOBAL APPLIED AI IN EDUCATION MARKET, BY APPLICATION, 2022 VS 2032 (USD MILLION) 51 FIGURE 28 GLOBAL APPLIED AI IN EDUCATION MARKET, BY APPLICATION, 2022 VS 2032 (USD MILLION) 52 FIGURE 29 GLOBAL APPLIED AI IN EDUCATION MARKET, BY APPLICATION, 2022 VS 2032 (USD MILLION) 53 FIGURE 30 GLOBAL APPLIED AI IN EDUCATION MARKET, BY REGION, 2022 (% SHARE) 54 FIGURE 31 GLOBAL APPLIED AI IN EDUCATION MARKET, BY REGION, 2022 VS 2032 (USD MILLION) 55 FIGURE 32 NORTH AMERICA APPLIED AI IN EDUCATION MARKET, BY COUNTRY, 2022 (% SHARE) 56 FIGURE 33 NORTH AMERICA APPLIED AI IN EDUCATION MARKET, BY COUNTRY, 2022 VS 2032 (USD MILLION) 57 FIGURE 34 NORTH AMERICA APPLIED AI IN EDUCATION MARKET, BY COMPONENT, 2022-2032 (USD MILLION) 58 FIGURE 35 NORTH AMERICA APPLIED AI IN EDUCATION MARKET, BY DEPLOYMENT, 2022-2032 (USD MILLION) 59 FIGURE 36 NORTH AMERICA APPLIED AI IN EDUCATION MARKET, BY APPLICATION, 2022-2032 (USD MILLION) 60 FIGURE 37 NORTH AMERICA APPLIED AI IN EDUCATION MARKET, BY APPLICATION, 2022-2032 (USD MILLION) 61 FIGURE 38 EUROPE APPLIED AI IN EDUCATION MARKET, BY COUNTRY, 2022 (% SHARE) 62 FIGURE 39 EUROPE APPLIED AI IN EDUCATION MARKET, BY COUNTRY, 2022 VS 2032 (USD MILLION) 63 FIGURE 40 EUROPE APPLIED AI IN EDUCATION MARKET, BY COMPONENT, 2022-2032 (USD MILLION) 64 FIGURE 41 EUROPE APPLIED AI IN EDUCATION MARKET, BY DEPLOYMENT, 2022-2032 (USD MILLION) 65 FIGURE 42 EUROPE APPLIED AI IN EDUCATION MARKET, BY APPLICATION, 2022-2032 (USD MILLION) 66 FIGURE 43 EUROPE APPLIED AI IN EDUCATION MARKET, BY APPLICATION, 2022-2032 (USD MILLION) 67 FIGURE 44 ASIA-PACIFIC APPLIED AI IN EDUCATION MARKET, BY COUNTRY, 2022 (% SHARE) 68 FIGURE 45 ASIA-PACIFIC APPLIED AI IN EDUCATION MARKET, BY COUNTRY, 2022 VS 2032 (USD MILLION) 69 FIGURE 46 ASIA-PACIFIC APPLIED AI IN EDUCATION MARKET, BY COMPONENT, 2022-2032 (USD MILLION) 70 FIGURE 47 ASIA-PACIFIC APPLIED AI IN EDUCATION MARKET, BY DEPLOYMENT, 2022-2032 (USD MILLION) 71 FIGURE 48 ASIA-PACIFIC APPLIED AI IN EDUCATION MARKET, BY APPLICATION, 2022-2032 (USD MILLION) 72 FIGURE 49 ASIA-PACIFIC APPLIED AI IN EDUCATION MARKET, BY APPLICATION, 2022-2032 (USD MILLION) 73 FIGURE 50 MIDDLE EAST & AFRICA APPLIED AI IN EDUCATION MARKET, BY COUNTRY, 2022 (% SHARE) 74 FIGURE 51 MIDDLE EAST & AFRICA APPLIED AI IN EDUCATION MARKET, BY COUNTRY, 2022 VS 2032 (USD MILLION) 75 FIGURE 52 MIDDLE EAST & AFRICA APPLIED AI IN EDUCATION MARKET, BY COMPONENT, 2022-2032 (USD MILLION) 76 FIGURE 53 MIDDLE EAST & AFRICA APPLIED AI IN EDUCATION MARKET, BY DEPLOYMENT, 2022-2032 (USD MILLION) 77 FIGURE 54 MIDDLE EAST & AFRICA APPLIED AI IN EDUCATION MARKET, BY APPLICATION, 2022-2032 (USD MILLION) 78 FIGURE 55 MIDDLE EAST & AFRICA APPLIED AI IN EDUCATION MARKET, BY APPLICATION, 2022-2032 (USD MILLION) 79 FIGURE 62 SOUTH AMERICA APPLIED AI IN EDUCATION MARKET, BY COUNTRY, 2022 (% SHARE) 86 FIGURE 63 SOUTH AMERICA APPLIED AI IN EDUCATION MARKET, BY COUNTRY, 2022 VS 2032 (USD MILLION) 87 FIGURE 64 SOUTH AMERICA APPLIED AI IN EDUCATION MARKET, BY COMPONENT, 2022-2032 (USD MILLION) 88 FIGURE 65 SOUTH AMERICA APPLIED AI IN EDUCATION MARKET, BY DEPLOYMENT, 2022-2032 (USD MILLION) 89 FIGURE 66 SOUTH AMERICA APPLIED AI IN EDUCATION MARKET, BY APPLICATION, 2022-2032 (USD MILLION) 90 FIGURE 67 SOUTH AMERICA APPLIED AI IN EDUCATION MARKET, BY APPLICATION, 2022-2032 (USD MILLION) 91 FIGURE 68 GLOBAL APPLIED AI IN EDUCATION MARKET: COMPETITIVE BENCHMARKING 92 FIGURE 69 VENDOR SHARE ANALYSIS (2022) (%) 93 FIGURE 70 SAMSUNG ELECTRONICS CORPORATION : FINANCIAL OVERVIEW SNAPSHOT 94 FIGURE 71 SAMSUNG ELECTRONICS CORPORATION : SWOT ANALYSIS 95 FIGURE 72 IBM CORPORATION : FINANCIAL OVERVIEW SNAPSHOT 96 FIGURE 73 IBM CORPORATION : SWOT ANALYSIS 97 FIGURE 74 GOOGLE LLC : FINANCIAL OVERVIEW SNAPSHOT 98 FIGURE 75 GOOGLE LLC : SWOT ANALYSIS 99 FIGURE 76 AMAZON WEB SERVICES : FINANCIAL OVERVIEW SNAPSHOT 100 FIGURE 77 AMAZON WEB SERVICES : SWOT ANALYSIS 101 FIGURE 78 COGNIZANT TECHNOLOGY SOLUTIONS : FINANCIAL OVERVIEW SNAPSHOT 102 FIGURE 79 COGNIZANT TECHNOLOGY SOLUTIONS : SWOT ANALYSIS 103 FIGURE 80 IBM : FINANCIAL OVERVIEW SNAPSHOT 104 FIGURE 81 IBM : SWOT ANALYSIS 105 FIGURE 82 SAMSUNG ELECTRONICS : FINANCIAL OVERVIEW SNAPSHOT 106 FIGURE 83 SAMSUNG ELECTRONICS : SWOT ANALYSIS 107 FIGURE 84 BLACKBOARD INC. : FINANCIAL OVERVIEW SNAPSHOT 108 FIGURE 85 BLACKBOARD INC. : SWOT ANALYSIS 109 FIGURE 86 EDUCOMP SOLUTIONS LIMITED : FINANCIAL OVERVIEW SNAPSHOT 110 FIGURE 87 EDUCOMP SOLUTIONS LIMITED : SWOT ANALYSIS 111 FIGURE 88 SAP SE : FINANCIAL OVERVIEW SNAPSHOT 112 FIGURE 89 SAP SE : SWOT ANALYSIS 113
    246. List of Tables and Figures
      1. Table FIGURE 1 MARKET SYNOPSIS 25 FIGURE 2 MARKET ATTRACTIVENESS ANALYSIS: GLOBAL APPLIED AI IN EDUCATION MARKET 26 FIGURE 3 GLOBAL APPLIED AI IN EDUCATION MARKET ANALYSIS, BY COMPONENT 27 FIGURE 4 GLOBAL APPLIED AI IN EDUCATION MARKET ANALYSIS, BY DEPLOYMENT 28 FIGURE 5 GLOBAL APPLIED AI IN EDUCATION MARKET ANALYSIS, BY TECHNOLOGY 29 FIGURE 6 GLOBAL APPLIED AI IN EDUCATION MARKET ANALYSIS, BY APPLICATION 30 FIGURE 7 GLOBAL APPLIED AI IN EDUCATION MARKET ANALYSIS, BY REGION 31 FIGURE 8 GLOBAL APPLIED AI IN EDUCATION MARKET: STRUCTURE 32 FIGURE 9 RESEARCH PROCESS 33 FIGURE 10 TOP-DOWN AND BOTTOM-UP AND APPROACHES 34 FIGURE 11 NORTH AMERICA APPLIED AI IN EDUCATION MARKET SIZE (USD MILLION) & MARKET SHARE (%), BY COUNTRY (2022 VS 2032) 35 FIGURE 12 EUROPE APPLIED AI IN EDUCATION MARKET SIZE (USD MILLION) & MARKET SHARE (%), BY COUNTRY (2022 VS 2032) 36 FIGURE 13 ASIA PACIFIC APPLIED AI IN EDUCATION MARKET SIZE (USD MILLION) & MARKET SHARE (%), BY COUNTRY (2022 VS 2032) 37 FIGURE 14 MIDDLE EAST & AFRICA APPLIED AI IN EDUCATION MARKET SIZE (USD MILLION) & MARKET SHARE (%), BY COUNTRY (2022 VS 2032) 38 FIGURE 15 AFRICA APPLIED AI IN EDUCATION MARKET SIZE (USD MILLION) & MARKET SHARE (%), BY COUNTRY (2022 VS 2032) 39 FIGURE 16 SOUTH AMERICA APPLIED AI IN EDUCATION MARKET SIZE (USD MILLION) & MARKET SHARE (%), BY COUNTRY (2022 VS 2032) 40 FIGURE 17 MARKET DYNAMICS ANALYSIS OF THE GLOBAL APPLIED AI IN EDUCATION MARKET 41 FIGURE 18 DRIVER IMPACT ANALYSIS 42 FIGURE 19 RESTRAINT IMPACT ANALYSIS 43 FIGURE 20 VALUE CHAIN: GLOBAL APPLIED AI IN EDUCATION MARKET 44 FIGURE 21 PORTER'S FIVE FORCES ANALYSIS OF THE GLOBAL APPLIED AI IN EDUCATION MARKET 45 FIGURE 22 GLOBAL APPLIED AI IN EDUCATION MARKET, BY COMPONENT, 2022 (% SHARE) 46 FIGURE 23 GLOBAL APPLIED AI IN EDUCATION MARKET, BY COMPONENT, 2022 VS 2032 (USD MILLION) 47 FIGURE 24 GLOBAL APPLIED AI IN EDUCATION MARKET, BY DEPLOYMENT, 2022 (% SHARE) 48 FIGURE 25 GLOBAL APPLIED AI IN EDUCATION MARKET, BY DEPLOYMENT, 2022 VS 2032 (USD MILLION) 49 FIGURE 26 GLOBAL APPLIED AI IN EDUCATION MARKET, BY APPLICATION, 2022 (% SHARE) 50 FIGURE 27 GLOBAL APPLIED AI IN EDUCATION MARKET, BY APPLICATION, 2022 VS 2032 (USD MILLION) 51 FIGURE 28 GLOBAL APPLIED AI IN EDUCATION MARKET, BY APPLICATION, 2022 VS 2032 (USD MILLION) 52 FIGURE 29 GLOBAL APPLIED AI IN EDUCATION MARKET, BY APPLICATION, 2022 VS 2032 (USD MILLION) 53 FIGURE 30 GLOBAL APPLIED AI IN EDUCATION MARKET, BY REGION, 2022 (% SHARE) 54 FIGURE 31 GLOBAL APPLIED AI IN EDUCATION MARKET, BY REGION, 2022 VS 2032 (USD MILLION) 55 FIGURE 32 NORTH AMERICA APPLIED AI IN EDUCATION MARKET, BY COUNTRY, 2022 (% SHARE) 56 FIGURE 33 NORTH AMERICA APPLIED AI IN EDUCATION MARKET, BY COUNTRY, 2022 VS 2032 (USD MILLION) 57 FIGURE 34 NORTH AMERICA APPLIED AI IN EDUCATION MARKET, BY COMPONENT, 2022-2032 (USD MILLION) 58 FIGURE 35 NORTH AMERICA APPLIED AI IN EDUCATION MARKET, BY DEPLOYMENT, 2022-2032 (USD MILLION) 59 FIGURE 36 NORTH AMERICA APPLIED AI IN EDUCATION MARKET, BY APPLICATION, 2022-2032 (USD MILLION) 60 FIGURE 37 NORTH AMERICA APPLIED AI IN EDUCATION MARKET, BY APPLICATION, 2022-2032 (USD MILLION) 61 FIGURE 38 EUROPE APPLIED AI IN EDUCATION MARKET, BY COUNTRY, 2022 (% SHARE) 62 FIGURE 39 EUROPE APPLIED AI IN EDUCATION MARKET, BY COUNTRY, 2022 VS 2032 (USD MILLION) 63 FIGURE 40 EUROPE APPLIED AI IN EDUCATION MARKET, BY COMPONENT, 2022-2032 (USD MILLION) 64 FIGURE 41 EUROPE APPLIED AI IN EDUCATION MARKET, BY DEPLOYMENT, 2022-2032 (USD MILLION) 65 FIGURE 42 EUROPE APPLIED AI IN EDUCATION MARKET, BY APPLICATION, 2022-2032 (USD MILLION) 66 FIGURE 43 EUROPE APPLIED AI IN EDUCATION MARKET, BY APPLICATION, 2022-2032 (USD MILLION) 67 FIGURE 44 ASIA-PACIFIC APPLIED AI IN EDUCATION MARKET, BY COUNTRY, 2022 (% SHARE) 68 FIGURE 45 ASIA-PACIFIC APPLIED AI IN EDUCATION MARKET, BY COUNTRY, 2022 VS 2032 (USD MILLION) 69 FIGURE 46 ASIA-PACIFIC APPLIED AI IN EDUCATION MARKET, BY COMPONENT, 2022-2032 (USD MILLION) 70 FIGURE 47 ASIA-PACIFIC APPLIED AI IN EDUCATION MARKET, BY DEPLOYMENT, 2022-2032 (USD MILLION) 71 FIGURE 48 ASIA-PACIFIC APPLIED AI IN EDUCATION MARKET, BY APPLICATION, 2022-2032 (USD MILLION) 72 FIGURE 49 ASIA-PACIFIC APPLIED AI IN EDUCATION MARKET, BY APPLICATION, 2022-2032 (USD MILLION) 73 FIGURE 50 MIDDLE EAST & AFRICA APPLIED AI IN EDUCATION MARKET, BY COUNTRY, 2022 (% SHARE) 74 FIGURE 51 MIDDLE EAST & AFRICA APPLIED AI IN EDUCATION MARKET, BY COUNTRY, 2022 VS 2032 (USD MILLION) 75 FIGURE 52 MIDDLE EAST & AFRICA APPLIED AI IN EDUCATION MARKET, BY COMPONENT, 2022-2032 (USD MILLION) 76 FIGURE 53 MIDDLE EAST & AFRICA APPLIED AI IN EDUCATION MARKET, BY DEPLOYMENT, 2022-2032 (USD MILLION) 77 FIGURE 54 MIDDLE EAST & AFRICA APPLIED AI IN EDUCATION MARKET, BY APPLICATION, 2022-2032 (USD MILLION) 78 FIGURE 55 MIDDLE EAST & AFRICA APPLIED AI IN EDUCATION MARKET, BY APPLICATION, 2022-2032 (USD MILLION) 79 FIGURE 62 SOUTH AMERICA APPLIED AI IN EDUCATION MARKET, BY COUNTRY, 2022 (% SHARE) 86 FIGURE 63 SOUTH AMERICA APPLIED AI IN EDUCATION MARKET, BY COUNTRY, 2022 VS 2032 (USD MILLION) 87 FIGURE 64 SOUTH AMERICA APPLIED AI IN EDUCATION MARKET, BY COMPONENT, 2022-2032 (USD MILLION) 88 FIGURE 65 SOUTH AMERICA APPLIED AI IN EDUCATION MARKET, BY DEPLOYMENT, 2022-2032 (USD MILLION) 89 FIGURE 66 SOUTH AMERICA APPLIED AI IN EDUCATION MARKET, BY APPLICATION, 2022-2032 (USD MILLION) 90 FIGURE 67 SOUTH AMERICA APPLIED AI IN EDUCATION MARKET, BY APPLICATION, 2022-2032 (USD MILLION) 91 FIGURE 68 GLOBAL APPLIED AI IN EDUCATION MARKET: COMPETITIVE BENCHMARKING 92 FIGURE 69 VENDOR SHARE ANALYSIS (2022) (%) 93 FIGURE 70 SAMSUNG ELECTRONICS CORPORATION : FINANCIAL OVERVIEW SNAPSHOT 94 FIGURE 71 SAMSUNG ELECTRONICS CORPORATION : SWOT ANALYSIS 95 FIGURE 72 IBM CORPORATION : FINANCIAL OVERVIEW SNAPSHOT 96 FIGURE 73 IBM CORPORATION : SWOT ANALYSIS 97 FIGURE 74 GOOGLE LLC : FINANCIAL OVERVIEW SNAPSHOT 98 FIGURE 75 GOOGLE LLC : SWOT ANALYSIS 99 FIGURE 76 AMAZON WEB SERVICES : FINANCIAL OVERVIEW SNAPSHOT 100 FIGURE 77 AMAZON WEB SERVICES : SWOT ANALYSIS 101 FIGURE 78 COGNIZANT TECHNOLOGY SOLUTIONS : FINANCIAL OVERVIEW SNAPSHOT 102 FIGURE 79 COGNIZANT TECHNOLOGY SOLUTIONS : SWOT ANALYSIS 103 FIGURE 80 IBM : FINANCIAL OVERVIEW SNAPSHOT 104 FIGURE 81 IBM : SWOT ANALYSIS 105 FIGURE 82 SAMSUNG ELECTRONICS : FINANCIAL OVERVIEW SNAPSHOT 106 FIGURE 83 SAMSUNG ELECTRONICS : SWOT ANALYSIS 107 FIGURE 84 BLACKBOARD INC. : FINANCIAL OVERVIEW SNAPSHOT 108 FIGURE 85 BLACKBOARD INC. : SWOT ANALYSIS 109 FIGURE 86 EDUCOMP SOLUTIONS LIMITED : FINANCIAL OVERVIEW SNAPSHOT 110 FIGURE 87 EDUCOMP SOLUTIONS LIMITED : SWOT ANALYSIS 111 FIGURE 88 SAP SE : FINANCIAL OVERVIEW SNAPSHOT 112 FIGURE 89 SAP SE : SWOT ANALYSIS 113
    247. Table FIGURE 1 MARKET SYNOPSIS 25 FIGURE 2 MARKET ATTRACTIVENESS ANALYSIS: GLOBAL APPLIED AI IN EDUCATION MARKET 26 FIGURE 3 GLOBAL APPLIED AI IN EDUCATION MARKET ANALYSIS, BY COMPONENT 27 FIGURE 4 GLOBAL APPLIED AI IN EDUCATION MARKET ANALYSIS, BY DEPLOYMENT 28 FIGURE 5 GLOBAL APPLIED AI IN EDUCATION MARKET ANALYSIS, BY TECHNOLOGY 29 FIGURE 6 GLOBAL APPLIED AI IN EDUCATION MARKET ANALYSIS, BY APPLICATION 30 FIGURE 7 GLOBAL APPLIED AI IN EDUCATION MARKET ANALYSIS, BY REGION 31 FIGURE 8 GLOBAL APPLIED AI IN EDUCATION MARKET: STRUCTURE 32 FIGURE 9 RESEARCH PROCESS 33 FIGURE 10 TOP-DOWN AND BOTTOM-UP AND APPROACHES 34 FIGURE 11 NORTH AMERICA APPLIED AI IN EDUCATION MARKET SIZE (USD MILLION) & MARKET SHARE (%), BY COUNTRY (2022 VS 2032) 35 FIGURE 12 EUROPE APPLIED AI IN EDUCATION MARKET SIZE (USD MILLION) & MARKET SHARE (%), BY COUNTRY (2022 VS 2032) 36 FIGURE 13 ASIA PACIFIC APPLIED AI IN EDUCATION MARKET SIZE (USD MILLION) & MARKET SHARE (%), BY COUNTRY (2022 VS 2032) 37 FIGURE 14 MIDDLE EAST & AFRICA APPLIED AI IN EDUCATION MARKET SIZE (USD MILLION) & MARKET SHARE (%), BY COUNTRY (2022 VS 2032) 38 FIGURE 15 AFRICA APPLIED AI IN EDUCATION MARKET SIZE (USD MILLION) & MARKET SHARE (%), BY COUNTRY (2022 VS 2032) 39 FIGURE 16 SOUTH AMERICA APPLIED AI IN EDUCATION MARKET SIZE (USD MILLION) & MARKET SHARE (%), BY COUNTRY (2022 VS 2032) 40 FIGURE 17 MARKET DYNAMICS ANALYSIS OF THE GLOBAL APPLIED AI IN EDUCATION MARKET 41 FIGURE 18 DRIVER IMPACT ANALYSIS 42 FIGURE 19 RESTRAINT IMPACT ANALYSIS 43 FIGURE 20 VALUE CHAIN: GLOBAL APPLIED AI IN EDUCATION MARKET 44 FIGURE 21 PORTER'S FIVE FORCES ANALYSIS OF THE GLOBAL APPLIED AI IN EDUCATION MARKET 45 FIGURE 22 GLOBAL APPLIED AI IN EDUCATION MARKET, BY COMPONENT, 2022 (% SHARE) 46 FIGURE 23 GLOBAL APPLIED AI IN EDUCATION MARKET, BY COMPONENT, 2022 VS 2032 (USD MILLION) 47 FIGURE 24 GLOBAL APPLIED AI IN EDUCATION MARKET, BY DEPLOYMENT, 2022 (% SHARE) 48 FIGURE 25 GLOBAL APPLIED AI IN EDUCATION MARKET, BY DEPLOYMENT, 2022 VS 2032 (USD MILLION) 49 FIGURE 26 GLOBAL APPLIED AI IN EDUCATION MARKET, BY APPLICATION, 2022 (% SHARE) 50 FIGURE 27 GLOBAL APPLIED AI IN EDUCATION MARKET, BY APPLICATION, 2022 VS 2032 (USD MILLION) 51 FIGURE 28 GLOBAL APPLIED AI IN EDUCATION MARKET, BY APPLICATION, 2022 VS 2032 (USD MILLION) 52 FIGURE 29 GLOBAL APPLIED AI IN EDUCATION MARKET, BY APPLICATION, 2022 VS 2032 (USD MILLION) 53 FIGURE 30 GLOBAL APPLIED AI IN EDUCATION MARKET, BY REGION, 2022 (% SHARE) 54 FIGURE 31 GLOBAL APPLIED AI IN EDUCATION MARKET, BY REGION, 2022 VS 2032 (USD MILLION) 55 FIGURE 32 NORTH AMERICA APPLIED AI IN EDUCATION MARKET, BY COUNTRY, 2022 (% SHARE) 56 FIGURE 33 NORTH AMERICA APPLIED AI IN EDUCATION MARKET, BY COUNTRY, 2022 VS 2032 (USD MILLION) 57 FIGURE 34 NORTH AMERICA APPLIED AI IN EDUCATION MARKET, BY COMPONENT, 2022-2032 (USD MILLION) 58 FIGURE 35 NORTH AMERICA APPLIED AI IN EDUCATION MARKET, BY DEPLOYMENT, 2022-2032 (USD MILLION) 59 FIGURE 36 NORTH AMERICA APPLIED AI IN EDUCATION MARKET, BY APPLICATION, 2022-2032 (USD MILLION) 60 FIGURE 37 NORTH AMERICA APPLIED AI IN EDUCATION MARKET, BY APPLICATION, 2022-2032 (USD MILLION) 61 FIGURE 38 EUROPE APPLIED AI IN EDUCATION MARKET, BY COUNTRY, 2022 (% SHARE) 62 FIGURE 39 EUROPE APPLIED AI IN EDUCATION MARKET, BY COUNTRY, 2022 VS 2032 (USD MILLION) 63 FIGURE 40 EUROPE APPLIED AI IN EDUCATION MARKET, BY COMPONENT, 2022-2032 (USD MILLION) 64 FIGURE 41 EUROPE APPLIED AI IN EDUCATION MARKET, BY DEPLOYMENT, 2022-2032 (USD MILLION) 65 FIGURE 42 EUROPE APPLIED AI IN EDUCATION MARKET, BY APPLICATION, 2022-2032 (USD MILLION) 66 FIGURE 43 EUROPE APPLIED AI IN EDUCATION MARKET, BY APPLICATION, 2022-2032 (USD MILLION) 67 FIGURE 44 ASIA-PACIFIC APPLIED AI IN EDUCATION MARKET, BY COUNTRY, 2022 (% SHARE) 68 FIGURE 45 ASIA-PACIFIC APPLIED AI IN EDUCATION MARKET, BY COUNTRY, 2022 VS 2032 (USD MILLION) 69 FIGURE 46 ASIA-PACIFIC APPLIED AI IN EDUCATION MARKET, BY COMPONENT, 2022-2032 (USD MILLION) 70 FIGURE 47 ASIA-PACIFIC APPLIED AI IN EDUCATION MARKET, BY DEPLOYMENT, 2022-2032 (USD MILLION) 71 FIGURE 48 ASIA-PACIFIC APPLIED AI IN EDUCATION MARKET, BY APPLICATION, 2022-2032 (USD MILLION) 72 FIGURE 49 ASIA-PACIFIC APPLIED AI IN EDUCATION MARKET, BY APPLICATION, 2022-2032 (USD MILLION) 73 FIGURE 50 MIDDLE EAST & AFRICA APPLIED AI IN EDUCATION MARKET, BY COUNTRY, 2022 (% SHARE) 74 FIGURE 51 MIDDLE EAST & AFRICA APPLIED AI IN EDUCATION MARKET, BY COUNTRY, 2022 VS 2032 (USD MILLION) 75 FIGURE 52 MIDDLE EAST & AFRICA APPLIED AI IN EDUCATION MARKET, BY COMPONENT, 2022-2032 (USD MILLION) 76 FIGURE 53 MIDDLE EAST & AFRICA APPLIED AI IN EDUCATION MARKET, BY DEPLOYMENT, 2022-2032 (USD MILLION) 77 FIGURE 54 MIDDLE EAST & AFRICA APPLIED AI IN EDUCATION MARKET, BY APPLICATION, 2022-2032 (USD MILLION) 78 FIGURE 55 MIDDLE EAST & AFRICA APPLIED AI IN EDUCATION MARKET, BY APPLICATION, 2022-2032 (USD MILLION) 79 FIGURE 62 SOUTH AMERICA APPLIED AI IN EDUCATION MARKET, BY COUNTRY, 2022 (% SHARE) 86 FIGURE 63 SOUTH AMERICA APPLIED AI IN EDUCATION MARKET, BY COUNTRY, 2022 VS 2032 (USD MILLION) 87 FIGURE 64 SOUTH AMERICA APPLIED AI IN EDUCATION MARKET, BY COMPONENT, 2022-2032 (USD MILLION) 88 FIGURE 65 SOUTH AMERICA APPLIED AI IN EDUCATION MARKET, BY DEPLOYMENT, 2022-2032 (USD MILLION) 89 FIGURE 66 SOUTH AMERICA APPLIED AI IN EDUCATION MARKET, BY APPLICATION, 2022-2032 (USD MILLION) 90 FIGURE 67 SOUTH AMERICA APPLIED AI IN EDUCATION MARKET, BY APPLICATION, 2022-2032 (USD MILLION) 91 FIGURE 68 GLOBAL APPLIED AI IN EDUCATION MARKET: COMPETITIVE BENCHMARKING 92 FIGURE 69 VENDOR SHARE ANALYSIS (2022) (%) 93 FIGURE 70 SAMSUNG ELECTRONICS CORPORATION : FINANCIAL OVERVIEW SNAPSHOT 94 FIGURE 71 SAMSUNG ELECTRONICS CORPORATION : SWOT ANALYSIS 95 FIGURE 72 IBM CORPORATION : FINANCIAL OVERVIEW SNAPSHOT 96 FIGURE 73 IBM CORPORATION : SWOT ANALYSIS 97 FIGURE 74 GOOGLE LLC : FINANCIAL OVERVIEW SNAPSHOT 98 FIGURE 75 GOOGLE LLC : SWOT ANALYSIS 99 FIGURE 76 AMAZON WEB SERVICES : FINANCIAL OVERVIEW SNAPSHOT 100 FIGURE 77 AMAZON WEB SERVICES : SWOT ANALYSIS 101 FIGURE 78 COGNIZANT TECHNOLOGY SOLUTIONS : FINANCIAL OVERVIEW SNAPSHOT 102 FIGURE 79 COGNIZANT TECHNOLOGY SOLUTIONS : SWOT ANALYSIS 103 FIGURE 80 IBM : FINANCIAL OVERVIEW SNAPSHOT 104 FIGURE 81 IBM : SWOT ANALYSIS 105 FIGURE 82 SAMSUNG ELECTRONICS : FINANCIAL OVERVIEW SNAPSHOT 106 FIGURE 83 SAMSUNG ELECTRONICS : SWOT ANALYSIS 107 FIGURE 84 BLACKBOARD INC. : FINANCIAL OVERVIEW SNAPSHOT 108 FIGURE 85 BLACKBOARD INC. : SWOT ANALYSIS 109 FIGURE 86 EDUCOMP SOLUTIONS LIMITED : FINANCIAL OVERVIEW SNAPSHOT 110 FIGURE 87 EDUCOMP SOLUTIONS LIMITED : SWOT ANALYSIS 111 FIGURE 88 SAP SE : FINANCIAL OVERVIEW SNAPSHOT 112 FIGURE 89 SAP SE : SWOT ANALYSIS 113

    Applied AI in Education Market Segmentation

    Market Segmentation Overview

    • Detailed segmentation data will be available in the full report
    • Comprehensive analysis by multiple parameters
    • Regional and country-level breakdowns
    • Market size forecasts by segment
    Infographic

    Free Sample Request

    Kindly complete the form below to receive a free sample of this Report

    Get Free Sample

    Customer Strories

    “I am very pleased with how market segments have been defined in a relevant way for my purposes (such as "Portable Freezers & refrigerators" and "last-mile"). In general the report is well structured. Thanks very much for your efforts.”

    Victoria Milne

    Founder
    Case Study
    Chemicals and Materials