Apiculture Market (2026 - 2035)

Apiculture Market Size, Share, Industry Trend & Analysis Research Report By Product Type (Honey, Beeswax, Live Bees, Other Bee Products), By Production Method (Traditional, Modern), By Application (Food and Beverages, Dietary Supplements, Personal Care and Cosmetics, Other Applications), By Geography (North America, Europe, Asia-Pacific, South America, Middle East & Africa) - Forecast to 2035
ID: MRFR/FnB/39753-HCR 128 Pages Snehal Singh Last Updated: September 17, 2026
Apiculture Market
Market Size
Forecast Period2026-2035
CAGR (2026-2035)4.92%
2025 Market SizeUSD 9.42 Billion
2035 Market SizeUSD 15.18 Billion
Key Players
Dabur India Ltd.
Capilano Honey
Barkman Honey
Comvita Limited
Y.S. Eco Bee Farms
Beeyond the Hive
Opportunities
  • Premium and Traceable Honey
  • Functional and Apitherapy Products
  • Emerging-Market Expansion
 

Apiculture Market Summary

The apiculture market reached USD 9.42 billion in 2025 and is positioned to climb from a 2026 base of USD 9.88 billion to roughly USD 15.18 billion by 2035, advancing at a 4.92% CAGR across the forecast window. Two catalysts anchor this trajectory. First, the European Union's honey traceability rules under Directive 2024/1438, paired with a 90-member Honey Platform targeting adulteration, are pushing buyers toward verified supply. Second, sustained public funding for pollinator health — including USDA pollinator programs exceeding USD 80 million annually — is shoring up the production base that the apiculture market depends on.

Beekeeping is shifting away from purely manual, intuition-led hive management toward sensor-instrumented operations. Legacy practices, where colony health was checked by periodic visual inspection, are giving way to precision beekeeping tools: in-hive temperature and acoustic sensors, GPS-tagged pallets, and data dashboards that flag stress before collapse. Venture and grant capital flowing into agritech-adjacent pollinator startups has topped USD 120 million since 2023, accelerating commercial beekeeping honey production at scale.

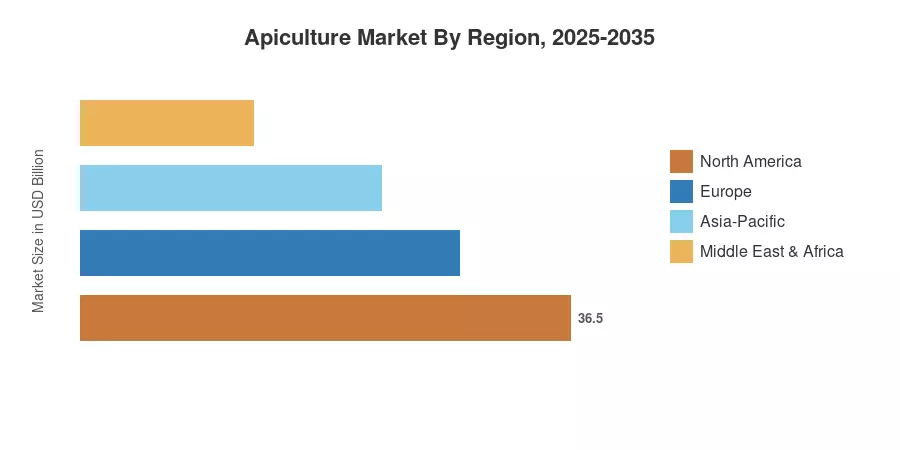
Asia-Pacific leads the apiculture market with a 32.8% share in 2025, propelled by China and India's vast smallholder base. North America is the fastest-growing region at a 5.41% CAGR, lifted by premium honey demand and organic honey bee farming. Europe ranks second, supported by its stringent quality regime. The decade ahead favors operators who pair traceability with resilient colony stewardship.

Key Report Takeaways

• By Product Type

  • Honey commanded a 73.8% revenue share of the apiculture market in 2025, underpinned by retail and food-processing demand
  • Live-bee sales are projected to expand at a 5.71% CAGR through 2035 as queen bee rearing apiculture demand intensifies

• By Production Method

  • Traditional practices supplied roughly USD 7.42 billion of output value in 2025, dominating the apiculture market
  • Modern techniques are forecast to grow at a 5.84% CAGR, reflecting precision beekeeping adoption

• By Region

  • Asia-Pacific held a 32.8% share of the apiculture market in 2025
  • North America is set to record the fastest regional growth at a 5.41% CAGR
  • Europe's contribution is shaped by colony collapse disorder apiculture mitigation policy

Market Size and Forecast (2021–2035)

The forecast below blends MRFR primary interviews with beekeeping cooperatives, packer financials, and government colony surveys, triangulated against trade-flow data for honey and beeswax. Base-year 2025 values are anchored to verified production volumes and average export prices.
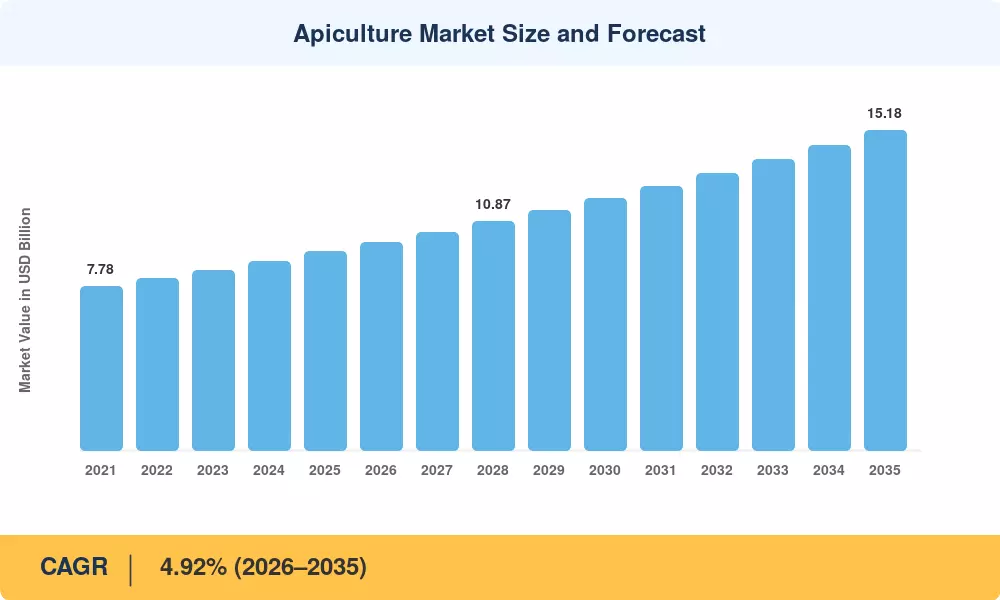
Apiculture Market Size and Forecast
Our Impact

Enabled $4.3B Revenue Impact for Fortune 500 and Leading Multinationals

Partnering with 2000+ Global Organizations Each Year

30K+ Citations by Top-Tier Firms in the Industry


Driver Impact Analysis

Driver ~% Impact on CAGR Geographic Relevance Impact Timeline
Natural sweetener substitution High Global Long-term (≥4 yr)
Honey traceability regulation Medium-High Europe, North America Medium-term (2–4 yr)
Precision beekeeping adoption Medium North America, APAC Long-term (≥4 yr)
Functional bee-product demand Medium Global Medium-term (2–4 yr)
Pollination service contracts Medium-High North America Long-term (≥4 yr)
Pollinator-health public funding Medium North America, Europe Short-term (≤2 yr)
Export market diversification Low-Medium APAC, South America Medium-term (2–4 yr)


Natural Sweetener Substitution

Consumer migration from refined sugar toward natural alternatives remains the strongest structural driver. US honey consumption per capita has risen steadily, with USDA data showing domestic honey use above 600 million pounds annually, lifting commercial beekeeping honey production economics across the apiculture market.

Honey Traceability Regulation

The EU's Directive 2024/1438 mandates clear country-of-origin labeling and underpins a 90-member Honey Platform tasked with curbing adulteration. Compliance is steering an estimated USD 300 million in annual purchasing toward verified suppliers, rewarding operators with documented supply chains.

Precision Beekeeping Adoption

Sensor-equipped hive systems and integrated pest management are reducing colony losses that reached 56% in 2025 US surveys. Investment in precision tooling — flagged in research grants exceeding USD 25 million — directly counters colony collapse disorder apiculture pressures and stabilizes yields.

Pollination Service Contracts

Almond, fruit, and seed growers contract managed colonies each season, with US pollination fees generating well over USD 300 million yearly. These contracts give beekeepers a revenue stream independent of honey prices, reinforcing organic honey bee farming viability.


Restraints Impact Analysis

Restraint impact percentages are directional and reflect drag on growth momentum rather than precise subtractions from the CAGR.

Restraint ~% Impact on CAGR Geographic Relevance Impact Timeline
High colony-loss rates High Global Long-term (≥4 yr)
Pesticide and pathogen exposure Medium-High Global Long-term (≥4 yr)
Climate variability Medium Global Long-term (≥4 yr)
Labor shortages Medium North America, Europe Medium-term (2–4 yr)
Honey adulteration and price pressure Medium APAC, Europe Medium-term (2–4 yr)


High Colony-Loss Rates

The 56% colony loss recorded in 2025 US surveys — the steepest since monitoring began — is the most severe constraint on the apiculture market. Replacement costs and lost productivity erode smallholder margins and limit supply expansion despite firm demand.

Pesticide and Pathogen Exposure

Neonicotinoid residues and Varroa destructor infestations continue to undermine colony resilience. EPA pesticide reviews and EU restrictions raise compliance complexity, while pathogen management costs push small operators toward consolidation.

Honey Adulteration and Price Pressure

Syrup-adulterated imports depress prices for genuine producers. EU testing programs flagged a significant share of sampled honey as suspect, compressing margins and slowing reinvestment in beekeeping equipment supplies market capacity.


Apiculture Market Opportunities

Premium and Traceable Honey

Verified-origin and single-floral honeys sell at a premium of 30–60% over commodity grades. Operators engaging in blockchain-backed traceability can capture the margin as merchants react to Directive 2024/1438 transparency standards


Functional and Apitherapy Products

An expanding apitherapy and dietary supplement segment is fed by propolis, royal jelly and bee venom. Brands marketing them as immune and wellness products unlock higher value per hive than honey alone


Emerging-Market Expansion

South America and Africa have big under-monetized colony bases. In Brazil, there is white space in geography for queen bee raising, apiculture and cooperative methods to boost yields in organic honey exports, and in Ethiopia, production scale-up.

Data Monetization and Hive-as-a-Service

Precision beekeeping platforms produce colony health datasets that are valuable to agritech insurers and crop growers. Sales of physical product also generate recurring revenue from subscription dashboards and pollination-analytics services.


Beekeeping Equipment Modernization

Demand for protective gear, modular hives, and extraction systems is rising as new entrants entering the beekeeping equipment supplies market seek durable, sensor-ready kit suited to commercial-scale operations.


Apiculture Market Future Outlook

Sensor-Driven Autonomous Apiaries

The next decade brings broader deployment of acoustic and thermal hive sensors that predict swarming and disease. As hardware costs fall, autonomous monitoring will move from pilot apiaries to mainstream commercial beekeeping honey production, narrowing colony losses.

Platform Economics and Hive-as-a-Service

Subscription platforms bundling colony analytics, pollination matching, and insurance will reshape revenue models. Beekeepers increasingly earn from data and services, not just honey, mirroring the platform shift seen across precision agriculture.

Sustainability and ESG Reporting

Food brands face pollinator-impact disclosure expectations. Corporate biodiversity commitments and FAO pollinator initiatives will pull verified, sustainably produced honey into mainstream procurement, raising the value of organic honey bee farming.

Climate Adaptation and Resilient Genetics

Breeding programs targeting Varroa-resistant and heat-tolerant stock will gain priority as climate variability intensifies. Investment in queen bee rearing apiculture genetics is set to become a defining competitive frontier through 2035.


Regional Market Share Analysis

Region 2025 Share (%) Primary Investment Themes
North America 24.6 Precision beekeeping, pollination contracts
Europe 27.1 Traceability compliance, premium honey
Asia-Pacific 32.8 Smallholder scale, export volume
South America 9.8 Organic honey exports
Middle East & Africa 5.7 Production base development
Total 100.0 —


North America

Country Share of Region (%) Key Driver
US 78.4 Pollination service demand
Canada 14.2 Prairie honey production
Mexico 7.4 Export-oriented beekeeping


North America is the fastest-growing region as premium honey demand and pollination contracts converge. USDA pollinator programs and the 56% colony-loss crisis are channeling investment into integrated pest management, supporting commercial beekeeping honey production resilience.

Europe

Country Share of Region (%) Key Driver
Germany 21.8 Premium retail demand
UK 14.6 Artisanal honey market
France 15.2 Apiculture heritage policy
Italy 12.4 Organic certification
Spain 13.1 Largest EU producer
Nordic Countries 6.8 Specialty honey
Russia 9.3 Domestic production base
Rest of Europe 6.8 Mixed demand


Europe's market is defined by Directive 2024/1438 and the Honey Platform's anti-adulteration mandate. These rules favor documented supply and reward organic honey bee farming, though imported adulterated honey continues to pressure local producers.

Asia-Pacific

Country Share of Region (%) Key Driver
China 41.6 World's largest honey producer
India 22.3 Expanding cooperative base
Japan 9.8 Premium import demand
South Korea 7.4 Functional product demand
ASEAN 11.2 Tropical honey exports
Rest of Asia-Pacific 7.7 Emerging production


Asia-Pacific dominates the apiculture market through sheer volume, with China and India anchoring global supply. Government cooperative schemes in India and modernization investment in China are gradually shifting smallholders toward modern techniques.

South America

Country Share of Region (%) Key Driver
Brazil 58.3 Organic honey exports
Argentina 31.7 Bulk honey exports
Rest of South America 10.0 Emerging production


South America's growth rests on export-grade organic honey. Brazil and Argentina supply major Northern Hemisphere markets, and tightening traceability abroad rewards their certified, low-residue production profiles.

Middle East & Africa

Country Share of Region (%) Key Driver
Saudi Arabia 26.4 Premium Sidr honey demand
UAE 19.8 Luxury honey retail
South Africa 23.1 Commercial beekeeping
Egypt 18.2 Traditional production
Rest of MEA 12.5 Cooperative development


Middle East & Africa remains the smallest region but holds premium niches, notably Sidr honey. Development programs and rising disposable income support the gradual formalization of beekeeping across the region.

Apiculture Market By Region, 2025-2035
 

Apiculture Market Segmentation

By Product Type

Segment Metric Primary Demand Driver
Honey 73.8% share (2025) Retail and food processing
Beeswax USD 1.12 B (2025) Cosmetics and candles
Live Bees 5.71% CAGR Colony replacement demand
Other (propolis, royal jelly) 6.02% CAGR Apitherapy and supplements


Honey anchors the apiculture market, drawing demand from natural-sweetener substitution and functional-food formulation. Live bees, though smaller, grow fastest as high colony-loss rates sustain replacement demand and queen bee rearing apiculture expands commercially.

By Production Method

Segment Metric Primary Demand Driver
Traditional 79.1% share (2025) Smallholder dominance
Modern 5.84% CAGR Precision beekeeping adoption


Traditional methods still supply most volume in the apiculture market, reflecting the smallholder-heavy structure in Asia-Pacific. Modern techniques grow faster as precision tools and integrated pest management address colony collapse disorder apiculture risks.

By Application

Segment Metric Primary Demand Driver
Food and Beverages 69.4% share (2025) Natural sweetener demand
Dietary Supplements 5.62% CAGR Functional wellness trend
Personal Care and Cosmetics USD 1.38 B (2025) Beeswax and propolis use
Other (pharma, agriculture) 5.21% CAGR Apitherapy and pollination


Food and beverages dominate application demand within the apiculture market, led by honey as a clean-label sweetener. Dietary supplements advance fastest as consumers seek propolis and royal jelly for immunity and wellness positioning.


Competitive Benchmarking

The apiculture market is highly fragmented, with a low concentration profile and an estimated HHI below 600. The top five players together hold under 25% of global revenue, leaving a long tail of smallholders, cooperatives, and regional packers. Larger honey packers are pursuing vertical integration to secure premium raw honey and live-bee supply.

Company Est. Revenue Share Range Key Offerings for Apiculture Market Strategic Positioning
Dabur India Ltd. ~7–10% Branded retail honey Leading APAC honey brand
Capilano Honey (Hive & Wellness) ~5–8% Packaged honey, exports Dominant Australian packer
Barkman Honey ~4–6% Honey packing, private label Major North American supplier
Comvita Limited ~3–6% Manuka honey, apitherapy Premium functional positioning
Y.S. Eco Bee Farms ~2–4% Organic and raw honey Organic specialist
Beeyond the Hive ~2–4% Honey, beeswax products Diversified bee products
Lamex Foods ~2–4% Bulk honey trading Global ingredient supply
GloryBee ~2–4% Honey, beekeeping supplies Integrated supplier
Mann Lake Ltd. ~2–3% Beekeeping equipment supplies Equipment market leader
Honey Pacifica ~1–3% Raw artisanal honey Niche premium producer
Streamland Biological ~1–3% Honey, bee products APAC functional products


Recent News & Developments

  • European Union (June 2024): Directive 2024/1438 adopted, mandating country-of-origin labeling for honey blends and strengthening anti-adulteration enforcement [6].


  • USDA (October 2023): Announced expanded pollinator-health funding supporting integrated pest management research [10].
  • Dabur India (August 2024): Launched traceability-backed honey range responding to adulteration concerns in domestic retail [16].


  • EU Honey Platform (November 2024): 90-member platform established to coordinate adulteration testing and traceability standards [6].


  • Comvita Limited (January 2025): Partnered with research institutes on Varroa-resistant bee breeding programs [13].

Apiculture Market Report Scope

Parameter Detail
Market Scope Global apiculture market — honey, beeswax, live bees, and bee products
Study Period 2021–2035
CAGR 4.92% (2026–2035)
Market Size Checkpoints USD 9.42 B (2025); USD 9.88 B (2026); USD 15.18 B (2035)
Fastest Growing Segments Live bees; modern production methods; dietary supplements
Companies Profiled 11 leading players including Dabur, Capilano, Comvita, Barkman
Valuation Currency USD Billion
CAGR Driver Disclaimer Driver impact percentages are directional, not additive to headline CAGR

FAQs

What should investors evaluate before entering the apiculture market?
Prioritize traceability infrastructure and colony-health resilience, since these drive premium pricing and supply stability. Operations with documented sourcing and integrated pest management carry lower regulatory and reputational risk [6].
How does the apiculture market reward vertically integrated packers?
Vertical integration secures access to premium raw honey and live-bee supply, insulating packers from price volatility and adulteration risk. It also strengthens negotiating leverage with retailers demanding verified origin [16].
Which procurement criteria matter most for buyers in the apiculture market?
Buyers should weigh laboratory authenticity testing, country-of-origin documentation, and residue certification. Suppliers meeting Directive 2024/1438 standards reduce compliance exposure for downstream brands [6].
How do precision beekeeping tools compare with traditional hive management?
Precision tools provide early disease and swarm alerts, cutting colony losses that manual inspection misses. Traditional methods cost less upfront but carry higher long-term loss risk [7].
What regulatory nuance affects honey importers?
Importers must verify blended-honey labeling and origin disclosure under tightening EU rules. Non-compliant shipments face rejection, making supplier due diligence essential [6].
Which emerging use cases are expanding bee-product demand?
Apitherapy products — propolis, royal jelly, and bee venom — are entering wellness and cosmetic formulations. This diversifies revenue beyond honey and lifts value per colony [8].
What integration challenges face new precision-beekeeping adopters?
Connectivity gaps in rural apiaries and data-skill shortages slow sensor rollout. Operators succeed by phasing deployment and partnering with agritech platforms for analytics support [7].
Author
Author Author Profile Snehal Singh LinkedIn Manager - Research
High acumen in analyzing complex macro & micro markets with more than 6 years of work experience in the field of market research. By implementing her analytical skills in forecasting and estimation into market research reports, she has expertise in Packaging, Construction, and Equipment domains. She handles a team size of 20-25 resources and ensures smooth running of the projects, associated marketing activities, and client servicing.

Research Approach


Secondary Research

The secondary research process involved comprehensive analysis of regulatory databases, agricultural statistics, peer-reviewed entomology and food science journals, industry publications, and authoritative agricultural organizations. Key sources included:

Government & Regulatory Authorities:

USDA (United States Department of Agriculture) – National Agricultural Statistics Service (NASS) honey production reports, bee colony health surveys, and apiculture economic data

FDA (Food and Drug Administration) – Food safety regulations, honey identity standards, and dietary supplement guidelines for bee products

EFSA (European Food Safety Authority) – Bee health monitoring, pesticide risk assessments, and honey safety protocols

EU Commission Directorate-General for Agriculture and Rural Development – Common Agricultural Policy (CAP) apiculture subsidies and market support programs

FAO (Food and Agriculture Organization of the United Nations) – Global honey production statistics, bee population databases, and international trade flows

National Honey Board (USA) – Industry-funded research, consumption trends, and promotional campaign data

Apiary Inspectors of America (AIA) – Colony loss surveys, disease surveillance, and best management practices

European Professional Beekeepers Association (EPBA) – Regional production data and policy advocacy reports

Australian Government Department of Agriculture, Fisheries and Forestry – Biosecurity regulations and export certification data

China Ministry of Agriculture and Rural Affairs – National beekeeping industry statistics and quality standards

Scientific & Research Institutions:

NIH/NCBI/PubMed – Clinical studies on propolis antimicrobial properties, royal jelly nutritional research, and bee pollen health effects

USDA Agricultural Research Service (ARS) – Honey bee research laboratory publications on colony health and productivity

Rothamsted Research (UK) – Pollinator ecology and sustainable apiculture studies

International Bee Research Association (IBRA) – Journal of Apicultural Research and global bee science literature

Apidologie Journal (INRA/ Springer) – Peer-reviewed research on bee biology and apiculture technology

Trade & Industry Organizations:

International Federation of Beekeepers' Associations (APIMONDIA) – Global congress proceedings, industry standards, and market intelligence

American Beekeeping Federation (ABF) – Annual industry surveys and legislative tracking

British Beekeepers Association (BBKA) – Membership statistics and regional production estimates

Canadian Honey Council – National production data and export market analysis

International Databases:

UN Comtrade Database – Harmonized System (HS) trade statistics for honey (HS 0409), beeswax (HS 1521), and other bee products

ITC (International Trade Centre) Trade Map – Export/import flows by country and product category

World Bank Open Data – Agricultural value added, rural employment statistics, and food security indicators

OECD-FAO Agricultural Outlook – Medium-term market projections for sweeteners and natural products

Eurostat – EU-27 apiculture production, organic certification data, and farm structure surveys

These sources were utilized to collect honey and bee product production statistics, regulatory compliance data, clinical efficacy studies on propolis and royal jelly, colony health trends, international trade volumes, and competitive landscape analysis across honey, beeswax, royal jelly, propolis, and bee pollen segments.


Primary Research

Primary research validated market segmentation across product types (honey, beeswax, royal jelly, propolis, bee pollen), confirmed organic certification trends and premium pricing strategies, and gathered insights on colony management technology adoption, seasonal production variability, export market dynamics, and regulatory compliance costs.

Primary Respondent Breakdown:

By Designation: C-level Primaries (28%), Director Level (33%), Others (39%)

By Region: North America (32%), Europe (29%), Asia-Pacific (28%), Rest of World (11%)

By Value Chain Position: Commercial Beekeepers/Apiaries (35%), Honey Processors/Packers (22%), Bee Product Manufacturers (18%), Equipment Suppliers (12%), End-Use Industry Buyers (13%)


Market Size Estimation

Global market valuation was derived through production volume mapping, trade data analysis, and revenue estimation across the apiculture value chain. The methodology included:

Identification of 60+ key stakeholders across commercial beekeeping operations, honey processing facilities, beeswax refiners, royal jelly extractors, propolis processors, and bee pollen collectors in North America, Europe, Asia-Pacific, Latin America, and Middle East & Africa

Product mapping across five primary categories: Honey (liquid, comb, organic, monofloral), Beeswax (cosmetic grade, pharmaceutical grade, industrial), Royal Jelly (fresh, freeze-dried, capsules), Propolis (extracts, tinctures, capsules), and Bee Pollen (granules, capsules, powders)

Analysis of reported and modeled annual revenues specific to apiculture portfolios, including raw material production, value-added processing, and branded consumer goods

Coverage of stakeholders representing 65-70% of global market share in 2024, with particular focus on China (world's largest honey producer), Turkey, Argentina, Ukraine, and major EU producing nations (Spain, Hungary, Romania, Germany)

Extrapolation using bottom-up approach (hive count × average yield × farm-gate price by country, plus processing margins and retail markups) and top-down validation (national agricultural statistics cross-referenced with trade data and industry association estimates) to derive segment-specific valuations for each product type and application sector (Food & Beverage, Cosmetics & Personal Care, Pharmaceuticals, Nutraceuticals)

Adjustments for informal economy participation in developing markets and unreported local consumption, utilizing FAO food balance sheets and household consumption surveys to estimate total available supply versus officially traded volumes

Download Free Sample

Kindly complete the form below to receive a free sample of this Report

Download PDF ×

We do not share your information with anyone. However, we may send you emails based on your report interest from time to time. You may contact us at any time to opt-out.

















