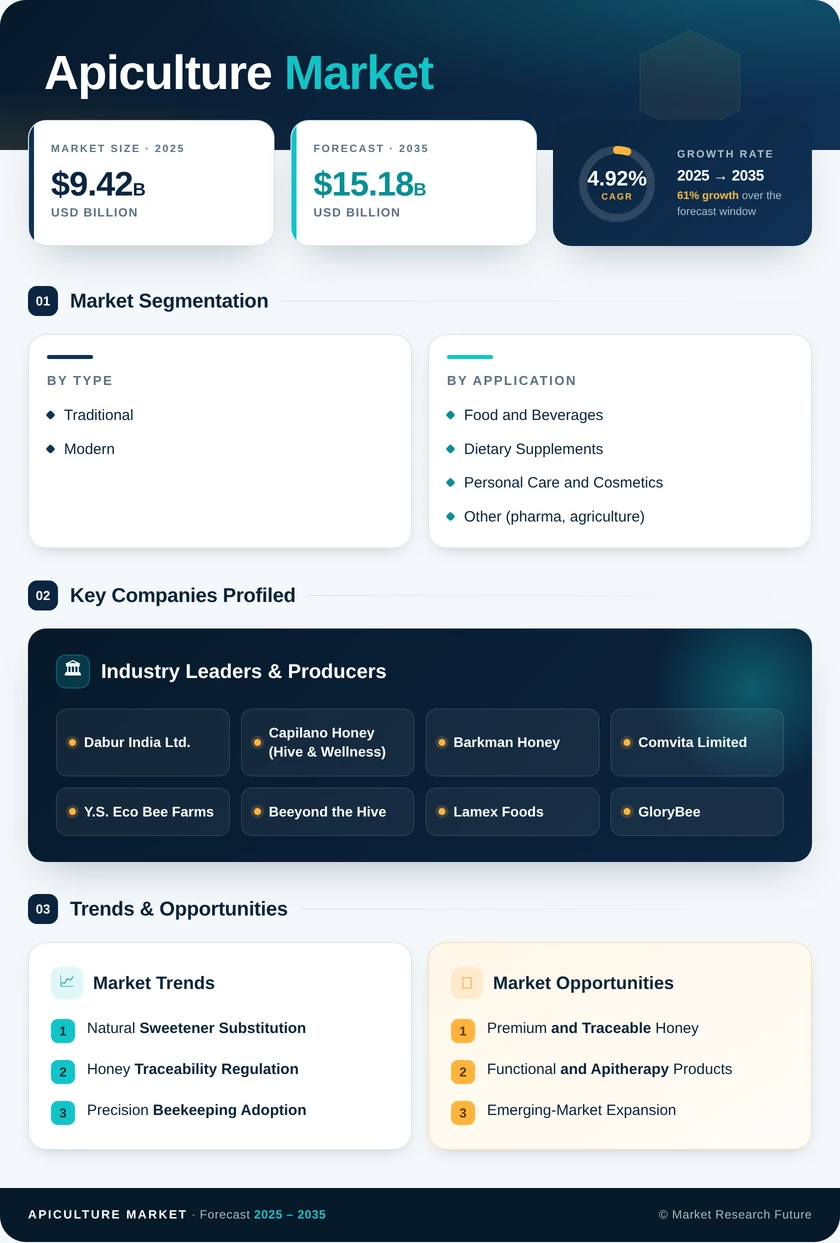
Apiculture Market (2026 - 2035)

ID: MRFR/FnB/39753-HCR 128 Pages Snehal Singh Last Updated: September 17, 2026
Apiculture Market Size, Share, Industry Trend & Analysis Research Report By Product Type (Honey, Beeswax, Live Bees, Other Bee Products), By Production Method (Traditional, Modern), By Application (Food and Beverages, Dietary Supplements, Personal Care and Cosmetics, Other Applications), By Geography (North America, Europe, Asia-Pacific, South America, Middle East & Africa) - Forecast to 2035
Apiculture Market
Market Size
Forecast Period2026-2035
CAGR (2026-2035)4.92%
2025 Market SizeUSD 9.42 Billion
2035 Market SizeUSD 15.18 Billion
Key Players
Dabur India Ltd.
Capilano Honey
Barkman Honey
Comvita Limited
Y.S. Eco Bee Farms
Beeyond the Hive
Opportunities
  • Premium and Traceable Honey
  • Functional and Apitherapy Products
  • Emerging-Market Expansion
  1. 1 Market Overview |
    1. 1.1 Study Assumptions & Market Definition |
    2. 1.2 Scope of the Study |
    3. 1.3 Research Methodology
  2. 2 Market Summary & Key Takeaways
  3. 3 Market Dynamics |
    1. 3.1 Market Drivers Analysis | |
      1. 3.1.1 Natural Sweetener Substitution | |
      2. 3.1.2 Honey Traceability Regulation | |
      3. 3.1.3 Precision Beekeeping Adoption | |
      4. 3.1.4 Pollination Service Contracts |
    2. 3.2 Market Restraints Analysis | |
      1. 3.2.1 High Colony-Loss Rates | |
      2. 3.2.2 Pesticide and Pathogen Exposure | |
      3. 3.2.3 Honey Adulteration and Price Pressure |
    3. 3.3 Market Opportunity Analysis | |
      1. 3.3.1 Premium and Traceable Honey | |
      2. 3.3.2 Functional and Apitherapy Products | |
      3. 3.3.3 Emerging-Market Expansion | |
      4. 3.3.4 Data Monetization and Hive-as-a-Service | |
      5. 3.3.5 Beekeeping Equipment Modernization |
    4. 3.4 Industry Value Chain Analysis |
    5. 3.5 Porter's Five Forces Analysis
  4. 4 Global Apiculture Market Size & Forecast (2021–2035) |
    1. 4.1 Historical Market Size (2021–2025) |
    2. 4.2 Current & Forecast Market Size (2026–2035) |
    3. 4.3 Market Size by Revenue (USD Billion) |
    4. 4.4 Year-over-Year Growth Analysis
  5. 5 Segmentation Analysis |
    1. 5.1 By Product Type | |
      1. 5.1.1 Honey | |
      2. 5.1.2 Beeswax | |
      3. 5.1.3 Live Bees | |
      4. 5.1.4 Other Bee Products |
    2. 5.2 By Production Method | |
      1. 5.2.1 Traditional | |
      2. 5.2.2 Modern |
    3. 5.3 By Application | |
      1. 5.3.1 Food and Beverages | |
      2. 5.3.2 Dietary Supplements | |
      3. 5.3.3 Personal Care and Cosmetics | |
      4. 5.3.4 Other Applications
  6. 6 Regional Analysis |
    1. 6.1 North America | |
      1. 6.1.1 United States | |
      2. 6.1.2 Canada | |
      3. 6.1.3 Mexico |
    2. 6.2 Asia-Pacific | |
      1. 6.2.1 China | |
      2. 6.2.2 India | |
      3. 6.2.3 Japan | |
      4. 6.2.4 South Korea | |
      5. 6.2.5 ASEAN | |
      6. 6.2.6 Rest of Asia-Pacific |
    3. 6.3 Europe | |
      1. 6.3.1 Germany | |
      2. 6.3.2 United Kingdom | |
      3. 6.3.3 France | |
      4. 6.3.4 Italy | |
      5. 6.3.5 Spain | |
      6. 6.3.6 Nordic Countries | |
      7. 6.3.7 Russia | |
      8. 6.3.8 Rest of Europe |
    4. 6.4 South America | |
      1. 6.4.1 Brazil | |
      2. 6.4.2 Argentina | |
      3. 6.4.3 Rest of South America |
    5. 6.5 Middle East & Africa | |
      1. 6.5.1 Saudi Arabia | |
      2. 6.5.2 UAE | |
      3. 6.5.3 South Africa | |
      4. 6.5.4 Egypt | |
      5. 6.5.5 Rest of Middle East & Africa
  7. 7 Competitive Landscape |
    1. 7.1 Market Share Analysis (2026) |
    2. 7.2 Competitive Benchmarking Matrix |
    3. 7.3 Company Profiles | |
      1. 7.3.1 Dabur India Ltd. | |
      2. 7.3.2 Capilano Honey (Hive & Wellness) | |
      3. 7.3.3 Barkman Honey | |
      4. 7.3.4 Comvita Limited | |
      5. 7.3.5 Y.S. Eco Bee Farms | |
      6. 7.3.6 Beeyond the Hive | |
      7. 7.3.7 Lamex Foods | |
      8. 7.3.8 GloryBee | |
      9. 7.3.9 Mann Lake Ltd. | |
      10. 7.3.10 Honey Pacifica
  8. 8 Future Outlook & Strategic Recommendations (2026–2035) |
    1. 8.1 Near-Term Outlook (2026–2028) |
    2. 8.2 Medium-Term Outlook (2029–2031) |
    3. 8.3 Long-Term Outlook (2032–2035)
  9. 9 Recent Developments & News
  10. 10 Frequently Asked Questions (FAQs)
  11. 11 Report Scope & Methodology |
    1. 11.1 Study Period & Base Year |
    2. 11.2 Data Sources & Citations |
    3. 11.3 Abbreviations
  12. 12 LIST OF TABLES |
  13. TABLE 1 Global Apiculture Market Size & Forecast, by Revenue (USD Billion), 2021–2035 |
  14. TABLE 2 Global Apiculture Market – Year-over-Year Growth Analysis, 2021–2035 |
  15. TABLE 3 Global Apiculture Market – Driver Impact Analysis |
  16. TABLE 4 Global Apiculture Market – Restraint Impact Analysis |
  17. TABLE 5 Global Apiculture Market Size, by Product Type, 2021–2035 (USD Billion) |
  18. TABLE 6 Global Apiculture Market Size, by Production Method, 2021–2035 (USD Billion) |
  19. TABLE 7 Global Apiculture Market Size, by Application, 2021–2035 (USD Billion) |
  20. TABLE 8 Global Apiculture Market Size, by Region, 2021–2035 (USD Billion) |
  21. TABLE 9 North America Apiculture Market Size, by Country, 2021–2035 (USD Billion) |
  22. TABLE 10 Europe Apiculture Market Size, by Country, 2021–2035 (USD Billion) |
  23. TABLE 11 Asia-Pacific Apiculture Market Size, by Country, 2021–2035 (USD Billion) |
  24. TABLE 12 South America Apiculture Market Size, by Country, 2021–2035 (USD Billion) |
  25. TABLE 13 Middle East & Africa Apiculture Market Size, by Country, 2021–2035 (USD Billion) |
  26. TABLE 14 Competitive Benchmarking Matrix – Global Apiculture Market, 2026 |
  27. TABLE 15 Company Profiles – Key Players, Global Apiculture Market |
  28. TABLE 16 Recent Developments & Strategic Announcements, 2023–2025 |
  29. TABLE 17 Report Scope & Methodology – Global Apiculture Market |
  30. TABLE 18 Detailed Sources & Citations – Global Apiculture Market
  31. 13 LIST OF FIGURES |
  32. FIGURE 1 Global Apiculture Market – Market Dynamics Overview |
  33. FIGURE 2 Global Apiculture Market – Industry Value Chain Analysis |
  34. FIGURE 3 Global Apiculture Market – Porter's Five Forces Analysis |
  35. FIGURE 4 Global Apiculture Market Size Trend, 2021–2035 (USD Billion) |
  36. FIGURE 5 Global Apiculture Market Share, by Product Type, 2025 (%) |
  37. FIGURE 6 Global Apiculture Market Share, by Production Method, 2025 (%) |
  38. FIGURE 7 Global Apiculture Market Share, by Application, 2025 (%) |
  39. FIGURE 8 Global Apiculture Market Share, by Region, 2025 (%) |
  40. FIGURE 9 Global Apiculture Market – Competitive Landscape & Market Concentration

Segmentation Quick Reference

DimensionSub-SegmentsDominant SegmentFastest Growing Segment
By Product TypeHoney, Beeswax, Live Bees, Other Bee ProductsHoneyLive Bees
By Production MethodTraditional, ModernTraditionalModern
By ApplicationFood and Beverages, Dietary Supplements, Personal Care and Cosmetics, Other ApplicationsFood and BeveragesDietary Supplements
By GeographyNorth America, Europe, Asia-Pacific, South America, Middle East & AfricaAsia-PacificNorth America


Market Segmentation Overview

By Product Type

Sub-SegmentKey Trend
HoneyClean-label sweetener demand drives the largest revenue pool
BeeswaxSteady pull from cosmetics, candles, and food coatings
Live BeesHigh colony-loss rates sustain rapid replacement demand
Other Bee ProductsPropolis and royal jelly gain from apitherapy interest


Honey remains the revenue anchor of the apiculture market, while live bees post the fastest growth as colony losses force ongoing replacement and queen bee rearing apiculture scales commercially.

By Production Method

Sub-SegmentKey Trend
TraditionalSmallholder-led production dominates volume, especially in Asia-Pacific
ModernPrecision beekeeping and integrated pest management drive faster growth


Traditional methods still supply most output, but modern techniques expand quickest as operators adopt sensors and data tools to counter colony collapse disorder apiculture pressures.

By Application

Sub-SegmentKey Trend
Food and BeveragesNatural-sweetener substitution underpins dominant demand
Dietary SupplementsFunctional wellness positioning lifts propolis and royal jelly
Personal Care and CosmeticsBeeswax and honey formulations support steady uptake
Other ApplicationsApiculture Market and pollination uses add incremental demand


Food and beverages lead application demand within the apiculture market, while dietary supplements grow fastest as consumers seek functional bee products for immunity and wellness.


Download PDF ×

We do not share your information with anyone. However, we may send you emails based on your report interest from time to time. You may contact us at any time to opt-out.