×
  • Cat-intel
  • MedIntelliX
  • Resources
  • About Us
  • Hero Background
    English
    Chinese
    French
    Japanese
    Korean
    German
    Spanish

    Ammonia Market Size

    ID: MRFR/CnM/1775-CR
    200 Pages
    Chitranshi Jaiswal
    July 2025

    Ammonia Market Research Report By Application (Fertilizers, Industrial Chemicals, Refrigeration), By Manufacturing Process (Haber-Bosch Process, Electrochemical Process, Others), By End-use Industry (Agriculture, Chemical, Pharmaceutical, Food Beverage), By Form (Anhydrous Ammonia, Aqueous Ammonia, Ammonium Nitrate), and By Regional (North America, Europe, South America, Asia Pacific, Middle Ea...

    Share:
    Download PDF ×

    We do not share your information with anyone. However, we may send you emails based on your report interest from time to time. You may contact us at any time to opt-out.

    Ammonia Market Infographic
    Purchase Options

    Ammonia Size

    Market Size Snapshot
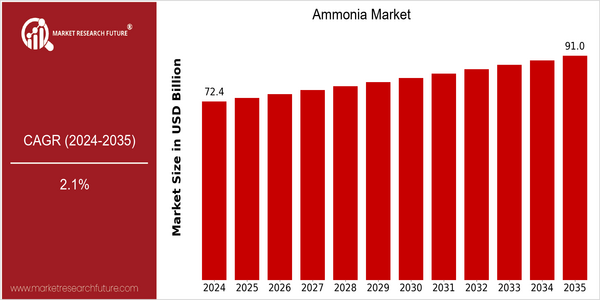
    Year Value
    2024 USD 72.38 Billion
    2035 USD 91.0 Billion
    CAGR (2025-2035) 2.1 %

    Note – Market size depicts the revenue generated over the financial year

    In 2024, the global ammonia market is expected to reach a size of USD 72.38 billion, and is projected to reach a size of USD 91.0 billion by 2035. This growth reflects a CAGR of 2.1% between 2025 and 2035. The growth of the market can be attributed to several factors, such as the increasing demand for fertilizers in the agricultural sector, which is the main source of ammonia consumption. Besides this, the growing focus on sustainable agriculture and the development of green ammonia technology are driving the market. The growing use of renewable energy sources in the production of ammonia is also contributing to the growth of the market. In the future, the market will be led by Yara International and CF Industries, which are investing in sustainable production and developing new products. These efforts not only support the companies' global environmental goals, but also put them in a good position in the competitive landscape, ensuring that they remain in the forefront of the ammonia market.

    home-ubuntu-www-mrf_ne_design-batch-6-cp-ammonia-market size

    Regional Market Size

    Regional Deep Dive

    The ammonia market is characterized by its key role in agriculture, particularly as a fertilizer, and is influenced by various regional dynamics. In North America, the market is driven by a strong agricultural sector and technological innovations in farming. Europe focuses on sustainability and compliance. In Asia-Pacific, rapid urbanization and industrialization are expected to drive demand. In the Middle East and Africa, natural gas resources are being utilized to produce ammonia. The Latin American region is experiencing growth owing to its expanding agricultural sector. Each region has its own set of opportunities and challenges that define the market.

    Europe

    • The European Union's Green Deal aims to make Europe climate-neutral by 2050, prompting ammonia producers to adopt greener technologies and reduce carbon footprints.
    • Companies such as Yara International are leading initiatives to develop ammonia as a hydrogen carrier, aligning with the EU's hydrogen strategy and promoting renewable energy integration.

    Asia Pacific

    • China remains the largest producer and consumer of ammonia, with recent government policies encouraging the use of ammonia in clean energy applications, such as fuel cells.
    • India is ramping up its ammonia production capabilities through projects like the Talcher Fertilizer Plant, which aims to utilize coal gasification technology to produce ammonia sustainably.

    Latin America

    • Brazil is increasing its ammonia production capacity to reduce dependency on imports, with investments in new fertilizer plants aimed at supporting its agricultural sector.
    • Regulatory changes in Argentina are encouraging the use of ammonia in renewable energy projects, which is expected to diversify its applications beyond traditional fertilizers.

    North America

    • The North American ammonia market is experiencing a shift towards more sustainable production methods, with companies like CF Industries investing in carbon capture technologies to reduce emissions.
    • The U.S. government has introduced incentives for green ammonia production, which is expected to drive innovation and attract investments in the sector.

    Middle East And Africa

    • The Middle East is leveraging its abundant natural gas reserves to produce ammonia at competitive prices, with companies like SABIC expanding their production facilities.
    • In Africa, initiatives such as the African Development Bank's 'Feed Africa' strategy are promoting ammonia use in agriculture to enhance food security and boost local economies.

    Did You Know?

    “Ammonia is not only a key ingredient in fertilizers but also plays a significant role in the production of plastics, explosives, and even refrigerants.” — International Fertilizer Association

    Segmental Market Size

    The ammonia market is currently growing steadily, driven primarily by its indispensable role in agriculture as the most important fertilizer. In addition, the increasing population and the consequently growing demand for food production are influencing the development of the market. In addition, the implementation of the so-called “climate policy” by the authorities is pushing the industry towards more sustainable ammonia production, such as hydrogen technology. Yara International and Siemens are currently leading the development of hydrogen-based ammonia production in Europe and North America. The main applications of ammonia are fertilizer for agriculture, chemicals, and energy storage. Among the notable trends are the demand for green ammonia and the carbon footprint policy of the authorities. The development of the industry is characterized by the introduction of more efficient and sustainable production methods such as hydrogen production and carbon capture.

    Future Outlook

    Ammonia market will show a steady growth from 2024 to 2035. The market value is expected to increase from $72.38 billion to $91.09 billion, with a CAGR of 2.1%. The main reason is the rising demand for ammonia in various applications, especially in fertilizers, which accounted for 80% of the total consumption of ammonia. The population is increasing, and the demand for food is increasing, which will drive the demand for ammonia. Especially in the developing countries, the level of agricultural production is still low, and there is a great need to increase agricultural production, which is also the driving force of the development of ammonia. The second reason is that the world has been paying more attention to food security and the development of sustainable agriculture. Ammonia is an important nitrogen source in fertilizers. This will also promote the development of ammonia. The third reason is the technical progress and policy support. The production of green ammonia has been popularized, especially the green ammonia produced by renewable energy. The use of ammonia is more and more popular. The use of ammonia is more and more popular. The technical progress has also been very prominent, such as the use of hydrogen as a nitrogen source, and the use of nitrogen from urea. The trend of the world is also developing towards a low-carbon economy, which is also in line with the sustainable development of the world. The government has also put forward some policies to reduce greenhouse gas emissions and encourage green energy solutions. The trend of integrating hydrogen production with ammonia as a carbon-free fuel will also drive the market.

    Ammonia Market Size Graph
    Author
    Chitranshi Jaiswal
    Research Analyst Level I

    In her 3 years of experience in the market research field, she has handled critical cross-domain projects. She has an in-depth knowledge of market estimation & analysis, problem-solving, primary as well as secondary research, and team management.She holds an engineering degree and is an MBA professional from a well-known university, capable of evaluating the market and competitive conditions. An exceptional strategist with excellent communication skills and a passion for delivering cutting-edge & practical insights for the market. Proficient in multi-tasking, and can successfully deal with competing demands, while maintaining complete confidentiality. Generated business through active client and project development, networking, and high-quality responses. Her knowledge and skills have helped in making solid business decisions, securing funding from investors, and avoiding business failures.

    Leave a Comment

    FAQs

    What is the expected market size of the Global Ammonia Market in 2024?

    The Global Ammonia Market is expected to be valued at 72.38 billion USD in 2024.

    What is the expected CAGR for the Global Ammonia Market from 2025 to 2035?

    Ammonia Market is expected to grow with a CAGR of 5.1% in the period 2025-2035

    Which region is expected to dominate the Global Ammonia Market by 2035?

    By 2035, the Asia-Pacific region is anticipated to have a significant share, valued at 32.0 billion USD.

    What will be the Global Ammonia Market value for fertilizers in 2035?

    The Global Ammonia Market for fertilizers is projected to reach 50.0 billion USD by 2035.

    What is the forecasted market size for the industrial chemicals application of ammonia by 2035?

    The market size for industrial chemicals application of ammonia is expected to be 25.0 billion USD in 2035.

    Which key players operate in the Global Ammonia Market as of 2024?

    Key players in the Global Ammonia Market include Agrium, SABIC, and Yara International.

    How much is the North American ammonia market expected to be valued at in 2035?

    The North American ammonia market is expected to reach a valuation of 19.0 billion USD by 2035.

    What is the estimated value of the Global Ammonia Market in South America by 2035?

    The estimated value of the Global Ammonia Market in South America by 2035 is 7.5 billion USD.

    Market Summary

    As per Market Research Future Analysis, the Global Ammonia Market was valued at 55.94 USD Billion in 2024 and is projected to grow to 96.70 USD Billion by 2035. The market is driven by increasing fertilizer demand, sustainable practices, and industrial applications. The CAGR is expected to be around 2.11% from 2025 to 2035, with significant growth opportunities in green ammonia production and hydrogen energy applications.

    Key Market Trends & Highlights

    The global ammonia market is evolving with key trends shaping its future.

    • Fertilizer Application is projected to grow from 40.0 USD Billion in 2024 to 50.0 USD Billion by 2035. Industrial Chemicals segment expected to rise from 20.0 USD Billion in 2024 to 25.0 USD Billion by 2035. Asia-Pacific region leads with a valuation of 25.0 USD Billion in 2024, driven by agricultural expansion. Sustainable practices are gaining traction, with the European Union aiming to reduce food production's environmental impact by 25% by 2030.

    Market Size & Forecast

    2024 Market Size USD 55.94 Billion
    2035 Market Size USD 96.70 Billion
    CAGR (2025-2035) 5.10%
    Largest Regional Market Share in 2024 Asia-Pacific.

    Major Players

    <p>Key players include Agrium, SABIC, Yara International, Nutrien, and OCI Nitrogen.</p>

    Market Trends

    Numerous factors are driving notable developments in the Ammonia Market at the moment. Since ammonia is a fundamental component of many agricultural goods, the growing need for fertilizers is one important market driver.

    There are more and more opportunities in the Ammonia Market, particularly in the field of green ammonia technology. The creation of sustainable manufacturing techniques, such the synthesis of ammonia using renewable energy, offers a special chance to appeal to environmentally concerned customers and sustainability-minded businesses.

    Global governments are starting to provide funding for these technologies' research and development, which suggests that the ammonia industry is moving toward more ecologically friendly methods. Automation and digitization of ammonia manufacturing processes have been increasingly popular in recent years with the goal of increasing productivity and safety while reducing environmental effect.

    Furthermore, global ammonia supply chains are being impacted by geopolitical issues including trade agreements and changes in energy regulations.


    Ammonia Market Market Drivers

    Global Trade Dynamics

    The Global Ammonia Market Industry is significantly impacted by global trade dynamics, including tariffs, trade agreements, and geopolitical factors. Countries that are major producers of ammonia, such as Russia and the United States, play a crucial role in the global supply chain. Changes in trade policies can influence ammonia prices and availability, affecting industries reliant on this essential compound. As nations navigate complex trade relationships, the ammonia market may experience fluctuations that could either hinder or facilitate growth. Understanding these dynamics is essential for stakeholders in the ammonia industry to strategize effectively.

    Industrial Applications

    The Global Ammonia Market Industry is significantly influenced by its diverse industrial applications, particularly in the production of chemicals and plastics. Ammonia is utilized in the synthesis of various compounds, including ammonium sulfate and nitric acid, which are vital for numerous industrial processes. The increasing industrialization in emerging economies contributes to the growing consumption of ammonia. As industries expand, the demand for ammonia is likely to rise, further solidifying its position in the global market. This trend indicates a robust future for the ammonia market, as it adapts to the evolving needs of various sectors.

    Technological Advancements

    Technological advancements play a pivotal role in shaping the Global Ammonia Market Industry. Innovations in ammonia synthesis processes, such as the Haber-Bosch process, are being optimized to enhance efficiency and reduce energy consumption. Furthermore, the development of alternative production methods, including electrochemical synthesis, holds promise for the future of ammonia production. These advancements not only improve the economic viability of ammonia production but also contribute to sustainability efforts. As technology continues to evolve, it is likely to drive growth in the ammonia market, enabling it to meet the demands of various industries more effectively.

    Market Trends and Projections

    The Global Ammonia Market Industry is projected to experience steady growth, with a market value expected to reach 91 USD Billion by 2035. This growth is underpinned by a compound annual growth rate of 2.1% from 2025 to 2035. Key trends influencing this trajectory include increasing agricultural demands, industrial applications, and technological innovations. As the market evolves, stakeholders must remain vigilant to emerging trends and adapt their strategies accordingly. The interplay of these factors will shape the future landscape of the ammonia market, presenting both challenges and opportunities for industry participants.

    Rising Demand for Fertilizers

    The Global Ammonia Market Industry experiences a notable surge in demand for fertilizers, primarily driven by the need to enhance agricultural productivity. Ammonia serves as a key ingredient in nitrogen-based fertilizers, which are essential for crop growth. As global populations increase, the demand for food escalates, leading to a projected market value of 72.4 USD Billion in 2024. This growth trajectory is expected to continue, with the market anticipated to reach 91 USD Billion by 2035, reflecting a compound annual growth rate of 2.1% from 2025 to 2035. The agricultural sector's reliance on ammonia-based fertilizers underscores its critical role in food security.

    Environmental Regulations and Sustainability

    The Global Ammonia Market Industry faces increasing pressure from environmental regulations aimed at reducing greenhouse gas emissions. Ammonia, while essential for various applications, can contribute to environmental concerns if not managed properly. As a result, there is a growing emphasis on sustainable ammonia production methods, such as green ammonia, which utilizes renewable energy sources. This shift towards sustainability not only aligns with global environmental goals but also opens new avenues for innovation within the ammonia sector. The industry's ability to adapt to these regulations may influence its growth trajectory in the coming years.

    Market Segment Insights

    Ammonia Market Segment Insights

    <p>Ammonia Market Segment Insights</p>

    Ammonia Market Application Insights

    <p>Ammonia Market Application Insights</p>

    <p>The Ammonia Market currently demonstrated significant valuation in various applications. Within this sector, fertilizers emerged as the largest segment, accounting for a considerable share with a valuation of 46.1 USD Billion.</p>

    <p>This indicated that fertilizers dominate the market significantly, as they were essential for agricultural productivity and food security, reflecting the essential role ammonia plays in the production of nitrogen-based fertilizers, which are crucial to enhance crop yields and sustain a growing global population.</p>

    Ammonia Market Manufacturing Process Insights

    <p>Ammonia Market Manufacturing Process Insights</p>

    <p>The Manufacturing Process segment of the Ammonia Market holds considerable significance as it outlines the methods through which ammonia is produced and refined. The Haber-Bosch Process continues to dominate this segment, as it is the most conventional and widely adopted method for ammonia synthesis due to its efficiency and scalability.</p>

    <p>Meanwhile, the Electrochemical Process is gaining attention for its potential to offer a more sustainable and environmentally friendly alternative, aligning with global trends towards greener technologies. Additionally, other methodologies also contribute to the diversity of production techniques available in the market.</p>

    Ammonia Market End-use Industry Insights

    <p>Ammonia Market End-use Industry Insights</p>

    <p>The Ammonia Market is witnessing robust growth, particularly when examining the End-use Industry segment. This segment is critical, as ammonia is a fundamental component in various industries. Agriculture stands out, where ammonia is predominantly used as a fertilizer, enhancing crop yield and food production globally.</p>

    <p>The Chemical industry also plays a significant role, utilizing ammonia as a precursor for numerous chemical products, including plastics and textiles. In the Pharmaceutical sector, ammonia serves essential functions within drug manufacturing processes, highlighting its versatility.</p>

    Ammonia Market Form Insights

    <p>Ammonia Market Form Insights</p>

    <p>The segment encompasses various forms of ammonia, including Anhydrous Ammonia, Aqueous Ammonia, and Ammonium Nitrate, each playing a critical role in the market. Anhydrous Ammonia is notably significant in agriculture as a fertilizer, providing essential nitrogen for crop production, thus driving the demand in the farming sector.</p>

    <p>Meanwhile, Aqueous Ammonia finds extensive applications in industrial cleaning and the production of various chemicals, making it indispensable in diverse industries. <a href="https://www.marketresearchfuture.com/reports/ammonium-nitrate-market-5259">Ammonium Nitrate</a>, on the other hand, is primarily utilized in fertilizers as well and holds substantial importance in the explosive industry for mining and construction.</p>

    Get more detailed insights about Ammonia Market Research Report - Global Forecast till 2035

    Regional Insights

    The Ammonia Market witnessed a significant increase in regional demand, with key areas demonstrating robust growth. In 2024, North America contributed a valuation of 15.25 USD Billion, while Europe held a larger share at 20.5 USD Billion, making it a major market player.

    The Asia Pacific region stood out with the highest valuation at 25.63 USD Billion, reflecting its dominance in the market due to its large-scale agricultural and industrial applications. South America and the Middle East and Africa followed with respective valuations of 5.0 USD Billion and 6.0 USD Billion in 2024, marking their roles as emerging markets in the ammonia sector.

    The overall Ammonia Market data suggested that these regions are driven by increasing fertilizer demand, vital for agricultural productivity, while challenges such as regulatory issues and environmental concerns remain prevalent.

    Each regional segment presented unique opportunities, with Asia Pacific leading the charge due to rapid urbanization and industrial growth, showcasing a lucrative market growth potential. The majority holding in Europe, combined with the growth trajectory in North America, reflects a well-balanced distribution of opportunities across these regions.

    Ammonia Market Regional Insights

    Source: Primary Research, Secondary Research, Market Research Future Database and Analyst Review

    Key Players and Competitive Insights

    The Ammonia Market displays a dynamic competitive landscape characterized by a blend of established players and emerging enterprises, each vying for market share and innovation in production processes. The market is heavily influenced by the rising demand for ammonia in various sectors, such as fertilizers, industrial chemicals, and cleaning agents.

    The need for sustainable production methods further intensifies competition, driving firms to invest in cutting-edge technologies that minimize environmental impact while enhancing efficiency. Diverse geographical influences also shape competitive strategies, as companies navigate regulatory landscapes, resource availability, and regional demand variances.

    This complexity creates opportunities for strategic partnerships, mergers, and collaborations among market players to bolster their position within the industry.

    Petrobras stands out in the Ammonia Market due to its extensive vertical integration and strong operational framework. The company has established a significant market presence through efficient production capacities and access to ample natural resources, which allows it to maintain a competitive edge.

    Petrobras leverages advanced research and development to optimize its ammonia production processes, resulting in lower operational costs and improved product quality. Its geographical footprint, particularly in Latin America, enables it to cater to regional demands effectively while fostering strategic alliances with local distributors to enhance market penetration.

    The strengths of Petrobras lie in its robust supply chain management, a comprehensive understanding of market dynamics, and a committed focus on sustainable practices, aligning its operations with emerging global environmental standards.

    OCI Nitrogen is another key player in the Ammonia Market, recognized for its high-quality ammonia production that supports the agricultural and industrial sectors. The company has positioned itself as a reliable supplier with an expansive network that reaches key markets across the globe, ensuring a steady supply of its core product offerings.

    OCI Nitrogen focuses on innovation and efficiency, utilizing state-of-the-art technologies and sustainable practices in its ammonia production processes. The company's strong market presence is further bolstered by strategic mergers and acquisitions that enhance its operational capabilities and geographic reach.

    Through its commitment to quality and sustainability, OCI Nitrogen not only meets current market demands but also anticipates future trends in ammonia usage, allowing it to stay ahead in the competitive landscape within the Ammonia Market.

    Key Companies in the Ammonia Market market include

    Industry Developments

    • Q2 2024: India launches massive green ammonia investment initiative under SIGHT programme In February 2024, India announced a major green ammonia investment initiative under the SIGHT programme, subsidizing the production of 532,000 tons of renewable ammonia to accelerate decarbonization in agriculture and energy applications.


    Future Outlook

    Ammonia Market Future Outlook

    <p>The Global Ammonia Market is projected to grow at a 2.10% CAGR from 2025 to 2035, driven by increasing agricultural demand, sustainable production methods, and technological advancements.</p>

    New opportunities lie in:

    • <p>Invest in green ammonia production technologies to meet rising environmental regulations. Develop ammonia-based fertilizers tailored for specific crops to enhance yield efficiency. Explore ammonia as a hydrogen carrier for renewable energy applications.</p>

    <p>By 2035, the Global Ammonia Market is expected to exhibit robust growth, reflecting evolving agricultural and energy sector dynamics.</p>

    Market Segmentation

    Ammonia Market Form Outlook

    • Anhydrous Ammonia
    • Aqueous Ammonia
    • Ammonium Nitrate

    Ammonia Market Regional Outlook

    • North America
    • Europe
    • South America
    • Asia Pacific
    • Middle East and Africa

    Ammonia Market Application Outlook

    • Fertilizers
    • Industrial Chemicals
    • Refrigeration

    Ammonia Market End-use Industry Outlook

    • Agriculture
    • Chemical
    • Pharmaceutical
    • Food Beverage

    Ammonia Market Manufacturing Process Outlook

    • Haber-Bosch Process
    • Electrochemical Process
    • Others

    Report Scope

    Report Attribute/Metric Details
    Market Size 2024 72.38(USD Billion)
    Market Size 2035 96.70 (USD Billion)
    Compound Annual Growth Rate (CAGR) 5.10% (2025 - 2035)
    Report Coverage Revenue Forecast, Competitive Landscape, Growth Factors, and Trends
    Base Year 2024
    Market Forecast Period 2025 - 2035
    Historical Data 2019 - 2024
    Market Forecast Units USD Billion
    Key Companies Profiled Petrobras, OCI Nitrogen, CF Industries, Yara International, JM Huber, K+S Aktiengesellschaft, Nutrien, Koch Industries, Indian Farmers Fertiliser Cooperative, Agrium, BASF, Mitsubishi Gas Chemical, Orica, EuroChem, SABIC
    Segments Covered Application, Manufacturing Process, End-use Industry, Form, Regional
    Key Market Opportunities Sustainable ammonia production methods, Fertilizer demand growth, Hydrogen fuel development, Anhydrous ammonia applications, Emerging markets expansion.
    Key Market Dynamics increasing fertilizer demand, environmental regulations impact, volatile raw material prices, technological advancements, global supply chain challenges
    Countries Covered North America, Europe, APAC, South America, MEA
    Market Size 2025 58.79 (USD Billion)

    FAQs

    What is the expected market size of the Global Ammonia Market in 2024?

    The Global Ammonia Market is expected to be valued at 72.38 billion USD in 2024.

    What is the expected CAGR for the Global Ammonia Market from 2025 to 2035?

    Ammonia Market is expected to grow with a CAGR of 5.1% in the period 2025-2035

    Which region is expected to dominate the Global Ammonia Market by 2035?

    By 2035, the Asia-Pacific region is anticipated to have a significant share, valued at 32.0 billion USD.

    What will be the Global Ammonia Market value for fertilizers in 2035?

    The Global Ammonia Market for fertilizers is projected to reach 50.0 billion USD by 2035.

    What is the forecasted market size for the industrial chemicals application of ammonia by 2035?

    The market size for industrial chemicals application of ammonia is expected to be 25.0 billion USD in 2035.

    Which key players operate in the Global Ammonia Market as of 2024?

    Key players in the Global Ammonia Market include Agrium, SABIC, and Yara International.

    How much is the North American ammonia market expected to be valued at in 2035?

    The North American ammonia market is expected to reach a valuation of 19.0 billion USD by 2035.

    What is the estimated value of the Global Ammonia Market in South America by 2035?

    The estimated value of the Global Ammonia Market in South America by 2035 is 7.5 billion USD.

    1. SECTION I: EXECUTIVE SUMMARY AND KEY HIGHLIGHTS
      1. | 1.1 EXECUTIVE SUMMARY
      2. | | 1.1.1 Market Overview
      3. | | 1.1.2 Key Findings
      4. | | 1.1.3 Market Segmentation
      5. | | 1.1.4 Competitive Landscape
      6. | | 1.1.5 Challenges and Opportunities
      7. | | 1.1.6 Future Outlook
    2. SECTION II: SCOPING, METHODOLOGY AND MARKET STRUCTURE
      1. | 2.1 MARKET INTRODUCTION
      2. | | 2.1.1 Definition
      3. | | 2.1.2 Scope of the study
      4. | | | 2.1.2.1 Research Objective
      5. | | | 2.1.2.2 Assumption
      6. | | | 2.1.2.3 Limitations
      7. | 2.2 RESEARCH METHODOLOGY
      8. | | 2.2.1 Overview
      9. | | 2.2.2 Data Mining
      10. | | 2.2.3 Secondary Research
      11. | | 2.2.4 Primary Research
      12. | | | 2.2.4.1 Primary Interviews and Information Gathering Process
      13. | | | 2.2.4.2 Breakdown of Primary Respondents
      14. | | 2.2.5 Forecasting Model
      15. | | 2.2.6 Market Size Estimation
      16. | | | 2.2.6.1 Bottom-Up Approach
      17. | | | 2.2.6.2 Top-Down Approach
      18. | | 2.2.7 Data Triangulation
      19. | | 2.2.8 Validation
    3. SECTION III: QUALITATIVE ANALYSIS
      1. | 3.1 MARKET DYNAMICS
      2. | | 3.1.1 Overview
      3. | | 3.1.2 Drivers
      4. | | 3.1.3 Restraints
      5. | | 3.1.4 Opportunities
      6. | 3.2 MARKET FACTOR ANALYSIS
      7. | | 3.2.1 Value chain Analysis
      8. | | 3.2.2 Porter's Five Forces Analysis
      9. | | | 3.2.2.1 Bargaining Power of Suppliers
      10. | | | 3.2.2.2 Bargaining Power of Buyers
      11. | | | 3.2.2.3 Threat of New Entrants
      12. | | | 3.2.2.4 Threat of Substitutes
      13. | | | 3.2.2.5 Intensity of Rivalry
      14. | | 3.2.3 COVID-19 Impact Analysis
      15. | | | 3.2.3.1 Market Impact Analysis
      16. | | | 3.2.3.2 Regional Impact
      17. | | | 3.2.3.3 Opportunity and Threat Analysis
    4. SECTION IV: QUANTITATIVE ANALYSIS
      1. | 4.1 Chemicals and Materials, BY Application (USD Billion)
      2. | | 4.1.1 Fertilizers
      3. | | 4.1.2 Industrial Chemicals
      4. | | 4.1.3 Refrigeration
      5. | 4.2 Chemicals and Materials, BY Manufacturing Process (USD Billion)
      6. | | 4.2.1 Haber-Bosch Process
      7. | | 4.2.2 Electrochemical Process
      8. | | 4.2.3 Others
      9. | 4.3 Chemicals and Materials, BY End-use Industry (USD Billion)
      10. | | 4.3.1 Agriculture
      11. | | 4.3.2 Chemical
      12. | | 4.3.3 Pharmaceutical
      13. | | 4.3.4 Food Beverage
      14. | 4.4 Chemicals and Materials, BY Form (USD Billion)
      15. | | 4.4.1 Anhydrous Ammonia
      16. | | 4.4.2 Aqueous Ammonia
      17. | | 4.4.3 Ammonium Nitrate
      18. | 4.5 Chemicals and Materials, BY Region (USD Billion)
      19. | | 4.5.1 North America
      20. | | | 4.5.1.1 US
      21. | | | 4.5.1.2 Canada
      22. | | 4.5.2 Europe
      23. | | | 4.5.2.1 Germany
      24. | | | 4.5.2.2 UK
      25. | | | 4.5.2.3 France
      26. | | | 4.5.2.4 Russia
      27. | | | 4.5.2.5 Italy
      28. | | | 4.5.2.6 Spain
      29. | | | 4.5.2.7 Rest of Europe
      30. | | 4.5.3 APAC
      31. | | | 4.5.3.1 China
      32. | | | 4.5.3.2 India
      33. | | | 4.5.3.3 Japan
      34. | | | 4.5.3.4 South Korea
      35. | | | 4.5.3.5 Malaysia
      36. | | | 4.5.3.6 Thailand
      37. | | | 4.5.3.7 Indonesia
      38. | | | 4.5.3.8 Rest of APAC
      39. | | 4.5.4 South America
      40. | | | 4.5.4.1 Brazil
      41. | | | 4.5.4.2 Mexico
      42. | | | 4.5.4.3 Argentina
      43. | | | 4.5.4.4 Rest of South America
      44. | | 4.5.5 MEA
      45. | | | 4.5.5.1 GCC Countries
      46. | | | 4.5.5.2 South Africa
      47. | | | 4.5.5.3 Rest of MEA
    5. SECTION V: COMPETITIVE ANALYSIS
      1. | 5.1 Competitive Landscape
      2. | | 5.1.1 Overview
      3. | | 5.1.2 Competitive Analysis
      4. | | 5.1.3 Market share Analysis
      5. | | 5.1.4 Major Growth Strategy in the Chemicals and Materials
      6. | | 5.1.5 Competitive Benchmarking
      7. | | 5.1.6 Leading Players in Terms of Number of Developments in the Chemicals and Materials
      8. | | 5.1.7 Key developments and growth strategies
      9. | | | 5.1.7.1 New Product Launch/Service Deployment
      10. | | | 5.1.7.2 Merger & Acquisitions
      11. | | | 5.1.7.3 Joint Ventures
      12. | | 5.1.8 Major Players Financial Matrix
      13. | | | 5.1.8.1 Sales and Operating Income
      14. | | | 5.1.8.2 Major Players R&D Expenditure. 2023
      15. | 5.2 Company Profiles
      16. | | 5.2.1 Yara International (NO)
      17. | | | 5.2.1.1 Financial Overview
      18. | | | 5.2.1.2 Products Offered
      19. | | | 5.2.1.3 Key Developments
      20. | | | 5.2.1.4 SWOT Analysis
      21. | | | 5.2.1.5 Key Strategies
      22. | | 5.2.2 CF Industries (US)
      23. | | | 5.2.2.1 Financial Overview
      24. | | | 5.2.2.2 Products Offered
      25. | | | 5.2.2.3 Key Developments
      26. | | | 5.2.2.4 SWOT Analysis
      27. | | | 5.2.2.5 Key Strategies
      28. | | 5.2.3 Nutrien (CA)
      29. | | | 5.2.3.1 Financial Overview
      30. | | | 5.2.3.2 Products Offered
      31. | | | 5.2.3.3 Key Developments
      32. | | | 5.2.3.4 SWOT Analysis
      33. | | | 5.2.3.5 Key Strategies
      34. | | 5.2.4 BASF (DE)
      35. | | | 5.2.4.1 Financial Overview
      36. | | | 5.2.4.2 Products Offered
      37. | | | 5.2.4.3 Key Developments
      38. | | | 5.2.4.4 SWOT Analysis
      39. | | | 5.2.4.5 Key Strategies
      40. | | 5.2.5 Koch Industries (US)
      41. | | | 5.2.5.1 Financial Overview
      42. | | | 5.2.5.2 Products Offered
      43. | | | 5.2.5.3 Key Developments
      44. | | | 5.2.5.4 SWOT Analysis
      45. | | | 5.2.5.5 Key Strategies
      46. | | 5.2.6 OCI Nitrogen (NL)
      47. | | | 5.2.6.1 Financial Overview
      48. | | | 5.2.6.2 Products Offered
      49. | | | 5.2.6.3 Key Developments
      50. | | | 5.2.6.4 SWOT Analysis
      51. | | | 5.2.6.5 Key Strategies
      52. | | 5.2.7 Mitsui & Co. (JP)
      53. | | | 5.2.7.1 Financial Overview
      54. | | | 5.2.7.2 Products Offered
      55. | | | 5.2.7.3 Key Developments
      56. | | | 5.2.7.4 SWOT Analysis
      57. | | | 5.2.7.5 Key Strategies
      58. | | 5.2.8 Agrium (CA)
      59. | | | 5.2.8.1 Financial Overview
      60. | | | 5.2.8.2 Products Offered
      61. | | | 5.2.8.3 Key Developments
      62. | | | 5.2.8.4 SWOT Analysis
      63. | | | 5.2.8.5 Key Strategies
      64. | | 5.2.9 SABIC (SA)
      65. | | | 5.2.9.1 Financial Overview
      66. | | | 5.2.9.2 Products Offered
      67. | | | 5.2.9.3 Key Developments
      68. | | | 5.2.9.4 SWOT Analysis
      69. | | | 5.2.9.5 Key Strategies
      70. | 5.3 Appendix
      71. | | 5.3.1 References
      72. | | 5.3.2 Related Reports
    6. LIST OF FIGURES
      1. | 6.1 MARKET SYNOPSIS
      2. | 6.2 NORTH AMERICA MARKET ANALYSIS
      3. | 6.3 US MARKET ANALYSIS BY APPLICATION
      4. | 6.4 US MARKET ANALYSIS BY MANUFACTURING PROCESS
      5. | 6.5 US MARKET ANALYSIS BY END-USE INDUSTRY
      6. | 6.6 US MARKET ANALYSIS BY FORM
      7. | 6.7 CANADA MARKET ANALYSIS BY APPLICATION
      8. | 6.8 CANADA MARKET ANALYSIS BY MANUFACTURING PROCESS
      9. | 6.9 CANADA MARKET ANALYSIS BY END-USE INDUSTRY
      10. | 6.10 CANADA MARKET ANALYSIS BY FORM
      11. | 6.11 EUROPE MARKET ANALYSIS
      12. | 6.12 GERMANY MARKET ANALYSIS BY APPLICATION
      13. | 6.13 GERMANY MARKET ANALYSIS BY MANUFACTURING PROCESS
      14. | 6.14 GERMANY MARKET ANALYSIS BY END-USE INDUSTRY
      15. | 6.15 GERMANY MARKET ANALYSIS BY FORM
      16. | 6.16 UK MARKET ANALYSIS BY APPLICATION
      17. | 6.17 UK MARKET ANALYSIS BY MANUFACTURING PROCESS
      18. | 6.18 UK MARKET ANALYSIS BY END-USE INDUSTRY
      19. | 6.19 UK MARKET ANALYSIS BY FORM
      20. | 6.20 FRANCE MARKET ANALYSIS BY APPLICATION
      21. | 6.21 FRANCE MARKET ANALYSIS BY MANUFACTURING PROCESS
      22. | 6.22 FRANCE MARKET ANALYSIS BY END-USE INDUSTRY
      23. | 6.23 FRANCE MARKET ANALYSIS BY FORM
      24. | 6.24 RUSSIA MARKET ANALYSIS BY APPLICATION
      25. | 6.25 RUSSIA MARKET ANALYSIS BY MANUFACTURING PROCESS
      26. | 6.26 RUSSIA MARKET ANALYSIS BY END-USE INDUSTRY
      27. | 6.27 RUSSIA MARKET ANALYSIS BY FORM
      28. | 6.28 ITALY MARKET ANALYSIS BY APPLICATION
      29. | 6.29 ITALY MARKET ANALYSIS BY MANUFACTURING PROCESS
      30. | 6.30 ITALY MARKET ANALYSIS BY END-USE INDUSTRY
      31. | 6.31 ITALY MARKET ANALYSIS BY FORM
      32. | 6.32 SPAIN MARKET ANALYSIS BY APPLICATION
      33. | 6.33 SPAIN MARKET ANALYSIS BY MANUFACTURING PROCESS
      34. | 6.34 SPAIN MARKET ANALYSIS BY END-USE INDUSTRY
      35. | 6.35 SPAIN MARKET ANALYSIS BY FORM
      36. | 6.36 REST OF EUROPE MARKET ANALYSIS BY APPLICATION
      37. | 6.37 REST OF EUROPE MARKET ANALYSIS BY MANUFACTURING PROCESS
      38. | 6.38 REST OF EUROPE MARKET ANALYSIS BY END-USE INDUSTRY
      39. | 6.39 REST OF EUROPE MARKET ANALYSIS BY FORM
      40. | 6.40 APAC MARKET ANALYSIS
      41. | 6.41 CHINA MARKET ANALYSIS BY APPLICATION
      42. | 6.42 CHINA MARKET ANALYSIS BY MANUFACTURING PROCESS
      43. | 6.43 CHINA MARKET ANALYSIS BY END-USE INDUSTRY
      44. | 6.44 CHINA MARKET ANALYSIS BY FORM
      45. | 6.45 INDIA MARKET ANALYSIS BY APPLICATION
      46. | 6.46 INDIA MARKET ANALYSIS BY MANUFACTURING PROCESS
      47. | 6.47 INDIA MARKET ANALYSIS BY END-USE INDUSTRY
      48. | 6.48 INDIA MARKET ANALYSIS BY FORM
      49. | 6.49 JAPAN MARKET ANALYSIS BY APPLICATION
      50. | 6.50 JAPAN MARKET ANALYSIS BY MANUFACTURING PROCESS
      51. | 6.51 JAPAN MARKET ANALYSIS BY END-USE INDUSTRY
      52. | 6.52 JAPAN MARKET ANALYSIS BY FORM
      53. | 6.53 SOUTH KOREA MARKET ANALYSIS BY APPLICATION
      54. | 6.54 SOUTH KOREA MARKET ANALYSIS BY MANUFACTURING PROCESS
      55. | 6.55 SOUTH KOREA MARKET ANALYSIS BY END-USE INDUSTRY
      56. | 6.56 SOUTH KOREA MARKET ANALYSIS BY FORM
      57. | 6.57 MALAYSIA MARKET ANALYSIS BY APPLICATION
      58. | 6.58 MALAYSIA MARKET ANALYSIS BY MANUFACTURING PROCESS
      59. | 6.59 MALAYSIA MARKET ANALYSIS BY END-USE INDUSTRY
      60. | 6.60 MALAYSIA MARKET ANALYSIS BY FORM
      61. | 6.61 THAILAND MARKET ANALYSIS BY APPLICATION
      62. | 6.62 THAILAND MARKET ANALYSIS BY MANUFACTURING PROCESS
      63. | 6.63 THAILAND MARKET ANALYSIS BY END-USE INDUSTRY
      64. | 6.64 THAILAND MARKET ANALYSIS BY FORM
      65. | 6.65 INDONESIA MARKET ANALYSIS BY APPLICATION
      66. | 6.66 INDONESIA MARKET ANALYSIS BY MANUFACTURING PROCESS
      67. | 6.67 INDONESIA MARKET ANALYSIS BY END-USE INDUSTRY
      68. | 6.68 INDONESIA MARKET ANALYSIS BY FORM
      69. | 6.69 REST OF APAC MARKET ANALYSIS BY APPLICATION
      70. | 6.70 REST OF APAC MARKET ANALYSIS BY MANUFACTURING PROCESS
      71. | 6.71 REST OF APAC MARKET ANALYSIS BY END-USE INDUSTRY
      72. | 6.72 REST OF APAC MARKET ANALYSIS BY FORM
      73. | 6.73 SOUTH AMERICA MARKET ANALYSIS
      74. | 6.74 BRAZIL MARKET ANALYSIS BY APPLICATION
      75. | 6.75 BRAZIL MARKET ANALYSIS BY MANUFACTURING PROCESS
      76. | 6.76 BRAZIL MARKET ANALYSIS BY END-USE INDUSTRY
      77. | 6.77 BRAZIL MARKET ANALYSIS BY FORM
      78. | 6.78 MEXICO MARKET ANALYSIS BY APPLICATION
      79. | 6.79 MEXICO MARKET ANALYSIS BY MANUFACTURING PROCESS
      80. | 6.80 MEXICO MARKET ANALYSIS BY END-USE INDUSTRY
      81. | 6.81 MEXICO MARKET ANALYSIS BY FORM
      82. | 6.82 ARGENTINA MARKET ANALYSIS BY APPLICATION
      83. | 6.83 ARGENTINA MARKET ANALYSIS BY MANUFACTURING PROCESS
      84. | 6.84 ARGENTINA MARKET ANALYSIS BY END-USE INDUSTRY
      85. | 6.85 ARGENTINA MARKET ANALYSIS BY FORM
      86. | 6.86 REST OF SOUTH AMERICA MARKET ANALYSIS BY APPLICATION
      87. | 6.87 REST OF SOUTH AMERICA MARKET ANALYSIS BY MANUFACTURING PROCESS
      88. | 6.88 REST OF SOUTH AMERICA MARKET ANALYSIS BY END-USE INDUSTRY
      89. | 6.89 REST OF SOUTH AMERICA MARKET ANALYSIS BY FORM
      90. | 6.90 MEA MARKET ANALYSIS
      91. | 6.91 GCC COUNTRIES MARKET ANALYSIS BY APPLICATION
      92. | 6.92 GCC COUNTRIES MARKET ANALYSIS BY MANUFACTURING PROCESS
      93. | 6.93 GCC COUNTRIES MARKET ANALYSIS BY END-USE INDUSTRY
      94. | 6.94 GCC COUNTRIES MARKET ANALYSIS BY FORM
      95. | 6.95 SOUTH AFRICA MARKET ANALYSIS BY APPLICATION
      96. | 6.96 SOUTH AFRICA MARKET ANALYSIS BY MANUFACTURING PROCESS
      97. | 6.97 SOUTH AFRICA MARKET ANALYSIS BY END-USE INDUSTRY
      98. | 6.98 SOUTH AFRICA MARKET ANALYSIS BY FORM
      99. | 6.99 REST OF MEA MARKET ANALYSIS BY APPLICATION
      100. | 6.100 REST OF MEA MARKET ANALYSIS BY MANUFACTURING PROCESS
      101. | 6.101 REST OF MEA MARKET ANALYSIS BY END-USE INDUSTRY
      102. | 6.102 REST OF MEA MARKET ANALYSIS BY FORM
      103. | 6.103 KEY BUYING CRITERIA OF CHEMICALS AND MATERIALS
      104. | 6.104 RESEARCH PROCESS OF MRFR
      105. | 6.105 DRO ANALYSIS OF CHEMICALS AND MATERIALS
      106. | 6.106 DRIVERS IMPACT ANALYSIS: CHEMICALS AND MATERIALS
      107. | 6.107 RESTRAINTS IMPACT ANALYSIS: CHEMICALS AND MATERIALS
      108. | 6.108 SUPPLY / VALUE CHAIN: CHEMICALS AND MATERIALS
      109. | 6.109 CHEMICALS AND MATERIALS, BY APPLICATION, 2024 (% SHARE)
      110. | 6.110 CHEMICALS AND MATERIALS, BY APPLICATION, 2024 TO 2035 (USD Billion)
      111. | 6.111 CHEMICALS AND MATERIALS, BY MANUFACTURING PROCESS, 2024 (% SHARE)
      112. | 6.112 CHEMICALS AND MATERIALS, BY MANUFACTURING PROCESS, 2024 TO 2035 (USD Billion)
      113. | 6.113 CHEMICALS AND MATERIALS, BY END-USE INDUSTRY, 2024 (% SHARE)
      114. | 6.114 CHEMICALS AND MATERIALS, BY END-USE INDUSTRY, 2024 TO 2035 (USD Billion)
      115. | 6.115 CHEMICALS AND MATERIALS, BY FORM, 2024 (% SHARE)
      116. | 6.116 CHEMICALS AND MATERIALS, BY FORM, 2024 TO 2035 (USD Billion)
      117. | 6.117 BENCHMARKING OF MAJOR COMPETITORS
    7. LIST OF TABLES
      1. | 7.1 LIST OF ASSUMPTIONS
      2. | | 7.1.1
      3. | 7.2 North America MARKET SIZE ESTIMATES; FORECAST
      4. | | 7.2.1 BY APPLICATION, 2025-2035 (USD Billion)
      5. | | 7.2.2 BY MANUFACTURING PROCESS, 2025-2035 (USD Billion)
      6. | | 7.2.3 BY END-USE INDUSTRY, 2025-2035 (USD Billion)
      7. | | 7.2.4 BY FORM, 2025-2035 (USD Billion)
      8. | 7.3 US MARKET SIZE ESTIMATES; FORECAST
      9. | | 7.3.1 BY APPLICATION, 2025-2035 (USD Billion)
      10. | | 7.3.2 BY MANUFACTURING PROCESS, 2025-2035 (USD Billion)
      11. | | 7.3.3 BY END-USE INDUSTRY, 2025-2035 (USD Billion)
      12. | | 7.3.4 BY FORM, 2025-2035 (USD Billion)
      13. | 7.4 Canada MARKET SIZE ESTIMATES; FORECAST
      14. | | 7.4.1 BY APPLICATION, 2025-2035 (USD Billion)
      15. | | 7.4.2 BY MANUFACTURING PROCESS, 2025-2035 (USD Billion)
      16. | | 7.4.3 BY END-USE INDUSTRY, 2025-2035 (USD Billion)
      17. | | 7.4.4 BY FORM, 2025-2035 (USD Billion)
      18. | 7.5 Europe MARKET SIZE ESTIMATES; FORECAST
      19. | | 7.5.1 BY APPLICATION, 2025-2035 (USD Billion)
      20. | | 7.5.2 BY MANUFACTURING PROCESS, 2025-2035 (USD Billion)
      21. | | 7.5.3 BY END-USE INDUSTRY, 2025-2035 (USD Billion)
      22. | | 7.5.4 BY FORM, 2025-2035 (USD Billion)
      23. | 7.6 Germany MARKET SIZE ESTIMATES; FORECAST
      24. | | 7.6.1 BY APPLICATION, 2025-2035 (USD Billion)
      25. | | 7.6.2 BY MANUFACTURING PROCESS, 2025-2035 (USD Billion)
      26. | | 7.6.3 BY END-USE INDUSTRY, 2025-2035 (USD Billion)
      27. | | 7.6.4 BY FORM, 2025-2035 (USD Billion)
      28. | 7.7 UK MARKET SIZE ESTIMATES; FORECAST
      29. | | 7.7.1 BY APPLICATION, 2025-2035 (USD Billion)
      30. | | 7.7.2 BY MANUFACTURING PROCESS, 2025-2035 (USD Billion)
      31. | | 7.7.3 BY END-USE INDUSTRY, 2025-2035 (USD Billion)
      32. | | 7.7.4 BY FORM, 2025-2035 (USD Billion)
      33. | 7.8 France MARKET SIZE ESTIMATES; FORECAST
      34. | | 7.8.1 BY APPLICATION, 2025-2035 (USD Billion)
      35. | | 7.8.2 BY MANUFACTURING PROCESS, 2025-2035 (USD Billion)
      36. | | 7.8.3 BY END-USE INDUSTRY, 2025-2035 (USD Billion)
      37. | | 7.8.4 BY FORM, 2025-2035 (USD Billion)
      38. | 7.9 Russia MARKET SIZE ESTIMATES; FORECAST
      39. | | 7.9.1 BY APPLICATION, 2025-2035 (USD Billion)
      40. | | 7.9.2 BY MANUFACTURING PROCESS, 2025-2035 (USD Billion)
      41. | | 7.9.3 BY END-USE INDUSTRY, 2025-2035 (USD Billion)
      42. | | 7.9.4 BY FORM, 2025-2035 (USD Billion)
      43. | 7.10 Italy MARKET SIZE ESTIMATES; FORECAST
      44. | | 7.10.1 BY APPLICATION, 2025-2035 (USD Billion)
      45. | | 7.10.2 BY MANUFACTURING PROCESS, 2025-2035 (USD Billion)
      46. | | 7.10.3 BY END-USE INDUSTRY, 2025-2035 (USD Billion)
      47. | | 7.10.4 BY FORM, 2025-2035 (USD Billion)
      48. | 7.11 Spain MARKET SIZE ESTIMATES; FORECAST
      49. | | 7.11.1 BY APPLICATION, 2025-2035 (USD Billion)
      50. | | 7.11.2 BY MANUFACTURING PROCESS, 2025-2035 (USD Billion)
      51. | | 7.11.3 BY END-USE INDUSTRY, 2025-2035 (USD Billion)
      52. | | 7.11.4 BY FORM, 2025-2035 (USD Billion)
      53. | 7.12 Rest of Europe MARKET SIZE ESTIMATES; FORECAST
      54. | | 7.12.1 BY APPLICATION, 2025-2035 (USD Billion)
      55. | | 7.12.2 BY MANUFACTURING PROCESS, 2025-2035 (USD Billion)
      56. | | 7.12.3 BY END-USE INDUSTRY, 2025-2035 (USD Billion)
      57. | | 7.12.4 BY FORM, 2025-2035 (USD Billion)
      58. | 7.13 APAC MARKET SIZE ESTIMATES; FORECAST
      59. | | 7.13.1 BY APPLICATION, 2025-2035 (USD Billion)
      60. | | 7.13.2 BY MANUFACTURING PROCESS, 2025-2035 (USD Billion)
      61. | | 7.13.3 BY END-USE INDUSTRY, 2025-2035 (USD Billion)
      62. | | 7.13.4 BY FORM, 2025-2035 (USD Billion)
      63. | 7.14 China MARKET SIZE ESTIMATES; FORECAST
      64. | | 7.14.1 BY APPLICATION, 2025-2035 (USD Billion)
      65. | | 7.14.2 BY MANUFACTURING PROCESS, 2025-2035 (USD Billion)
      66. | | 7.14.3 BY END-USE INDUSTRY, 2025-2035 (USD Billion)
      67. | | 7.14.4 BY FORM, 2025-2035 (USD Billion)
      68. | 7.15 India MARKET SIZE ESTIMATES; FORECAST
      69. | | 7.15.1 BY APPLICATION, 2025-2035 (USD Billion)
      70. | | 7.15.2 BY MANUFACTURING PROCESS, 2025-2035 (USD Billion)
      71. | | 7.15.3 BY END-USE INDUSTRY, 2025-2035 (USD Billion)
      72. | | 7.15.4 BY FORM, 2025-2035 (USD Billion)
      73. | 7.16 Japan MARKET SIZE ESTIMATES; FORECAST
      74. | | 7.16.1 BY APPLICATION, 2025-2035 (USD Billion)
      75. | | 7.16.2 BY MANUFACTURING PROCESS, 2025-2035 (USD Billion)
      76. | | 7.16.3 BY END-USE INDUSTRY, 2025-2035 (USD Billion)
      77. | | 7.16.4 BY FORM, 2025-2035 (USD Billion)
      78. | 7.17 South Korea MARKET SIZE ESTIMATES; FORECAST
      79. | | 7.17.1 BY APPLICATION, 2025-2035 (USD Billion)
      80. | | 7.17.2 BY MANUFACTURING PROCESS, 2025-2035 (USD Billion)
      81. | | 7.17.3 BY END-USE INDUSTRY, 2025-2035 (USD Billion)
      82. | | 7.17.4 BY FORM, 2025-2035 (USD Billion)
      83. | 7.18 Malaysia MARKET SIZE ESTIMATES; FORECAST
      84. | | 7.18.1 BY APPLICATION, 2025-2035 (USD Billion)
      85. | | 7.18.2 BY MANUFACTURING PROCESS, 2025-2035 (USD Billion)
      86. | | 7.18.3 BY END-USE INDUSTRY, 2025-2035 (USD Billion)
      87. | | 7.18.4 BY FORM, 2025-2035 (USD Billion)
      88. | 7.19 Thailand MARKET SIZE ESTIMATES; FORECAST
      89. | | 7.19.1 BY APPLICATION, 2025-2035 (USD Billion)
      90. | | 7.19.2 BY MANUFACTURING PROCESS, 2025-2035 (USD Billion)
      91. | | 7.19.3 BY END-USE INDUSTRY, 2025-2035 (USD Billion)
      92. | | 7.19.4 BY FORM, 2025-2035 (USD Billion)
      93. | 7.20 Indonesia MARKET SIZE ESTIMATES; FORECAST
      94. | | 7.20.1 BY APPLICATION, 2025-2035 (USD Billion)
      95. | | 7.20.2 BY MANUFACTURING PROCESS, 2025-2035 (USD Billion)
      96. | | 7.20.3 BY END-USE INDUSTRY, 2025-2035 (USD Billion)
      97. | | 7.20.4 BY FORM, 2025-2035 (USD Billion)
      98. | 7.21 Rest of APAC MARKET SIZE ESTIMATES; FORECAST
      99. | | 7.21.1 BY APPLICATION, 2025-2035 (USD Billion)
      100. | | 7.21.2 BY MANUFACTURING PROCESS, 2025-2035 (USD Billion)
      101. | | 7.21.3 BY END-USE INDUSTRY, 2025-2035 (USD Billion)
      102. | | 7.21.4 BY FORM, 2025-2035 (USD Billion)
      103. | 7.22 South America MARKET SIZE ESTIMATES; FORECAST
      104. | | 7.22.1 BY APPLICATION, 2025-2035 (USD Billion)
      105. | | 7.22.2 BY MANUFACTURING PROCESS, 2025-2035 (USD Billion)
      106. | | 7.22.3 BY END-USE INDUSTRY, 2025-2035 (USD Billion)
      107. | | 7.22.4 BY FORM, 2025-2035 (USD Billion)
      108. | 7.23 Brazil MARKET SIZE ESTIMATES; FORECAST
      109. | | 7.23.1 BY APPLICATION, 2025-2035 (USD Billion)
      110. | | 7.23.2 BY MANUFACTURING PROCESS, 2025-2035 (USD Billion)
      111. | | 7.23.3 BY END-USE INDUSTRY, 2025-2035 (USD Billion)
      112. | | 7.23.4 BY FORM, 2025-2035 (USD Billion)
      113. | 7.24 Mexico MARKET SIZE ESTIMATES; FORECAST
      114. | | 7.24.1 BY APPLICATION, 2025-2035 (USD Billion)
      115. | | 7.24.2 BY MANUFACTURING PROCESS, 2025-2035 (USD Billion)
      116. | | 7.24.3 BY END-USE INDUSTRY, 2025-2035 (USD Billion)
      117. | | 7.24.4 BY FORM, 2025-2035 (USD Billion)
      118. | 7.25 Argentina MARKET SIZE ESTIMATES; FORECAST
      119. | | 7.25.1 BY APPLICATION, 2025-2035 (USD Billion)
      120. | | 7.25.2 BY MANUFACTURING PROCESS, 2025-2035 (USD Billion)
      121. | | 7.25.3 BY END-USE INDUSTRY, 2025-2035 (USD Billion)
      122. | | 7.25.4 BY FORM, 2025-2035 (USD Billion)
      123. | 7.26 Rest of South America MARKET SIZE ESTIMATES; FORECAST
      124. | | 7.26.1 BY APPLICATION, 2025-2035 (USD Billion)
      125. | | 7.26.2 BY MANUFACTURING PROCESS, 2025-2035 (USD Billion)
      126. | | 7.26.3 BY END-USE INDUSTRY, 2025-2035 (USD Billion)
      127. | | 7.26.4 BY FORM, 2025-2035 (USD Billion)
      128. | 7.27 MEA MARKET SIZE ESTIMATES; FORECAST
      129. | | 7.27.1 BY APPLICATION, 2025-2035 (USD Billion)
      130. | | 7.27.2 BY MANUFACTURING PROCESS, 2025-2035 (USD Billion)
      131. | | 7.27.3 BY END-USE INDUSTRY, 2025-2035 (USD Billion)
      132. | | 7.27.4 BY FORM, 2025-2035 (USD Billion)
      133. | 7.28 GCC Countries MARKET SIZE ESTIMATES; FORECAST
      134. | | 7.28.1 BY APPLICATION, 2025-2035 (USD Billion)
      135. | | 7.28.2 BY MANUFACTURING PROCESS, 2025-2035 (USD Billion)
      136. | | 7.28.3 BY END-USE INDUSTRY, 2025-2035 (USD Billion)
      137. | | 7.28.4 BY FORM, 2025-2035 (USD Billion)
      138. | 7.29 South Africa MARKET SIZE ESTIMATES; FORECAST
      139. | | 7.29.1 BY APPLICATION, 2025-2035 (USD Billion)
      140. | | 7.29.2 BY MANUFACTURING PROCESS, 2025-2035 (USD Billion)
      141. | | 7.29.3 BY END-USE INDUSTRY, 2025-2035 (USD Billion)
      142. | | 7.29.4 BY FORM, 2025-2035 (USD Billion)
      143. | 7.30 Rest of MEA MARKET SIZE ESTIMATES; FORECAST
      144. | | 7.30.1 BY APPLICATION, 2025-2035 (USD Billion)
      145. | | 7.30.2 BY MANUFACTURING PROCESS, 2025-2035 (USD Billion)
      146. | | 7.30.3 BY END-USE INDUSTRY, 2025-2035 (USD Billion)
      147. | | 7.30.4 BY FORM, 2025-2035 (USD Billion)
      148. | 7.31 PRODUCT LAUNCH/PRODUCT DEVELOPMENT/APPROVAL
      149. | | 7.31.1
      150. | 7.32 ACQUISITION/PARTNERSHIP
      151. | | 7.32.1

    Ammonia Market Segmentation

    Ammonia Market By Application (USD Billion, 2019-2035)

    Fertilizers

    Industrial Chemicals

    Refrigeration


    Ammonia Market By Manufacturing Process (USD Billion, 2019-2035)

    Haber-Bosch Process

    Electrochemical Process

    Others


    Ammonia Market By End Use Industry (USD Billion, 2019-2035)

    Agriculture

    Chemical

    Pharmaceutical

    Food Beverage


    Ammonia Market By Form (USD Billion, 2019-2035)

    Anhydrous Ammonia

    Aqueous Ammonia

    Ammonium Nitrate


    Ammonia Market By Regional (USD Billion, 2019-2035)

    North America

    Europe

    South America

    Asia Pacific

    Middle East and Africa


    Ammonia Market Regional Outlook (USD Billion, 2019-2035)


    North America Outlook (USD Billion, 2019-2035)

    North America Ammonia Market by Application Type

    Fertilizers

    Industrial Chemicals

    Refrigeration

    North America Ammonia Market by Manufacturing Process Type

    Haber-Bosch Process

    Electrochemical Process

    Others

    North America Ammonia Market by End Use Industry Type

    Agriculture

    Chemical

    Pharmaceutical

    Food Beverage

    North America Ammonia Market by Form Type

    Anhydrous Ammonia

    Aqueous Ammonia

    Ammonium Nitrate

    North America Ammonia Market by Regional Type

    US

    Canada

    US Outlook (USD Billion, 2019-2035)

    US Ammonia Market by Application Type

    Fertilizers

    Industrial Chemicals

    Refrigeration

    US Ammonia Market by Manufacturing Process Type

    Haber-Bosch Process

    Electrochemical Process

    Others

    US Ammonia Market by End Use Industry Type

    Agriculture

    Chemical

    Pharmaceutical

    Food Beverage

    US Ammonia Market by Form Type

    Anhydrous Ammonia

    Aqueous Ammonia

    Ammonium Nitrate

    CANADA Outlook (USD Billion, 2019-2035)

    CANADA Ammonia Market by Application Type

    Fertilizers

    Industrial Chemicals

    Refrigeration

    CANADA Ammonia Market by Manufacturing Process Type

    Haber-Bosch Process

    Electrochemical Process

    Others

    CANADA Ammonia Market by End Use Industry Type

    Agriculture

    Chemical

    Pharmaceutical

    Food Beverage

    CANADA Ammonia Market by Form Type

    Anhydrous Ammonia

    Aqueous Ammonia

    Ammonium Nitrate

    Europe Outlook (USD Billion, 2019-2035)

    Europe Ammonia Market by Application Type

    Fertilizers

    Industrial Chemicals

    Refrigeration

    Europe Ammonia Market by Manufacturing Process Type

    Haber-Bosch Process

    Electrochemical Process

    Others

    Europe Ammonia Market by End Use Industry Type

    Agriculture

    Chemical

    Pharmaceutical

    Food Beverage

    Europe Ammonia Market by Form Type

    Anhydrous Ammonia

    Aqueous Ammonia

    Ammonium Nitrate

    Europe Ammonia Market by Regional Type

    Germany

    UK

    France

    Russia

    Italy

    Spain

    Rest of Europe

    GERMANY Outlook (USD Billion, 2019-2035)

    GERMANY Ammonia Market by Application Type

    Fertilizers

    Industrial Chemicals

    Refrigeration

    GERMANY Ammonia Market by Manufacturing Process Type

    Haber-Bosch Process

    Electrochemical Process

    Others

    GERMANY Ammonia Market by End Use Industry Type

    Agriculture

    Chemical

    Pharmaceutical

    Food Beverage

    GERMANY Ammonia Market by Form Type

    Anhydrous Ammonia

    Aqueous Ammonia

    Ammonium Nitrate

    UK Outlook (USD Billion, 2019-2035)

    UK Ammonia Market by Application Type

    Fertilizers

    Industrial Chemicals

    Refrigeration

    UK Ammonia Market by Manufacturing Process Type

    Haber-Bosch Process

    Electrochemical Process

    Others

    UK Ammonia Market by End Use Industry Type

    Agriculture

    Chemical

    Pharmaceutical

    Food Beverage

    UK Ammonia Market by Form Type

    Anhydrous Ammonia

    Aqueous Ammonia

    Ammonium Nitrate

    FRANCE Outlook (USD Billion, 2019-2035)

    FRANCE Ammonia Market by Application Type

    Fertilizers

    Industrial Chemicals

    Refrigeration

    FRANCE Ammonia Market by Manufacturing Process Type

    Haber-Bosch Process

    Electrochemical Process

    Others

    FRANCE Ammonia Market by End Use Industry Type

    Agriculture

    Chemical

    Pharmaceutical

    Food Beverage

    FRANCE Ammonia Market by Form Type

    Anhydrous Ammonia

    Aqueous Ammonia

    Ammonium Nitrate

    RUSSIA Outlook (USD Billion, 2019-2035)

    RUSSIA Ammonia Market by Application Type

    Fertilizers

    Industrial Chemicals

    Refrigeration

    RUSSIA Ammonia Market by Manufacturing Process Type

    Haber-Bosch Process

    Electrochemical Process

    Others

    RUSSIA Ammonia Market by End Use Industry Type

    Agriculture

    Chemical

    Pharmaceutical

    Food Beverage

    RUSSIA Ammonia Market by Form Type

    Anhydrous Ammonia

    Aqueous Ammonia

    Ammonium Nitrate

    ITALY Outlook (USD Billion, 2019-2035)

    ITALY Ammonia Market by Application Type

    Fertilizers

    Industrial Chemicals

    Refrigeration

    ITALY Ammonia Market by Manufacturing Process Type

    Haber-Bosch Process

    Electrochemical Process

    Others

    ITALY Ammonia Market by End Use Industry Type

    Agriculture

    Chemical

    Pharmaceutical

    Food Beverage

    ITALY Ammonia Market by Form Type

    Anhydrous Ammonia

    Aqueous Ammonia

    Ammonium Nitrate

    SPAIN Outlook (USD Billion, 2019-2035)

    SPAIN Ammonia Market by Application Type

    Fertilizers

    Industrial Chemicals

    Refrigeration

    SPAIN Ammonia Market by Manufacturing Process Type

    Haber-Bosch Process

    Electrochemical Process

    Others

    SPAIN Ammonia Market by End Use Industry Type

    Agriculture

    Chemical

    Pharmaceutical

    Food Beverage

    SPAIN Ammonia Market by Form Type

    Anhydrous Ammonia

    Aqueous Ammonia

    Ammonium Nitrate

    REST OF EUROPE Outlook (USD Billion, 2019-2035)

    REST OF EUROPE Ammonia Market by Application Type

    Fertilizers

    Industrial Chemicals

    Refrigeration

    REST OF EUROPE Ammonia Market by Manufacturing Process Type

    Haber-Bosch Process

    Electrochemical Process

    Others

    REST OF EUROPE Ammonia Market by End Use Industry Type

    Agriculture

    Chemical

    Pharmaceutical

    Food Beverage

    REST OF EUROPE Ammonia Market by Form Type

    Anhydrous Ammonia

    Aqueous Ammonia

    Ammonium Nitrate

    APAC Outlook (USD Billion, 2019-2035)

    APAC Ammonia Market by Application Type

    Fertilizers

    Industrial Chemicals

    Refrigeration

    APAC Ammonia Market by Manufacturing Process Type

    Haber-Bosch Process

    Electrochemical Process

    Others

    APAC Ammonia Market by End Use Industry Type

    Agriculture

    Chemical

    Pharmaceutical

    Food Beverage

    APAC Ammonia Market by Form Type

    Anhydrous Ammonia

    Aqueous Ammonia

    Ammonium Nitrate

    APAC Ammonia Market by Regional Type

    China

    India

    Japan

    South Korea

    Malaysia

    Thailand

    Indonesia

    Rest of APAC

    CHINA Outlook (USD Billion, 2019-2035)

    CHINA Ammonia Market by Application Type

    Fertilizers

    Industrial Chemicals

    Refrigeration

    CHINA Ammonia Market by Manufacturing Process Type

    Haber-Bosch Process

    Electrochemical Process

    Others

    CHINA Ammonia Market by End Use Industry Type

    Agriculture

    Chemical

    Pharmaceutical

    Food Beverage

    CHINA Ammonia Market by Form Type

    Anhydrous Ammonia

    Aqueous Ammonia

    Ammonium Nitrate

    INDIA Outlook (USD Billion, 2019-2035)

    INDIA Ammonia Market by Application Type

    Fertilizers

    Industrial Chemicals

    Refrigeration

    INDIA Ammonia Market by Manufacturing Process Type

    Haber-Bosch Process

    Electrochemical Process

    Others

    INDIA Ammonia Market by End Use Industry Type

    Agriculture

    Chemical

    Pharmaceutical

    Food Beverage

    INDIA Ammonia Market by Form Type

    Anhydrous Ammonia

    Aqueous Ammonia

    Ammonium Nitrate

    JAPAN Outlook (USD Billion, 2019-2035)

    JAPAN Ammonia Market by Application Type

    Fertilizers

    Industrial Chemicals

    Refrigeration

    JAPAN Ammonia Market by Manufacturing Process Type

    Haber-Bosch Process

    Electrochemical Process

    Others

    JAPAN Ammonia Market by End Use Industry Type

    Agriculture

    Chemical

    Pharmaceutical

    Food Beverage

    JAPAN Ammonia Market by Form Type

    Anhydrous Ammonia

    Aqueous Ammonia

    Ammonium Nitrate

    SOUTH KOREA Outlook (USD Billion, 2019-2035)

    SOUTH KOREA Ammonia Market by Application Type

    Fertilizers

    Industrial Chemicals

    Refrigeration

    SOUTH KOREA Ammonia Market by Manufacturing Process Type

    Haber-Bosch Process

    Electrochemical Process

    Others

    SOUTH KOREA Ammonia Market by End Use Industry Type

    Agriculture

    Chemical

    Pharmaceutical

    Food Beverage

    SOUTH KOREA Ammonia Market by Form Type

    Anhydrous Ammonia

    Aqueous Ammonia

    Ammonium Nitrate

    MALAYSIA Outlook (USD Billion, 2019-2035)

    MALAYSIA Ammonia Market by Application Type

    Fertilizers

    Industrial Chemicals

    Refrigeration

    MALAYSIA Ammonia Market by Manufacturing Process Type

    Haber-Bosch Process

    Electrochemical Process

    Others

    MALAYSIA Ammonia Market by End Use Industry Type

    Agriculture

    Chemical

    Pharmaceutical

    Food Beverage

    MALAYSIA Ammonia Market by Form Type

    Anhydrous Ammonia

    Aqueous Ammonia

    Ammonium Nitrate

    THAILAND Outlook (USD Billion, 2019-2035)

    THAILAND Ammonia Market by Application Type

    Fertilizers

    Industrial Chemicals

    Refrigeration

    THAILAND Ammonia Market by Manufacturing Process Type

    Haber-Bosch Process

    Electrochemical Process

    Others

    THAILAND Ammonia Market by End Use Industry Type

    Agriculture

    Chemical

    Pharmaceutical

    Food Beverage

    THAILAND Ammonia Market by Form Type

    Anhydrous Ammonia

    Aqueous Ammonia

    Ammonium Nitrate

    INDONESIA Outlook (USD Billion, 2019-2035)

    INDONESIA Ammonia Market by Application Type

    Fertilizers

    Industrial Chemicals

    Refrigeration

    INDONESIA Ammonia Market by Manufacturing Process Type

    Haber-Bosch Process

    Electrochemical Process

    Others

    INDONESIA Ammonia Market by End Use Industry Type

    Agriculture

    Chemical

    Pharmaceutical

    Food Beverage

    INDONESIA Ammonia Market by Form Type

    Anhydrous Ammonia

    Aqueous Ammonia

    Ammonium Nitrate

    REST OF APAC Outlook (USD Billion, 2019-2035)

    REST OF APAC Ammonia Market by Application Type

    Fertilizers

    Industrial Chemicals

    Refrigeration

    REST OF APAC Ammonia Market by Manufacturing Process Type

    Haber-Bosch Process

    Electrochemical Process

    Others

    REST OF APAC Ammonia Market by End Use Industry Type

    Agriculture

    Chemical

    Pharmaceutical

    Food Beverage

    REST OF APAC Ammonia Market by Form Type

    Anhydrous Ammonia

    Aqueous Ammonia

    Ammonium Nitrate

    South America Outlook (USD Billion, 2019-2035)

    South America Ammonia Market by Application Type

    Fertilizers

    Industrial Chemicals

    Refrigeration

    South America Ammonia Market by Manufacturing Process Type

    Haber-Bosch Process

    Electrochemical Process

    Others

    South America Ammonia Market by End Use Industry Type

    Agriculture

    Chemical

    Pharmaceutical

    Food Beverage

    South America Ammonia Market by Form Type

    Anhydrous Ammonia

    Aqueous Ammonia

    Ammonium Nitrate

    South America Ammonia Market by Regional Type

    Brazil

    Mexico

    Argentina

    Rest of South America

    BRAZIL Outlook (USD Billion, 2019-2035)

    BRAZIL Ammonia Market by Application Type

    Fertilizers

    Industrial Chemicals

    Refrigeration

    BRAZIL Ammonia Market by Manufacturing Process Type

    Haber-Bosch Process

    Electrochemical Process

    Others

    BRAZIL Ammonia Market by End Use Industry Type

    Agriculture

    Chemical

    Pharmaceutical

    Food Beverage

    BRAZIL Ammonia Market by Form Type

    Anhydrous Ammonia

    Aqueous Ammonia

    Ammonium Nitrate

    MEXICO Outlook (USD Billion, 2019-2035)

    MEXICO Ammonia Market by Application Type

    Fertilizers

    Industrial Chemicals

    Refrigeration

    MEXICO Ammonia Market by Manufacturing Process Type

    Haber-Bosch Process

    Electrochemical Process

    Others

    MEXICO Ammonia Market by End Use Industry Type

    Agriculture

    Chemical

    Pharmaceutical

    Food Beverage

    MEXICO Ammonia Market by Form Type

    Anhydrous Ammonia

    Aqueous Ammonia

    Ammonium Nitrate

    ARGENTINA Outlook (USD Billion, 2019-2035)

    ARGENTINA Ammonia Market by Application Type

    Fertilizers

    Industrial Chemicals

    Refrigeration

    ARGENTINA Ammonia Market by Manufacturing Process Type

    Haber-Bosch Process

    Electrochemical Process

    Others

    ARGENTINA Ammonia Market by End Use Industry Type

    Agriculture

    Chemical

    Pharmaceutical

    Food Beverage

    ARGENTINA Ammonia Market by Form Type

    Anhydrous Ammonia

    Aqueous Ammonia

    Ammonium Nitrate

    REST OF SOUTH AMERICA Outlook (USD Billion, 2019-2035)

    REST OF SOUTH AMERICA Ammonia Market by Application Type

    Fertilizers

    Industrial Chemicals

    Refrigeration

    REST OF SOUTH AMERICA Ammonia Market by Manufacturing Process Type

    Haber-Bosch Process

    Electrochemical Process

    Others

    REST OF SOUTH AMERICA Ammonia Market by End Use Industry Type

    Agriculture

    Chemical

    Pharmaceutical

    Food Beverage

    REST OF SOUTH AMERICA Ammonia Market by Form Type

    Anhydrous Ammonia

    Aqueous Ammonia

    Ammonium Nitrate

    MEA Outlook (USD Billion, 2019-2035)

    MEA Ammonia Market by Application Type

    Fertilizers

    Industrial Chemicals

    Refrigeration

    MEA Ammonia Market by Manufacturing Process Type

    Haber-Bosch Process

    Electrochemical Process

    Others

    MEA Ammonia Market by End Use Industry Type

    Agriculture

    Chemical

    Pharmaceutical

    Food Beverage

    MEA Ammonia Market by Form Type

    Anhydrous Ammonia

    Aqueous Ammonia

    Ammonium Nitrate

    MEA Ammonia Market by Regional Type

    GCC Countries

    South Africa

    Rest of MEA

    GCC COUNTRIES Outlook (USD Billion, 2019-2035)

    GCC COUNTRIES Ammonia Market by Application Type

    Fertilizers

    Industrial Chemicals

    Refrigeration

    GCC COUNTRIES Ammonia Market by Manufacturing Process Type

    Haber-Bosch Process

    Electrochemical Process

    Others

    GCC COUNTRIES Ammonia Market by End Use Industry Type

    Agriculture

    Chemical

    Pharmaceutical

    Food Beverage

    GCC COUNTRIES Ammonia Market by Form Type

    Anhydrous Ammonia

    Aqueous Ammonia

    Ammonium Nitrate

    SOUTH AFRICA Outlook (USD Billion, 2019-2035)

    SOUTH AFRICA Ammonia Market by Application Type

    Fertilizers

    Industrial Chemicals

    Refrigeration

    SOUTH AFRICA Ammonia Market by Manufacturing Process Type

    Haber-Bosch Process

    Electrochemical Process

    Others

    SOUTH AFRICA Ammonia Market by End Use Industry Type

    Agriculture

    Chemical

    Pharmaceutical

    Food Beverage

    SOUTH AFRICA Ammonia Market by Form Type

    Anhydrous Ammonia

    Aqueous Ammonia

    Ammonium Nitrate

    REST OF MEA Outlook (USD Billion, 2019-2035)

    REST OF MEA Ammonia Market by Application Type

    Fertilizers

    Industrial Chemicals

    Refrigeration

    REST OF MEA Ammonia Market by Manufacturing Process Type

    Haber-Bosch Process

    Electrochemical Process

    Others

    REST OF MEA Ammonia Market by End Use Industry Type

    Agriculture

    Chemical

    Pharmaceutical

    Food Beverage

    REST OF MEA Ammonia Market by Form Type

    Anhydrous Ammonia

    Aqueous Ammonia

    Ammonium Nitrate


    Infographic

    Free Sample Request

    Kindly complete the form below to receive a free sample of this Report

    Get Free Sample

    Customer Strories

    “I am very pleased with how market segments have been defined in a relevant way for my purposes (such as "Portable Freezers & refrigerators" and "last-mile"). In general the report is well structured. Thanks very much for your efforts.”

    Victoria Milne

    Founder
    Case Study
    Chemicals and Materials

    Compare Licence

    ×
    Features License Type
    Single User Multiuser License Enterprise User
    Price $4,950 $ $7,250
    Maximum User Access Limit 1 User Upto 10 Users Unrestricted Access Throughout the Organization
    Free Customization
    Direct Access to Analyst
    Deliverable Format
    Platform Access
    Discount on Next Purchase 10% 15% 15%
    Printable Versions