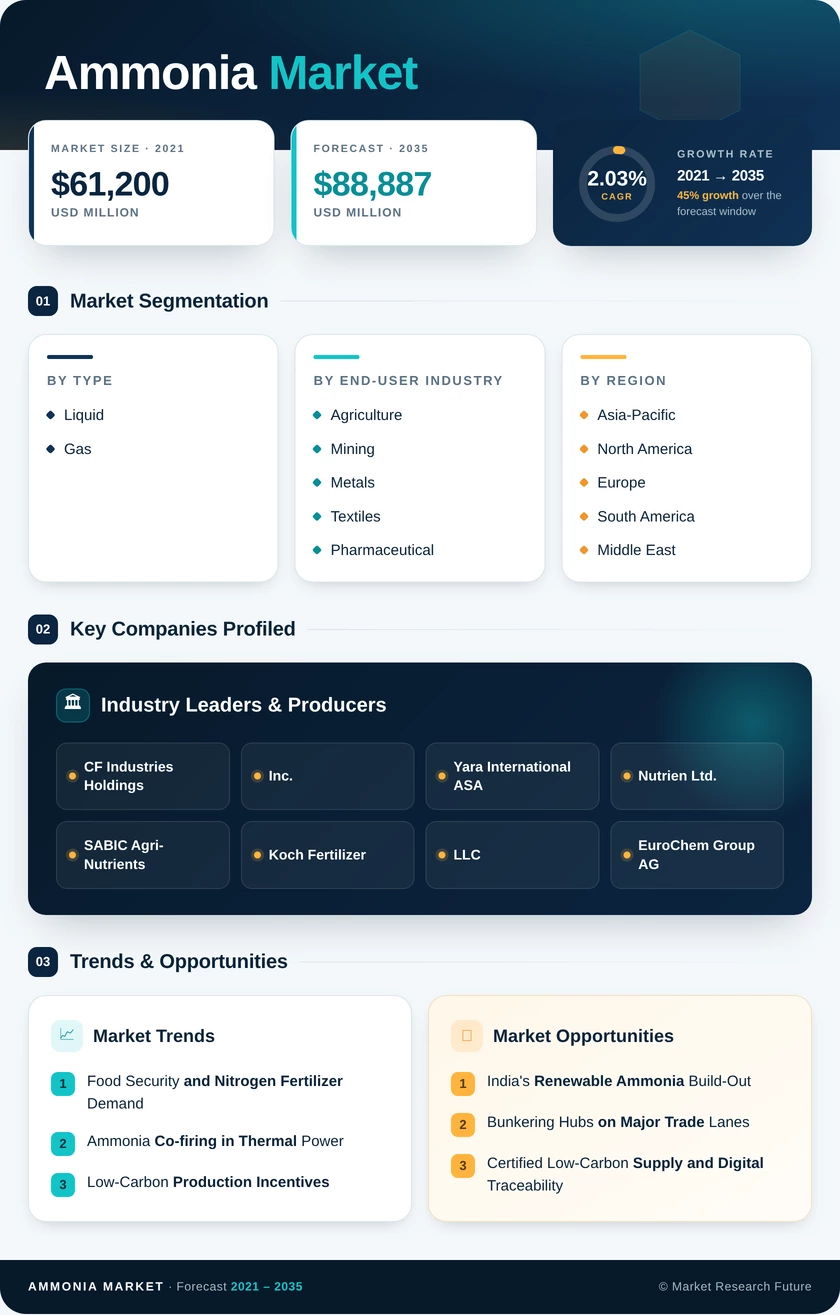
Ammonia Market (2026 - 2035)

ID: MRFR/CnM/1775-CR 200 Pages Chitranshi Jaiswal Last Updated: October 22, 2026
Ammonia Market Research Report Information By Type (Liquid and Gas), By End-User Industry (Agriculture, Mining and Metals, Textiles, Pharmaceutical, Industrial Refrigeration, Power Generation, and Other End-User Industries (Water Treatment, Rubber, Petroleum, Pulp and Paper)), And By Region (North America, Europe, Asia-Pacific, and Rest of the World) – Market Forecast Till 2035.
Ammonia Market
Market Size
Forecast Period2026-2035
CAGR (2026-2035)2.03%
2025 Market SizeUSD 72,850 Million
2035 Market SizeUSD 88,887 Million
Key Players
CF Industries Holdings, Inc.
Yara International ASA
Nutrien Ltd.
SABIC Agri-Nutrients
Koch Fertilizer, LLC
EuroChem Group AG
Opportunities
  • India's Renewable Ammonia Build-Out
  • Bunkering Hubs on Major Trade Lanes
  • Certified Low-Carbon Supply and Digital Traceability
  1. 1 Market Summary | |
  2. 2 Key Report Takeaways | |
    1. 2.1 By Type | |
    2. 2.2 By End-user Industry | |
    3. 2.3 By Region | |
  3. 3 Market Size and Forecast (2021–2035) | |
    1. 3.1 Historical Market Size (2021–2025) | |
    2. 3.2 Forecast Market Size (2026–2035) | |
    3. 3.3 Year-over-Year Growth Analysis | |
  4. 4 Driver Impact Analysis | |
    1. 4.1 Food Security and Nitrogen Fertilizer Demand | |
    2. 4.2 Ammonia Co-firing in Thermal Power | |
    3. 4.3 Low-Carbon Production Incentives | |
    4. 4.4 Shipping Decarbonization Rules | |
    5. 4.5 HFC Phasedown Favouring Natural Refrigerants | |
    6. 4.6 Mining Explosives and Metals Processing | |
  5. 5 Restraints Impact Analysis | |
    1. 5.1 Natural Gas Price Volatility | |
    2. 5.2 Carbon Border Costs and Emission Compliance | |
    3. 5.3 Nitrogen-Use-Efficiency Policies | |
    4. 5.4 High Capital Cost and Offtake Risk for Low-Carbon Plants | |
    5. 5.5 Toxicity and Process Safety Regulation | |
  6. 6 Opportunities | |
    1. 6.1 India's Renewable Ammonia Build-Out | |
    2. 6.2 Bunkering Hubs on Major Trade Lanes | |
    3. 6.3 Certified Low-Carbon Supply and Digital Traceability | |
    4. 6.4 Ammonia as a Hydrogen Carrier for Import Markets | |
    5. 6.5 Closing Sub-Saharan Africa's Fertilizer Gap | |
  7. 7 Regional Market Share and Country-Level Analysis | |
    1. 7.1 Asia-Pacific | | |
      1. 7.1.1 China | | |
      2. 7.1.2 India | | |
      3. 7.1.3 Japan | | |
      4. 7.1.4 South Korea | | |
      5. 7.1.5 ASEAN Countries | | |
      6. 7.1.6 Rest of Asia-Pacific | |
    2. 7.2 North America | | |
      1. 7.2.1 United States | | |
      2. 7.2.2 Canada | | |
      3. 7.2.3 Mexico | |
    3. 7.3 Europe | | |
      1. 7.3.1 Germany | | |
      2. 7.3.2 United Kingdom | | |
      3. 7.3.3 France | | |
      4. 7.3.4 Italy | | |
      5. 7.3.5 NORDIC Countries | | |
      6. 7.3.6 Rest of Europe | |
    4. 7.4 South America | | |
      1. 7.4.1 Brazil | | |
      2. 7.4.2 Argentina | | |
      3. 7.4.3 Rest of South America | |
    5. 7.5 Middle East and Africa | | |
      1. 7.5.1 Saudi Arabia | | |
      2. 7.5.2 South Africa | | |
      3. 7.5.3 Rest of Middle East and Africa | |
  8. 8 Future Outlook (2026–2035) | |
    1. 8.1 Energy Demand Reshapes Production Planning | |
    2. 8.2 Electrolysis Scale-Up and Plant Digitalization | |
    3. 8.3 Shipping and Terminal Infrastructure | |
    4. 8.4 Carbon Accounting Becomes a Pricing Variable | |
  9. 9 Segmentation Analysis | |
    1. 9.1 By Type | | |
      1. 9.1.1 Liquid | | |
      2. 9.1.2 Gas | |
    2. 9.2 By End-user Industry | | |
      1. 9.2.1 Agriculture | | |
      2. 9.2.2 Mining and Metals | | |
      3. 9.2.3 Textiles | | |
      4. 9.2.4 Pharmaceutical | | |
      5. 9.2.5 Industrial Refrigeration | | |
      6. 9.2.6 Power Generation | | |
      7. 9.2.7 Other End-user Industries (Water-treatment, Rubber, Petroleum, Pulp and Paper) | |
  10. 10 Competitive Landscape | |
    1. 10.1 Market Concentration Analysis | |
    2. 10.2 Competitive Benchmarking Table | |
    3. 10.3 Company Profiles | | |
      1. 10.3.1 CF Industries Holdings, Inc. | | |
      2. 10.3.2 Yara International ASA | | |
      3. 10.3.3 Nutrien Ltd. | | |
      4. 10.3.4 Qatar Fertiliser Company (QAFCO) | | |
      5. 10.3.5 SABIC Agri-Nutrients | | |
      6. 10.3.6 Koch Fertilizer, LLC | | |
      7. 10.3.7 EuroChem Group AG | | |
      8. 10.3.8 OCI Global | | |
      9. 10.3.9 Ma'aden | | |
      10. 10.3.10 Grupa Azoty | |
  11. 11 Recent News & Developments | |
  12. 12 Report Scope and Methodology | |
  13. 13 Detailed Sources and Citations | |
  14. 14 Frequently Asked Questions (FAQs) | | LIST OF TABLES | |
  15. TABLE 1 Global Ammonia Market Summary Snapshot, 2025–2035 | |
  16. TABLE 2 Global Ammonia Market Size & Forecast, by Value (USD Million), 2021–2035 | |
  17. TABLE 3 Driver Impact Analysis, 2026–2035 | |
  18. TABLE 4 Restraints Impact Analysis, 2026–2035 | |
  19. TABLE 5 Global Ammonia Market, Regional Summary, 2025 | |
  20. TABLE 6 Asia-Pacific Ammonia Market, by Country, 2025 | |
  21. TABLE 7 North America Ammonia Market, by Country, 2025 | |
  22. TABLE 8 Europe Ammonia Market, by Country, 2025 | |
  23. TABLE 9 South America Ammonia Market, by Country, 2025 | |
  24. TABLE 10 Middle East and Africa Ammonia Market, by Country, 2025 | |
  25. TABLE 11 Global Ammonia Market, by Type, 2025 | |
  26. TABLE 12 Global Ammonia Market, by End-user Industry, 2025 | |
  27. TABLE 13 Competitive Benchmarking Table, 2025 | |
  28. TABLE 14 Report Scope and Methodology | |
  29. TABLE 15 Detailed Sources and Citations | | LIST OF FIGURES | |
  30. FIGURE 1 Global Ammonia Market Dynamics Overview | |
  31. FIGURE 2 Ammonia Industry Value Chain Analysis | |
  32. FIGURE 3 Porter's Five Forces Analysis | |
  33. FIGURE 4 Global Ammonia Market Size Trend, 2021–2035 (USD Million) | |
  34. FIGURE 5 Global Ammonia Market Share, by Type, 2025 | |
  35. FIGURE 6 Global Ammonia Market Share, by End-user Industry, 2025 | |
  36. FIGURE 7 Global Ammonia Market Share, by Region, 2025 | |
  37. FIGURE 8 Asia-Pacific Ammonia Market Share, by Country, 2025 | |
  38. FIGURE 9 North America Ammonia Market Share, by Country, 2025 | |
  39. FIGURE 10 Europe Ammonia Market Share, by Country, 2025 | |
  40. FIGURE 11 South America Ammonia Market Share, by Country, 2025 | |
  41. FIGURE 12 Middle East and Africa Ammonia Market Share, by Country, 2025 | |
  42. FIGURE 13 Competitive Landscape: Estimated Revenue Share Ranges of Key Players, 2025

Segmentation Quick Reference

DimensionSub-SegmentsDominant SegmentFastest Growing Segment
By TypeLiquid; GasLiquid (85.6% share)Gas (4.45% CAGR)
By End-user IndustryAgriculture; Mining and Metals; Textiles; Pharmaceutical; Industrial Refrigeration; Power Generation; Other End-user Industries (Water-treatment, Rubber, Petroleum, Pulp and Paper)Agriculture (73.4% share)Power Generation (6.28% CAGR)
By RegionAsia-Pacific; North America; Europe; South America; Middle East and AfricaAsia-Pacific (54.2% share)Asia-Pacific (54.2% share; highest regional CAGR)

Market Segmentation Overview

By Type

Sub-SegmentKey Trend
LiquidRefrigerated and pressurized liquid remains the standard for ocean trade and fertilizer plant supply
GasOn-site gaseous supply expands in refrigeration retrofits and integrated fibre and resin plants

Liquid leads with an 85.6% share because tankers, terminals and pipelines are built around liquefied ammonia, and switching that infrastructure would strand large sunk investments. Gas grows fastest at a 4.45% CAGR, driven by refrigeration operators replacing HFC systems and by Chinese nylon and acrylic producers drawing gaseous ammonia directly from neighbouring gasification units. The gap will narrow slowly, since gas expansion is tied to point-of-use installations rather than traded volumes.

By End-user Industry

Sub-SegmentKey Trend
AgriculturePrecision application moderates volume growth while controlled-release products gain share
Mining and MetalsAmmonium nitrate emulsions and battery-metal leaching sustain demand
TextilesNylon and acrylic fibre output in Asia supports steady consumption
PharmaceuticalSpecialty synthesis and high-purity grades lift demand
Industrial RefrigerationHFC phasedown drives adoption of low-charge ammonia systems
Power GenerationCoal co-firing in Japan and South Korea creates contracted offtake
Other End-user Industries (Water-treatment, Rubber, Petroleum, Pulp and Paper)Diverse process uses provide a stable, cycle-resistant base

Agriculture dominates with a 73.4% share, as urea, ammonium nitrate and compound fertilizers remain the main route for nitrogen delivery to crops. Power Generation grows fastest at a 6.28% CAGR because utilities in Japan and South Korea are signing long-term contracts for co-firing that price ammonia against coal rather than fertilizer. Industrial Refrigeration and Mining and Metals add diversification, giving producers outlets that are less exposed to planting seasons and crop prices.


Download PDF ×

We do not share your information with anyone. However, we may send you emails based on your report interest from time to time. You may contact us at any time to opt-out.