Aloe Vera Products Market Segmentation
Aloe Vera Products Market By Type (USD Billion, 2025-2035)
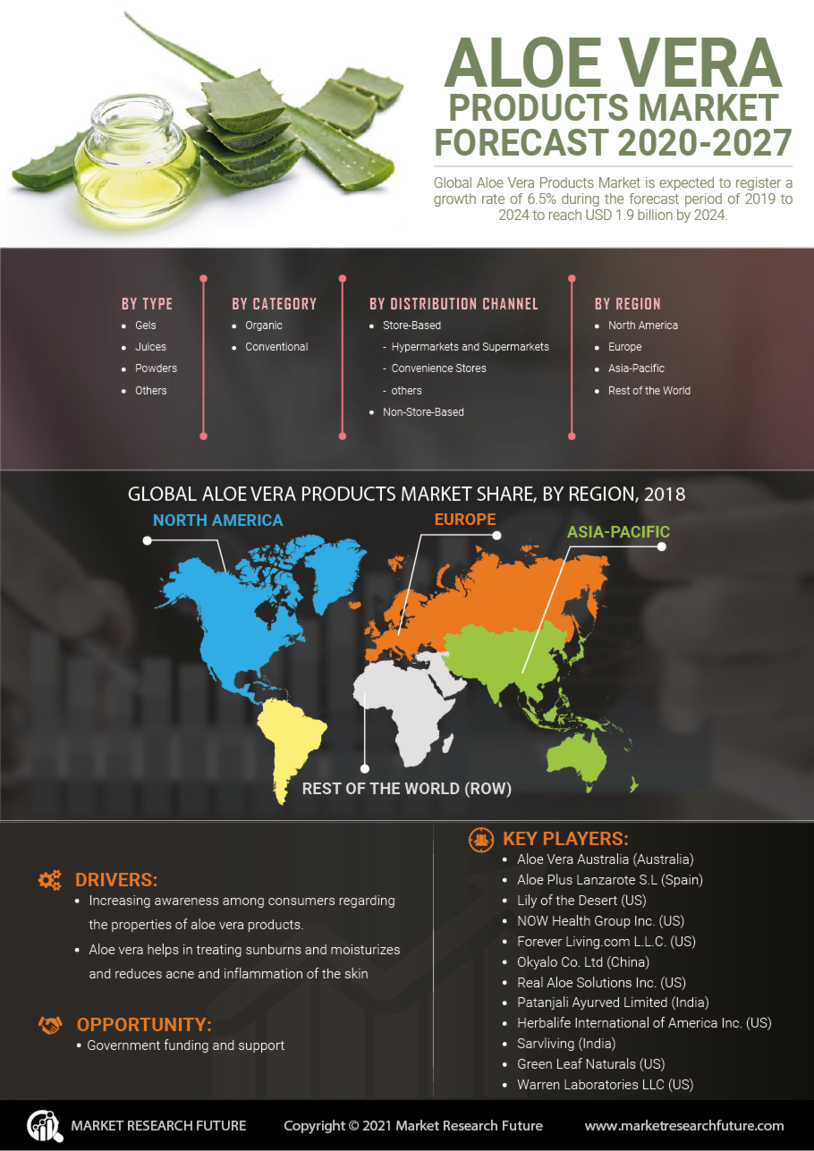
- Gels
- Juices
- Powders
- Others
Aloe Vera Products Market By Category (USD Billion, 2025-2035)
- Organic
- Conventional
Aloe Vera Products Market By Distribution Channel (USD Billion, 2025-2035)
- Store-Based
- Non-Store-Based