ID: MRFR/F-B & N/6459-HCR | February 2021 | Region: Global | 90 pages
Market Scenario
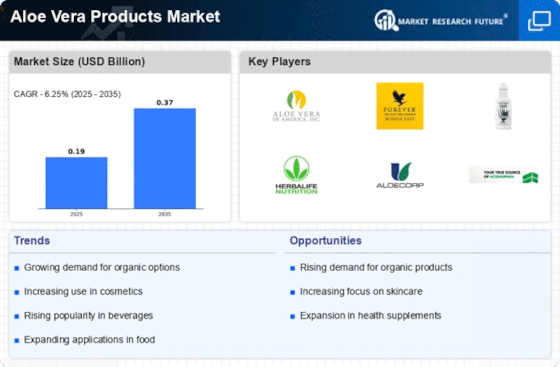
Global Aloe Vera Products Market is expected to register a growth rate of 6.5% during the forecast period of 2019 to 2024 to reach USD 1.9 billion by 2024. The main feature of the aloe vera plant is its high water content, ranging from 99% to 99.5%, while the remaining 0.5% to1.0% of solid material contains over 200 different potentially active compounds, including vitamins, minerals, enzymes, simple and complex polysaccharides, phenolic compounds, and organic acids. Thus, aloe vera is used extensively in the form of creams for treating bites, stings, cuts, and abrasions as well as various kinds of strains and sprains affecting muscles and joints. Owing to the potential growth of the aloe vera industry, the global aloe vera products market is expected to witness significant growth during the review period.
Segmentation
The global aloe vera products market has been segmented based on type, category, distribution channel, and region.
By type, the global market has been classified as gels, juices, powders, and others. The juices segment is expected to account for the largest share and is also projected to be the fastest-growing segment during the review period due to the high consumption of aloe vera juices.
Based on category, the global aloe vera products market has been bifurcated into organic and conventional. The conventional segment holds the larger market share and the organic segment is expected to register the higher CAGR during the review period.
The global market has been divided, on the basis of distribution channel, into store-based and non-store-based. The store-based segment has further been classified as hypermarkets and supermarkets, convenience stores, and others. The store-based segment is expected to hold the larger share of the global market from 2019 to 2024. However, the non-store-based segment is expected to register the higher growth rate during the forecast period.
The global aloe vera products market has been studied with regard to four key regions—North America, Europe, Asia-Pacific, and the rest of the world.
The North American aloe vera products industry has further been segmented into the US, Canada, and Mexico.
The European aloe vera products industry has been classified as the UK, Germany, France, Italy, Spain, and the rest of Europe.
The aloe vera products market in Asia-Pacific has been divided into China, India, Japan, Australia and New Zealand, and the rest of Asia-Pacific.
The aloe vera products industry in the rest of the world has been segmented into South America, the Middle East, and Africa.
Key Players
Aloe Vera Australia (Australia), Aloe Plus Lanzarote S.L (Spain), Lily of the Desert (US), NOW Health Group, Inc. (US), Forever Living.com, L.L.C. (US), Okyalo Co., Ltd (China), Real Aloe Solutions Inc. (US), Patanjali Ayurved Limited (India), Herbalife International of America, Inc. (US), Sarvliving (India), Green Leaf Naturals (US), Warren Laboratories LLC (US), Lakewood Juice Company (US), Biofinest (US), The Nature's Bounty Co (US), and LR Health & Beauty Systems GmbH (Germany) are some of the key players in the global aloe vera products market.
Regional Market Summary:
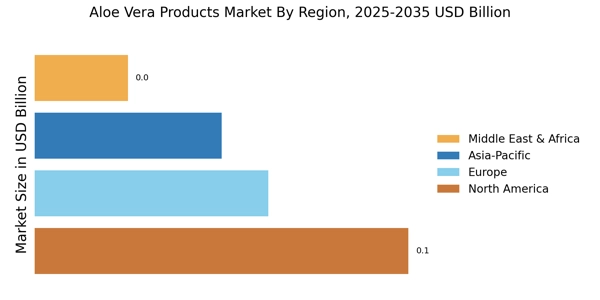
Global Aloe Vera Products Market Share (%), by Region, 2018
Source: Secondary Sources and MRFR Analysis
The market in Asia-Pacific is projected to account for the lion’s share of the global aloe vera products market and exhibit an impressive CAGR during the forecast period. India and China are among the major markets contributing to the regional market growth. Moreover, increasing awareness among consumers regarding the properties of aloe vera products such as antimicrobial, antioxidant, aphrodisiac, anti-inflammatory, anti-helminthic, antifungal, and antiseptic is expected to drive the growth of the aloe vera industry.
Global Aloe Vera Products Market, by Type
Gels
Juices
Powders
Others
Global Aloe Vera Products Market, by Category
Organic
Conventional
Global Aloe Vera Products Market, by Distribution Channel
Store-Based
Hypermarkets and Supermarkets
Convenience Stores
Others
Non-Store-Based
Global Aloe Vera Products Market, by Region
North America
US
Canada
Mexico
Europe
Germany
France
Italy
Spain
UK
Rest of Europe
Asia-Pacific
Japan
China
India
Australia and New Zealand
Rest of Asia-Pacific
Rest of the World (RoW)
South America
Middle East
Africa
Intended Audience
Aloe vera products manufacturers
Aloe vera products exporters and importers
Raw material suppliers
Agriculture associations
Frequently Asked Questions (FAQ) :
aloe vera products market is projected to grow at a 6.5% CAGR between 2019-2024.
The APAC region is expected to dominate the aloe vera products market.
The aloe vera products market is predicted to touch USD 1.9 billion by 2024.
Juice segment will lead the aloe vera products market.
Conventional segment will dominate the aloe vera products market.
Table of Contents
1 Executive Summary
2 Scope of the Report
2.1 Market Definition
2.2 Scope of the Study
2.2.1 Research Objectives
2.2.2 Assumptions & Limitations
2.3 Market Structure
3 Market Research Methodology
3.1 Research Process
3.2 Secondary Research
3.3 Primary Research
3.4 Forecast Model
4 Market Landscape
4.1 Supply Chain Analysis
4.1.1 Category Suppliers
4.1.2 Manufacturers/Producers
4.1.3 Distributors/Retailers/Wholesalers/E-Commerce
4.1.4 End Users
4.2 Porter’s Five Forces Analysis
4.2.1 Threat of New Entrants
4.2.2 Bargaining Power of Buyers
4.2.3 Bargaining Power of Suppliers
4.2.4 Threat of Substitutes
4.2.5 Internal Rivalry
5 Market Dynamics of the Global Aloe Vera Products Market
5.1 Introduction
5.2 Drivers
5.3 Restraints
5.4 Opportunities
5.5 Challenges
6. Global Aloe Vera Products Market, by Type
6.1 Introduction
6.2 Juices
6.2.1 Market Estimates & Forecast, 2018–2023
6.2.2 Market Estimates & Forecast, by Region, 2018–2023
6.3 Gels
6.3.1 Market Estimates & Forecast, 2018–2023
6.3.2 Market Estimates & Forecast, by Region, 2018–2023
6.3 Powders
6.3.1 Market Estimates & Forecast, 2018–2023
6.3.2 Market Estimates & Forecast, by Region, 2018–2023
6.3 Others
6.3.1 Market Estimates & Forecast, 2018–2023
6.3.2 Market Estimates & Forecast, by Region, 2018–2023
7. Global Aloe Vera Products Market, by Category
7.1 Introduction
7.2 Organic
7.2.1 Market Estimates & Forecast, 2018–2023
7.2.2 Market Estimates & Forecast, by Region, 2018–2023
7.3 Conventional
7.3.1 Market Estimates & Forecast, 2018–2023
7.3.2 Market Estimates & Forecast, by Region, 2018–2023
8. Global Aloe Vera Products Market, by Distribution Channel
8.1 Introduction
8.2 Store-Based
8.2.1 Hypermarkets & Supermarkets
8.2.1.1 Market Estimates & Forecast, 2018–2023
8.2.1.2 Market Estimates & Forecast, by Region, 2018–2023
8.2.2 Convenience Stores
8.2.2.1 Market Estimates & Forecast, 2018–2023
8.2.2.2 Market Estimates & Forecast, by Region, 2018–2023
8.2.3 Others
8.2.3.1 Market Estimates & Forecast, 2018–2023
8.2.3.2 Market Estimates & Forecast, by Region, 2018–2023
8.3 Non-Store-Based
8.3.1 Market Estimates & Forecast, 2018–2023
8.3.2 Market Estimates & Forecast, by Region, 2018–2023
9. Global Aloe Vera Products Market, by Region
9.1 Introduction
9.2 North America
9.2.1 Market Estimates & Forecast, 2018–2023
9.2.2 Market Estimates & Forecast, by Type, 2018–2023
9.2.3 Market Estimates & Forecast, by Category, 2018–2023
9.2.4 Market Estimates & Forecast, by Distribution Channel, 2018–2023
9.2.5 US
9.2.5.1 Market Estimates & Forecast, 2018–2023
9.2.5.2 Market Estimates & Forecast, by Type, 2018–2023
9.2.5.3 Market Estimates & Forecast, by Category, 2018–2023
9.2.5.4 Market Estimates & Forecast, by Distribution Channel, 2018–2023
9.2.6 Canada
9.2.6.1 Market Estimates & Forecast, 2018–2023
9.2.6.2 Market Estimates & Forecast, by Type, 2018–2023
9.2.6.3 Market Estimates & Forecast, by Category, 2018–2023
9.2.6.4 Market Estimates & Forecast, by Distribution Channel, 2018–2023
9.2.7 Mexico
9.2.7.1 Market Estimates & Forecast, 2018–2023
9.2.7.2 Market Estimates & Forecast, by Type, 2018–2023
9.2.7.3 Market Estimates & Forecast, by Category, 2018–2023
9.2.7.4 Market Estimates & Forecast, by Distribution Channel, 2018–2023
9.3 Europe
9.3.1 Market Estimates & Forecast, 2018–2023
9.3.2 Market Estimates & Forecast, by Type, 2018–2023
9.3.3 Market Estimates & Forecast, by Category, 2018–2023
9.3.4 Market Estimates & Forecast, by Distribution Channel, 2018–2023
9.3.5 Germany
9.3.5.1 Market Estimates & Forecast, 2018–2023
9.3.5.2 Market Estimates & Forecast, by Type, 2018–2023
9.3.5.3 Market Estimates & Forecast, by Category, 2018–2023
9.2.5.4 Market Estimates & Forecast, by Distribution Channel, 2018–2023
9.3.6 France
9.3.6.1 Market Estimates & Forecast, 2018–2023
9.3.6.2 Market Estimates & Forecast, by Type, 2018–2023
9.3.6.3 Market Estimates & Forecast, by Category, 2018–2023
9.3.6.4 Market Estimates & Forecast, by Distribution Channel, 2018–2023
9.3.7 Italy
9.3.7.1 Market Estimates & Forecast, 2018–2023
9.3.7.2 Market Estimates & Forecast, by Type, 2018–2023
9.3.7.3 Market Estimates & Forecast, by Category, 2018–2023
9.3.7.4 Market Estimates & Forecast, by Distribution Channel, 2018–2023
9.3.8 Spain
9.3.8.1 Market Estimates & Forecast, 2018–2023
9.3.8.2 Market Estimates & Forecast, by Type, 2018–2023
9.3.8.3 Market Estimates & Forecast, by Category, 2018–2023
9.3.8.4 Market Estimates & Forecast, by Distribution Channel, 2018–2023
9.3.9 UK
9.3.9.1 Market Estimates & Forecast, 2018–2023
9.3.9.2 Market Estimates & Forecast, by Type, 2018–2023
9.3.9.3 Market Estimates & Forecast, by Category, 2018–2023
9.3.9.4 Market Estimates & Forecast, by Distribution Channel, 2018–2023
9.3.10 Rest of Europe
9.3.10.1 Market Estimates & Forecast, 2018–2023
9.3.10.2 Market Estimates & Forecast, by Type, 2018–2023
9.3.10.3 Market Estimates & Forecast, by Category, 2018–2023
9.3.10.4 Market Estimates & Forecast, by Distribution Channel, 2018–2023
9.4 Asia-Pacific
9.4.1 Market Estimates & Forecast, 2018–2023
9.4.2 Market Estimates & Forecast, by Type, 2018–2023
9.4.3 Market Estimates & Forecast, by Category, 2018–2023
9.4.4 Market Estimates & Forecast, by Distribution Channel, 2018–2023
9.4.5 China
9.4.5.1 Market Estimates & Forecast, 2018–2023
9.4.5.2 Market Estimates & Forecast, by Type, 2018–2023
9.4.5.3 Market Estimates & Forecast, by Category, 2018–2023
9.4.5.4 Market Estimates & Forecast, by Distribution Channel, 2018–2023
9.4.6 India
9.4.6.1 Market Estimates & Forecast, 2018–2023
9.4.6.2 Market Estimates & Forecast, by Type, 2018–2023
9.4.6.3 Market Estimates & Forecast, by Category, 2018–2023
9.4.6.4 Market Estimates & Forecast, by Distribution Channel, 2018–2023
9.4.7 Japan
9.4.7.1 Market Estimates & Forecast, 2018–2023
9.4.7.2 Market Estimates & Forecast, by Type, 2018–2023
9.4.7.3 Market Estimates & Forecast, by Category, 2018–2023
9.4.7.4 Market Estimates & Forecast, by Distribution Channel, 2018–2023
9.4.8 Australia & New Zealand
9.4.8.1 Market Estimates & Forecast, 2018–2023
9.4.8.2 Market Estimates & Forecast, by Type, 2018–2023
9.4.8.3 Market Estimates & Forecast, by Category, 2018–2023
9.4.8.4 Market Estimates & Forecast, by Distribution Channel, 2018–2023
9.4.9 Rest of Asia-Pacific
9.4.9.1 Market Estimates & Forecast, 2018–2023
9.4.9.2 Market Estimates & Forecast, by Type, 2018–2023
9.4.9.3 Market Estimates & Forecast, by Category, 2018–2023
9.4.9.4 Market Estimates & Forecast, by Distribution Channel, 2018–2023
9.5 Rest of the World (RoW)
9.5.1 Market Estimates & Forecast, 2018–2023
9.5.2 Market Estimates & Forecast, by Type, 2018–2023
9.5.3 Market Estimates & Forecast, by Category, 2018–2023
9.5.4 Market Estimates & Forecast, by Distribution Channel, 2018–2023
9.5.5 South America
9.5.5.1 Market Estimates & Forecast, 2018–2023
9.5.5.2 Market Estimates & Forecast, by Type, 2018–2023
9.5.5.3 Market Estimates & Forecast, by Category, 2018–2023
9.5.5.4 Market Estimates & Forecast, by Distribution Channel, 2018–2023
9.5.6 Middle East
9.5.6.1 Market Estimates & Forecast, 2018–2023
9.5.6.2 Market Estimates & Forecast, by Type, 2018–2023
9.5.6.3 Market Estimates & Forecast, by Category, 2018–2023
9.5.6.4 Market Estimates & Forecast, by Distribution Channel, 2018–2023
9.5.7 Africa
9.5.7.1 Market Estimates & Forecast, 2018–2023
9.5.7.2 Market Estimates & Forecast, by Type, 2018–2023
9.5.7.3 Market Estimates & Forecast, by Category, 2018–2023
9.5.7.4 Market Estimates & Forecast, by Distribution Channel, 2018–2023
10. Company Landscape
10.1 Introduction
10.2 Market Strategy
10.3 Key Development Analysis
(Expansions/Mergers & Acquisitions/Joint Ventures/New Product Developments/Agreements/Investments)
11. Company Profiles
11.1 Aloe Vera Australia
11.1.1 Company Overview
11.1.2 Financial Updates
11.1.3 Product/Business Segment Overview
11.1.4 Strategy
11.1.5 Key Developments
11.1.6 SWOT Analysis
11.2 Aloe Plus Lanzarote S.L.
11.2.1 Company Overview
11.2.2 Financial Updates
11.2.3 Product/Business Segment Overview
11.2.4 Strategy
11.2.5 Key Developments
11.2.6 SWOT Analysis
11.3 Lily of the Desert
11.3.1 Company Overview
11.3.2 Financial Updates
11.3.3 Product/Business Segment Overview
11.3.4 Strategy
11.3.5 Key Developments
11.3.6 SWOT Analysis
11.4 NOW Health Group, Inc
11.4.1 Company Overview
11.4.2 Financial Updates
11.4.3 Product/Business Segment Overview
11.4.4 Strategy
11.4.5 Key Developments
11.4.6 SWOT Analysis
11.5 Forever Living.com, L.L.C.
11.5.1 Company Overview
11.5.2 Financial Updates
11.5.3 Product/Business Segment Overview
11.5.4 Strategy
11.5.5 Key Developments
11.5.6 SWOT Analysis
11.6 Okyalo Co., Ltd
11.6.1 Company Overview
11.6.2 Financial Updates
11.6.3 Product/Business Segment Overview
11.6.4 Strategy
11.6.5 Key Developments
11.6.6 SWOT Analysis
11.7 Real Aloe Solutions Inc.
11.7.1 Company Overview
11.7.2 Financial Updates
11.7.3 Product/Business Segment Overview
11.7.4 Strategy
11.7.5 Key Developments
11.7.6 SWOT Analysis
11.8 Patanjali Ayurved Limited
11.8.1 Company Overview
11.8.2 Financial Updates
11.8.3 Product/Business Segment Overview
11.8.4 Strategy
11.8.5 Key Developments
11.8.6 SWOT Analysis
11.9 Herbalife International of America, Inc.
11.9.1 Company Overview
11.9.2 Financial Updates
11.9.3 Product/Business Segment Overview
11.9.4 Strategy
11.9.5 Key Developments
11.9.6 SWOT Analysis
11.10 Sarvliving
11.10.1 Company Overview
11.10.2 Financial Updates
11.10.3 Product/Business Segment Overview
11.10.4 Strategy
11.10.5 Key Developments
11.10.6 SWOT Analysis
11.11 Green Leaf Naturals
11.11.1 Company Overview
11.11.2 Financial Updates
11.11.3 Product/Business Segment Overview
11.11.4 Strategy
11.11.5 Key Developments
11.11.6 SWOT Analysis
11.12 Warren Laboratories LLC
11.12.1 Company Overview
11.12.2 Financial Updates
11.12.3 Product/Business Segment Overview
11.12.4 Strategy
11.12.5 Key Developments
11.12.6 SWOT Analysis
11.13 Lakewood Juice Company
11.13.1 Company Overview
11.13.2 Financial Updates
11.13.3 Product/Business Segment Overview
11.13.4 Strategy
11.13.5 Key Developments
11.13.6 SWOT Analysis
11.14 Biofinest
11.14.1 Company Overview
11.14.2 Financial Updates
11.14.3 Product/Business Segment Overview
11.14.4 Strategy
11.14.5 Key Developments
11.14.6 SWOT Analysis
11.15 The Nature's Bounty Co
11.15.1 Company Overview
11.15.2 Financial Updates
11.15.3 Product/Business Segment Overview
11.15.4 Strategy
11.15.5 Key Developments
11.15.6 SWOT Analysis
11.16 LR Health & Beauty Systems GmbH
11.16.1 Company Overview
11.16.2 Financial Updates
11.16.3 Product/Business Segment Overview
11.16.4 Strategy
11.16.5 Key Developments
11.16.6 SWOT Analysis
12. Conclusion
LIST OF TABLES
Table 1 Global Aloe Vera Products Market, by Region, 2018–2023 (USD Million)
Table 2 Global Aloe Vera Products Market, by Type, 2018–2023 (USD Million)
Table 3 Global Aloe Vera Products Market, by Category, 2018–2023 (USD Million)
Table 4 Global Aloe Vera Products Market, by Distribution Channel, 2018–2023 (USD Million)
Table 5 North America: Aloe Vera Products Market, by Country, 2018–2023 (USD Million)
Table 6 North America: Aloe Vera Products Market, by Type, 2018–2023 (USD Million)
Table 7 North America: Aloe Vera Products Market, by Category, 2018–2023 (USD Million)
Table 8 North America: Aloe Vera Products Market, by Distribution Channel, 2018–2023 (USD Million)
Table 9 US: Aloe Vera Products Market, by Type, 2018–2023 (USD Million)
Table 10 US: Aloe Vera Products Market, by Category, 2018–2023 (USD Million)
Table 11 US: Aloe Vera Products Market, by Distribution Channel, 2018–2023 (USD Million)
Table 12 Canada: Aloe Vera Products Market, by Type, 2018–2023 (USD Million)
Table 13 Canada: Aloe Vera Products Market, by Category, 2018–2023 (USD Million)
Table 14 Canada: Aloe Vera Products Market, by Distribution Channel, 2018–2023 (USD Million)
Table 15 Mexico: Aloe Vera Products Market, by Type, 2018–2023 (USD Million)
Table 16 Mexico: Aloe Vera Products Market, by Category, 2018–2023 (USD Million)
Table 17 Mexico: Aloe Vera Products Market, by Distribution Channel, 2018–2023 (USD Million)
Table 18 Europe: Aloe Vera Products Market, by Country, 2018–2023 (USD Million)
Table 19 Europe: Aloe Vera Products Market, by Type, 2018–2023 (USD Million)
Table 20 Europe: Aloe Vera Products Market, by Category, 2018–2023 (USD Million)
Table 21 Europe: Aloe Vera Products Market, by Distribution Channel, 2018–2023 (USD Million)
Table 22 Germany: Aloe Vera Products Market, by Type, 2018–2023 (USD Million)
Table 23 Germany: Aloe Vera Products Market, by Category, 2018–2023 (USD Million)
Table 24 Germany: Aloe Vera Products Market, by Distribution Channel, 2018–2023 (USD Million)
Table 25 France: Aloe Vera Products Market, by Type, 2018–2023 (USD Million)
Table 26 France: Aloe Vera Products Market, by Category, 2018–2023 (USD Million)
Table 27 France: Aloe Vera Products Market, by Distribution Channel, 2018–2023 (USD Million)
Table 28 Italy: Aloe Vera Products Market, by Type, 2018–2023 (USD Million)
Table 29 Italy: Aloe Vera Products Market, by Category, 2018–2023 (USD Million)
Table 30 Italy: Aloe Vera Products Market, by Distribution Channel, 2018–2023 (USD Million)
Table 31 Spain: Aloe Vera Products Market, by Type, 2018–2023 (USD Million)
Table 32 Spain: Aloe Vera Products Market, by Category, 2018–2023 (USD Million)
Table 33 Spain: Aloe Vera Products Market, by Distribution Channel, 2018–2023 (USD Million)
Table 34 UK: Aloe Vera Products Market, by Type, 2018–2023 (USD Million)
Table 35 UK: Aloe Vera Products Market, by Category, 2018–2023 (USD Million)
Table 36 UK: Aloe Vera Products Market, by Distribution Channel, 2018–2023 (USD Million)
Table 37 Rest of Europe: Aloe Vera Products Market, by Type, 2018–2023 (USD Million)
Table 38 Rest of Europe: Aloe Vera Products Market, by Category, 2018–2023 (USD Million)
Table 39 Rest of Europe: Aloe Vera Products Market, by Distribution Channel, 2018–2023 (USD Million)
Table 40 Asia-Pacific: Aloe Vera Products Market, by Country, 2018–2023 (USD Million)
Table 41 Asia-Pacific: Aloe Vera Products Market, by Type, 2018–2023 (USD Million)
Table 42 Asia-Pacific: Aloe Vera Products Market, by Category, 2018–2023 (USD Million)
Table 43 Asia-Pacific: Aloe Vera Products Market, by Distribution Channel, 2018–2023 (USD Million)
Table 44 China: Aloe Vera Products Market, by Type, 2018–2023 (USD Million)
Table 45 China: Aloe Vera Products Market, by Category, 2018–2023 (USD Million)
Table 46 China: Aloe Vera Products Market, by Distribution Channel, 2018–2023 (USD Million)
Table 47 India: Aloe Vera Products Market, by Type, 2018–2023 (USD Million)
Table 48 India: Aloe Vera Products Market, by Category, 2018–2023 (USD Million)
Table 49 India: Aloe Vera Products Market, by Distribution Channel, 2018–2023 (USD Million)
Table 50 Japan: Aloe Vera Products Market, by Type, 2018–2023 (USD Million)
Table 51 Japan: Aloe Vera Products Market, by Category, 2018–2023 (USD Million)
Table 52 Japan: Aloe Vera Products Market, by Distribution Channel, 2018–2023 (USD Million)
Table 53 Australia & New Zealand: Aloe Vera Products Market, by Type, 2019-2024 (USD Million)
Table 54 Australia & New Zealand: Aloe Vera Products Market, by Category ,2019-2024 (USD Million)
Table 55 Australia & New Zealand: Aloe Vera Products Market, by Distribution Channel, 2019-2024 (USD Million)
Table 56 Rest of Asia-Pacific: Aloe Vera Products Market, by Type, 2018–2023 (USD Million)
Table 57 Rest of Asia-Pacific: Aloe Vera Products Market, by Category, 2018–2023 (USD Million)
Table 58 Rest of Asia-Pacific: Aloe Vera Products Market, by Distribution Channel, 2018–2023 (USD Million)
Table 59 Rest of the World (RoW): Aloe Vera Products Market, by Country, 2018–2023 (USD Million)
Table 60 Rest of the World (RoW): Aloe Vera Products Market, by Type, 2018–2023 (USD Million)
Table 61 Rest of the World (RoW): Aloe Vera Products Market, by Category, 2018–2023 (USD Million)
Table 62 Rest of the World (RoW): Aloe Vera Products Market, by Distribution Channel, 2018–2023 (USD Million)
Table 63 South America: Aloe Vera Products Market, by Type, 2018–2023 (USD Million)
Table 64 South America: Aloe Vera Products Market, by Category, 2018–2023 (USD Million)
Table 65 South America: Aloe Vera Products Market, by Distribution Channel, 2018–2023 (USD Million)
Table 66 Middle East: Aloe Vera Products Market, by Type, 2018–2023 (USD Million)
Table 67 Middle East: Aloe Vera Products Market, by Category, 2018–2023 (USD Million)
Table 68 Middle East: Aloe Vera Products Market, by Distribution Channel, 2018–2023 (USD Million)
Table 69 Africa: Aloe Vera Products Market, by Type, 2018–2023 (USD Million)
Table 70 Africa: Aloe Vera Products Market, by Category, 2018–2023 (USD Million)
Table 71 Africa: Aloe Vera Products Market, by Distribution Channel, 2018–2023 (USD Million)
LIST OF FIGURES
FIGURE 1 Global Aloe Vera Products Market Segmentation
FIGURE 2 Forecast Research Methodology
FIGURE 3 Five Forces Analysis of the Global Aloe Vera Products Market
FIGURE 4 Value Chain of the Global Aloe Vera Products Market
FIGURE 5 Share of the Global Aloe Vera Products Market in 2018, by Country (%)
FIGURE 6 Global Aloe Vera Products Market, by Region, 2018–2023,
FIGURE 7 Global Aloe Vera Products Market Size, by Type, 2018
FIGURE 8 Share of the Global Aloe Vera Products Market, by Type, 2018–2023 (%)
FIGURE 9 Global Aloe Vera Products Market Size, by Category, 2018
FIGURE 10 Share of the Global Aloe Vera Products Market, by Category, 2018–2023 (%)
FIGURE 11 Global Aloe Vera Products Market Size, by Distribution Channel, 2018
FIGURE 12 Share of the Global Aloe Vera Products Market, by Distribution Channel, 2018–2023 (%)