Air Handling Units Market (2026 - 2035)

ID: MRFR/EnP/0456-CR 128 Pages Chitranshi Jaiswal Last Updated: October 17, 2026
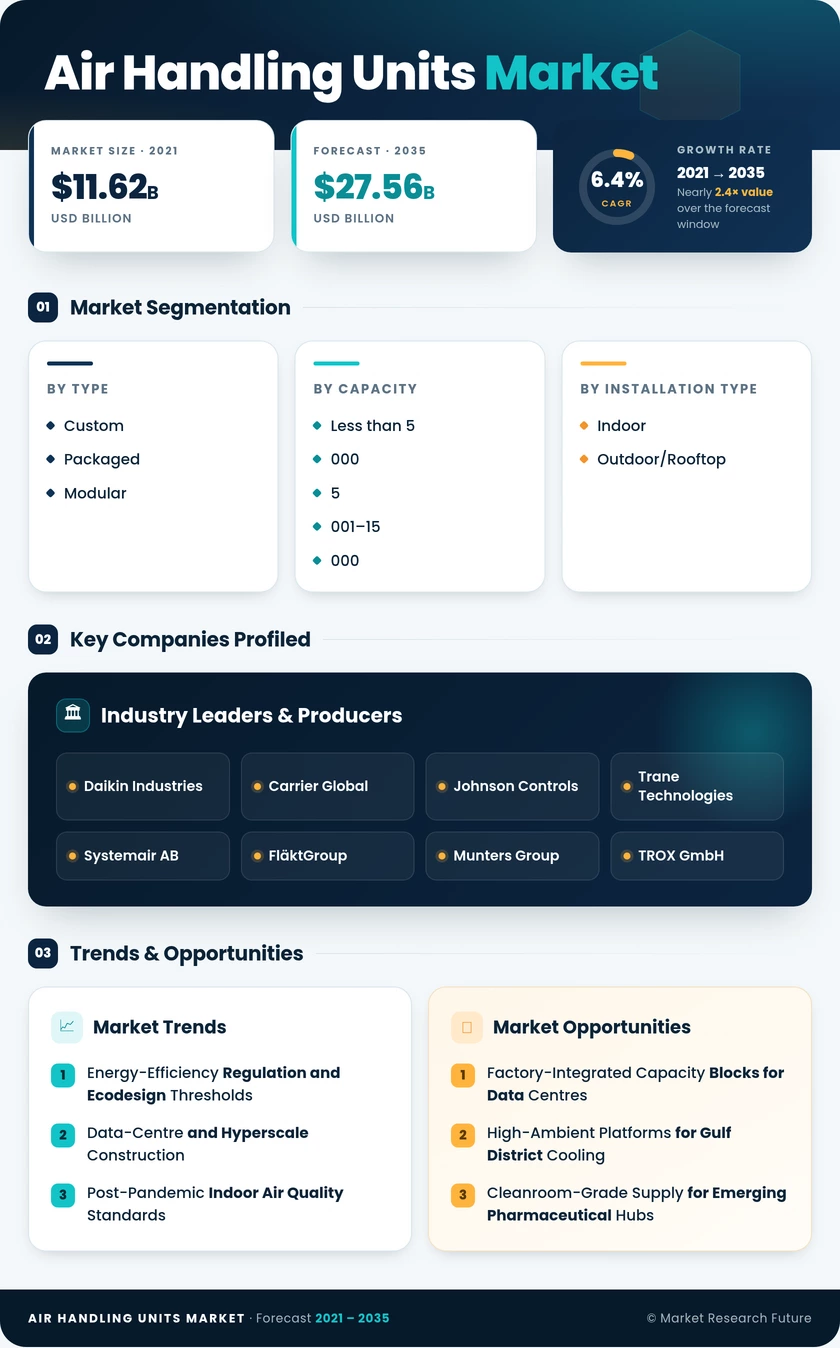
Air Handling Units Market Research Report By Type (Custom, Packaged, Modular), By Capacity (Less than 5,000, 5,001–15,000, Above 15,000), By Installation Type (Indoor, Outdoor/Rooftop), By Technology (Heat-Pipe, Run-Around Coil, Plate Heat Exchanger, Thermodynamic (Heat Pump), Desiccant Wheel), By Application (Comfort Ventilation, Process Ventilation), By End-User (Residential, Commercial, Industrial) - Forecast to 2035
Air Handling Units Market
Market Size
Forecast Period2026-2035
CAGR (2026-2035)6.4%
2025 Market SizeUSD 14.81 Billion
2035 Market SizeUSD 27.56 Billion
Key Players
Daikin Industries
Carrier Global
Johnson Controls
Trane Technologies
Systemair AB
FläktGroup
Opportunities
  • Factory-Integrated Capacity Blocks for Data Centres
  • High-Ambient Platforms for Gulf District Cooling
  • Cleanroom-Grade Supply for Emerging Pharmaceutical Hubs
  1. 1 Market Summary | |
    1. 1.1 Study Assumptions & Market Definition | |
    2. 1.2 Scope of the Study | |
    3. 1.3 Research Methodology | |
  2. 2 Key Report Takeaways | |
    1. 2.1 By Type | |
    2. 2.2 By Capacity | |
    3. 2.3 By Installation Type | |
    4. 2.4 By Technology | |
    5. 2.5 By Application | |
    6. 2.6 By End-user | |
    7. 2.7 By Region | |
  3. 3 Market Size and Forecast (2021–2035) | |
    1. 3.1 Historical Market Size (2021–2024) | |
    2. 3.2 Base Year Assessment (2025) | |
    3. 3.3 Forecast Market Size (2026–2035) | |
    4. 3.4 Year-over-Year Growth Analysis | |
  4. 4 Driver Impact Analysis | |
    1. 4.1 Energy-Efficiency Regulation and Ecodesign Thresholds | |
    2. 4.2 Data-Centre and Hyperscale Construction | |
    3. 4.3 Post-Pandemic Indoor Air Quality Standards | |
    4. 4.4 Pharmaceutical and Semiconductor Cleanroom Capex | |
    5. 4.5 Building Electrification and Heat-Pump Integration | |
    6. 4.6 District Cooling in High-Ambient Markets | |
    7. 4.7 Replacement of Aging Installed Base | |
  5. 5 Restraints Impact Analysis | |
    1. 5.1 Raw Material and Component Cost Inflation | |
    2. 5.2 Skilled HVAC Installation and Service Labour Shortage | |
    3. 5.3 High Upfront Capital Cost Versus Decentralised Alternatives | |
    4. 5.4 Refrigerant Transition Compliance Complexity | |
    5. 5.5 Commercial Real-Estate Vacancy and Construction Slowdown | |
  6. 6 Opportunities | |
    1. 6.1 Factory-Integrated Capacity Blocks for Data Centres | |
    2. 6.2 High-Ambient Platforms for Gulf District Cooling | |
    3. 6.3 Cleanroom-Grade Supply for Emerging Pharmaceutical Hubs | |
    4. 6.4 Outcome-Based Service Contracts and Performance Data Monetisation | |
    5. 6.5 Heat-Recovery Retrofit Kits for Existing Plant | |
  7. 7 Regional Market Share and Country-Level Analysis | |
    1. 7.1 North America | | |
      1. 7.1.1 United States | | |
      2. 7.1.2 Canada | |
    2. 7.2 Europe | | |
      1. 7.2.1 Germany | | |
      2. 7.2.2 United Kingdom | | |
      3. 7.2.3 France | | |
      4. 7.2.4 Italy | | |
      5. 7.2.5 Rest of Europe | |
    3. 7.3 Asia-Pacific | | |
      1. 7.3.1 China | | |
      2. 7.3.2 India | | |
      3. 7.3.3 Japan | | |
      4. 7.3.4 South Korea | | |
      5. 7.3.5 Australia | | |
      6. 7.3.6 Rest of Asia-Pacific | |
    4. 7.4 South America | | |
      1. 7.4.1 Brazil | | |
      2. 7.4.2 Argentina | | |
      3. 7.4.3 Rest of South America | |
    5. 7.5 Middle East & Africa | | |
      1. 7.5.1 Saudi Arabia | | |
      2. 7.5.2 United Arab Emirates | | |
      3. 7.5.3 South Africa | | |
      4. 7.5.4 Rest of Middle East & Africa | |
  8. 8 Future Outlook (2026–2035) | |
    1. 8.1 Autonomous Fault Detection and Self-Optimising Plant | |
    2. 8.2 The Electrification Supercycle | |
    3. 8.3 Outcome-Based Commercial Models and Digital Twins | |
    4. 8.4 Embodied Carbon and ESG Disclosure | |
  9. 9 Segmentation Analysis | |
    1. 9.1 By Type | | |
      1. 9.1.1 Custom | | |
      2. 9.1.2 Packaged | | |
      3. 9.1.3 Modular | |
    2. 9.2 By Capacity | | |
      1. 9.2.1 Less than 5,000 | | |
      2. 9.2.2 5,001–15,000 | | |
      3. 9.2.2 Above 15,000 | |
    3. 9.3 By Installation Type | | |
      1. 9.3.1 Indoor | | |
      2. 9.3.2 Outdoor/Rooftop | |
    4. 9.4 By Technology | | |
      1. 9.4.1 Heat-Pipe | | |
      2. 9.4.2 Run-Around Coil | | |
      3. 9.4.3 Plate Heat Exchanger | | |
      4. 9.4.4 Thermodynamic (Heat Pump) | | |
      5. 9.4.5 Desiccant Wheel | |
    5. 9.5 By Application | | |
      1. 9.5.1 Comfort Ventilation | | |
      2. 9.5.2 Process Ventilation | |
    6. 9.6 By End-user | | |
      1. 9.6.1 Residential | | |
      2. 9.6.2 Commercial | | |
      3. 9.6.3 Industrial | |
  10. 10 Competitive Landscape | |
    1. 10.1 Market Concentration Analysis (2026) | |
    2. 10.2 Competitive Benchmarking Matrix | |
    3. 10.3 Company Profiles | |
  11. 11 Recent News & Developments | |
  12. 12 Report Scope and Methodology | |
  13. 13 Detailed Sources and Citations | |
  14. 14 Frequently Asked Questions (FAQs) | | LIST OF TABLES | |
  15. TABLE 1 Global Air Handling Units Market Size & Forecast, by Revenue (USD Billion), 2021–2035 | |
  16. TABLE 2 Global Air Handling Units Market — Year-over-Year Growth Analysis, 2021–2035 | |
  17. TABLE 3 Driver Impact Analysis — Estimated Contribution to CAGR, 2026–2035 | |
  18. TABLE 4 Restraint Impact Analysis — Estimated Drag on CAGR, 2026–2035 | |
  19. TABLE 5 Global Air Handling Units Market Size, by Region, 2021–2035 (USD Billion) | |
  20. TABLE 6 North America Air Handling Units Market Size, by Country, 2021–2035 (USD Billion) | |
  21. TABLE 7 Europe Air Handling Units Market Size, by Country, 2021–2035 (USD Billion) | |
  22. TABLE 8 Asia-Pacific Air Handling Units Market Size, by Country, 2021–2035 (USD Billion) | |
  23. TABLE 9 South America Air Handling Units Market Size, by Country, 2021–2035 (USD Billion) | |
  24. TABLE 10 Middle East & Africa Air Handling Units Market Size, by Country, 2021–2035 (USD Billion) | |
  25. TABLE 11 Global Air Handling Units Market Size, by Type, 2021–2035 (USD Billion) | |
  26. TABLE 12 Global Air Handling Units Market Size, by Capacity, 2021–2035 (USD Billion) | |
  27. TABLE 13 Global Air Handling Units Market Size, by Installation Type, 2021–2035 (USD Billion) | |
  28. TABLE 14 Global Air Handling Units Market Size, by Technology, 2021–2035 (USD Billion) | |
  29. TABLE 15 Global Air Handling Units Market Size, by Application, 2021–2035 (USD Billion) | |
  30. TABLE 16 Global Air Handling Units Market Size, by End-user, 2021–2035 (USD Billion) | |
  31. TABLE 17 Competitive Benchmarking Matrix — Global Air Handling Units Market, 2026 | |
  32. TABLE 18 Company Profiles — Key Players, Global Air Handling Units Market | |
  33. TABLE 19 Recent Developments & Strategic Announcements, 2023–2025 | |
  34. TABLE 20 Report Scope & Methodology Summary | |
  35. TABLE 21 Detailed Sources and Citations | | LIST OF FIGURES | |
  36. FIGURE 1 Market Dynamics — Drivers, Restraints and Opportunities Map | |
  37. FIGURE 2 Industry Value Chain Analysis — Component Supply to Commissioning | |
  38. FIGURE 3 Porter's Five Forces Analysis | |
  39. FIGURE 4 Global Market Size Trend and Forecast, 2021–2035 (USD Billion) | |
  40. FIGURE 5 Year-over-Year Growth Trajectory, 2022–2035 (%) | |
  41. FIGURE 6 Market Share by Type, 2025 vs 2035 (%) | |
  42. FIGURE 7 Market Share by Capacity, 2025 (%) | |
  43. FIGURE 8 Market Share by Installation Type, 2025 (%) | |
  44. FIGURE 9 Market Share by Technology, 2025 (%) | |
  45. FIGURE 10 Market Share by Application, 2025 (%) | |
  46. FIGURE 11 Market Share by End-user, 2025 (%) | |
  47. FIGURE 12 Regional Revenue Share, 2025 (%) | |
  48. FIGURE 13 Regional CAGR Comparison, 2026–2035 (%) | |
  49. FIGURE 14 Country-Level Revenue Contribution — Top Ten Markets, 2025 | |
  50. FIGURE 15 Competitive Landscape — Estimated Revenue Share Bands, 2026 | |
  51. FIGURE 16 Competitive Positioning Matrix — Breadth versus Specialisation

Segmentation Quick Reference

DimensionSub-SegmentsDominant SegmentFastest Growing Segment
By TypeCustom; Packaged; ModularPackaged (38.5% revenue share)Modular (9.1% CAGR)
By CapacityLess than 5,000; 5,001–15,000; Above 15,0005,001–15,000 (44.1% revenue share)Above 15,000 (9.9% CAGR)
By Installation TypeIndoor; Outdoor/RooftopIndoor (59.7% revenue share)Outdoor/Rooftop (8.5% CAGR)
By TechnologyHeat-Pipe; Run-Around Coil; Plate Heat Exchanger; Thermodynamic (Heat Pump); Desiccant WheelHeat-Pipe (26.4% revenue share)Thermodynamic (Heat Pump) (10.4% CAGR)
By ApplicationComfort Ventilation; Process VentilationComfort Ventilation (71.2% revenue share)Process Ventilation (8.9% CAGR)
By End-userResidential; Commercial; IndustrialCommercial (52.6% revenue share)Industrial (8.7% CAGR)
By RegionNorth America; Europe; Asia-Pacific; South America; Middle East & AfricaAsia-Pacific (29.3% revenue share)Middle East & Africa (9.6% CAGR)


Market Segmentation Overview

By Type

Sub-SegmentKey Trend
CustomBespoke filtration, humidity and containment specifications for regulated facilities
PackagedCatalogue selection with predictable pricing and short lead times
ModularFactory-assembled capacity blocks enabling phased expansion without downtime


Packaged equipment leads on selection economics: specifying engineers pull from published performance tables, and delivery windows run roughly half those of engineered units. Modular grows fastest because data-centre developers add air-side capacity in steps matched to rack energisation, and because factory assembly sidesteps the site labour scarcity constraining commissioning schedules. Custom retains a protected position wherever validated construction and documented leakage classification rule out catalogue selections outright.

By Capacity

Sub-SegmentKey Trend
Less than 5,000Compact recovery and low-noise selections for premium residential towers
5,001–15,000Workhorse tier serving hospitals, campuses and mixed-use podiums
Above 15,000Integration with district thermal loops and industrial heat-pump plant


The 5,001–15,000 tier dominates because it matches the airflow demand of the building types constructed most frequently. Above 15,000 grows fastest, pulled by electrified process heat and district networks where a single unit serves a plant rather than a floorplate. Less than 5,000 stays relevant in high-rise residential, but acoustic limits and shaft space cap its expansion against the larger tiers.

By Installation Type

Sub-SegmentKey Trend
IndoorConventional mechanical-room placement in institutional and office stock
Outdoor/RooftopWeatherised, crane-lifted units that release lettable floor area


Indoor remains dominant because the existing building stock was designed around plant rooms, and retrofits inherit that geometry. Outdoor/Rooftop grows faster as developers price plant-room floor area against lease revenue and conclude that weatherised equipment wins over a holding period. Rooftop placement also lets occupied-building retrofits proceed without displacing tenants, which matters in commercial refurbishment across North America and Europe.

By Technology

Sub-SegmentKey Trend
Heat-PipePassive reheat load reduction with minimal maintenance burden
Run-Around CoilSegregated-stream recovery where cross-contamination is prohibited
Plate Heat ExchangerNo moving parts for facilities with constrained service budgets
Thermodynamic (Heat Pump)Simultaneous cooling and process water under electrification mandates
Desiccant WheelLow-dewpoint supply air for food processing and pharmaceutical duty


Heat-Pipe leads because public and institutional operators value recovery that needs no rotating components or seasonal recommissioning, and Plate Heat Exchanger competes for the same reason. Thermodynamic (Heat Pump) grows fastest as European electrification funding makes integrated compressor sections cheaper to run than gas reheat. Run-Around Coil holds ground in hospitals and laboratories where segregation rules forbid shared recovery media, while Desiccant Wheel serves the narrow low-dewpoint niche.

By Application

Sub-SegmentKey Trend
Comfort VentilationOccupant conditioning across offices, retail, hospitality and education
Process VentilationClassification-driven treatment for cleanrooms, food plants and industrial exhaust


Comfort Ventilation dominates in installed volume because most conditioned floor area exists to house people. Process Ventilation grows faster and carries higher engineering content: classification requirements, pressure-cascade control, and qualification documentation raise both price and switching costs. Process buyers also replace equipment on validation schedules rather than after failure, giving suppliers more predictable reorder visibility than comfort applications provide.

By End-user

Sub-SegmentKey Trend
ResidentialCentral air treatment marketed as an amenity in premium high-rise towers
CommercialBroadest configuration demand across offices, healthcare, education, and data centres
IndustrialProcess heat electrification and manufacturing capacity expansion


Commercial buyers set product direction because they absorb the widest capacity range and fund the controls and recovery features that later migrate elsewhere. Industrial grows fastest on cleanroom and process-heat investment, particularly across Asian manufacturing corridors. Residential adoption stays confined to premium towers where developers can recover central plant cost in unit pricing, leaving penetration well below commercial levels throughout the forecast.




Download PDF ×

We do not share your information with anyone. However, we may send you emails based on your report interest from time to time. You may contact us at any time to opt-out.