Segmentation Quick Reference
| Dimension | Sub-Segments | Dominant Segment (2025) | Fastest Growing Segment (2026–2035) |
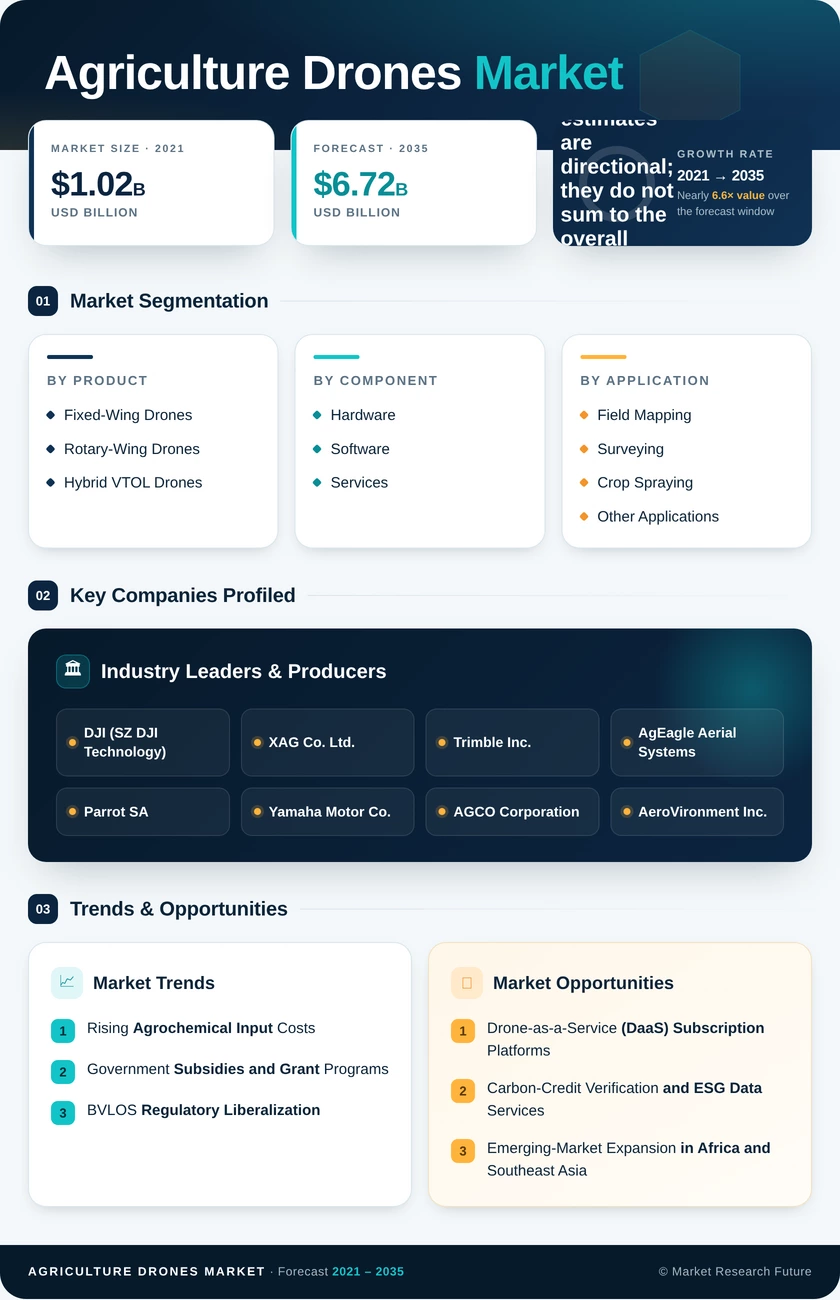
| By Product | Fixed-Wing Drones, Rotary-Wing Drones, Hybrid VTOL Drones | Rotary-Wing Drones | Hybrid VTOL Drones |
| By Component | Hardware, Agriculture Drones Market, Services | Hardware | Services |
| By Application | Field Mapping and Surveying, Crop Spraying, Other Applications | Field Mapping and Surveying | Crop Spraying |
| By Farm Size | Large-Scale Commercial Farms, Small and Medium Farms | Large-Scale Commercial Farms | Small and Medium Farms |
| By Region | North America, Europe, Asia-Pacific, South America, Middle East & Africa | North America | Asia-Pacific |
Market Segmentation Overview
By Product
| Sub-Segment | Key Trend |
| Fixed-Wing Drones | Preferred for large-acreage mapping missions requiring 60+ minute flight endurance |
| Rotary-Wing Drones | Dominant platform for hover-dependent spray and inspection tasks across all farm sizes |
| Hybrid VTOL Drones | Fastest-growing segment, combining vertical takeoff flexibility with fixed-wing cruise efficiency |
Rotary-wing platforms will maintain the largest installed base through 2035. Still, hybrid VTOL designs are closing the gap as battery technology improves and plantation-crop operators demand longer range per sortie.
By Component
| Sub-Segment | Key Trend |
| Hardware | Airframe costs declining 12–15% annually; sensor integration driving ASP premiums. |
| Agriculture Drones Market | Prescription-map generation and fleet-management platforms are gaining recurring-revenue traction. |
| Services | DaaS, maintenance, and training contracts are growing as operators outsource non-core functions. |
The component mix is shifting from hardware-heavy to services-led, with the inflection point expected in the early 2030s as fleet saturation in mature markets redirects spending toward subscriptions and analytics.
By Application
| Sub-Segment | Key Trend |
| Field Mapping and Surveying | Foundation application; multispectral and thermal imaging drives NDVI-based decision-making |
| Crop Spraying | Fastest-growing use case, fueled by regulatory tightening on chemical over-application |
| Other Applications | Emerging niches in drone seeding, pollination assistance, and livestock herd monitoring |
Crop spraying will narrow the gap with field mapping by the late 2020s as BVLOS approvals enable autonomous long-range spray missions across large estates.
By Farm Size
| Sub-Segment | Key Trend |
| Large-Scale Commercial Farms | Fleet ownership model; drones integrated into standard agronomic workflows |
| Small and Medium Farms | DaaS and cooperative-sharing models are lowering adoption barriers; the strongest growth trajectory. |
Government subsidies and fleet-sharing cooperatives are the primary catalysts for small and medium farm adoption, particularly in India, Southeast Asia, and Sub-Saharan Africa.
By Region
| Sub-Segment | Key Trend |
| North America | Regulatory clarity and large-acreage row crops sustain a dominant revenue share. |
| Europe | CAP eco-scheme incentives and EASA U-Space harmonization drive steady adoption |
| Asia-Pacific | India and China's fleet build-out propels the fastest regional growth rate. |
| South America | Brazil's soybean and sugarcane estates anchor regional demand. |
| Middle East & Africa | Food-security investment programs and NGO pilots seed early-stage growth. |
Asia-Pacific is expected to close the revenue gap with North America by the mid-2030s as India's Kisan Drone program and China's agricultural modernization initiatives mature.