


Advanced Composites Size
Market Size Snapshot
| Year | Value |
|---|---|
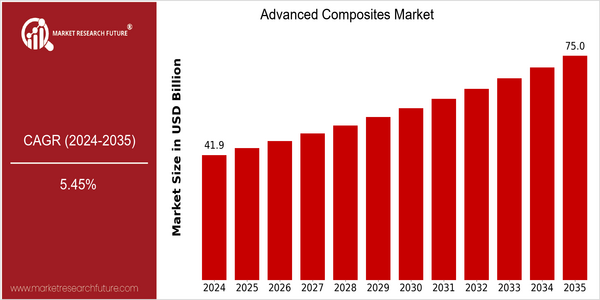
| 2024 | USD 41.85 Billion |
| 2035 | USD 75.0 Billion |
| CAGR (2025-2035) | 5.45 % |
Note – Market size depicts the revenue generated over the financial year
The advanced composites market is poised for substantial growth. CAGR (compound annual growth rate) of 5.45 % between 2025 and 2035. This is mainly driven by the growing demand for lightweight, high-strength materials in various industries such as aerospace, automotive and construction. Furthermore, technological advances in the manufacturing processes of advanced composites, such as automated fiber placement and 3D printing, have further improved the efficiency and performance of advanced composites, thus increasing the interest of both manufacturers and end users. The major players in the advanced composites industry, such as Hexcel, Toray Industries and SGL Group, are investing heavily in R & D to develop new products and expand their product offerings. Strategic initiatives, such as joint ventures and other collaborations, are also contributing to the growth of the market. In recent years, for example, a number of joint ventures between aircraft manufacturers and composite suppliers have been launched to improve the fuel efficiency and reduce the emissions of aircraft. As these trends continue, the market for advanced composites is expected to grow, driven by technological advances and increasing industry demand.
Regional Market Size
Regional Deep Dive
The advanced composites market is growing strongly in all regions, driven by the increasing demand for lightweight materials in the aviation, automobile and construction industries. The market dynamics in each region are influenced by technological developments, regulatory frameworks and economic conditions. North America leads the way in terms of innovation and development, while Europe focuses on sustainable development and regulatory compliance. Asia-Pacific is growing rapidly because of the industrialization and the development of the building industry. The Middle East and Africa are benefiting from strategic investments in the oil and gas industries. Latin America is gradually becoming an important market because of the local manufacturing initiatives and the availability of raw materials.
Europe
- The European Union's Green Deal is significantly influencing the advanced composites market, as it mandates reductions in carbon emissions, prompting companies like Airbus and BASF to develop eco-friendly composite materials.
- Innovations in recycling technologies for composite materials are gaining traction, with organizations like the Composites UK leading initiatives to promote circular economy practices within the industry.
Asia Pacific
- China's rapid industrialization and government initiatives, such as the Made in China 2025 plan, are propelling the demand for advanced composites in manufacturing sectors, particularly in automotive and electronics.
- Japan is a world leader in the development of advanced composite materials, with Toray Industries, for example, supplying high-performance materials that are increasingly used in sports equipment and car components.
Latin America
- Brazil is emerging as a key player in the advanced composites market, with local companies focusing on the development of bio-based composites to cater to the growing demand for sustainable materials in the automotive sector.
- The region is also seeing increased collaboration between universities and industries, such as the partnership between the University of São Paulo and Embraer, aimed at advancing research in composite materials for aerospace applications.
North America
- In the United States, the aeronautical industry has largely adopted the use of composites in the manufacture of aircraft. The manufacturers, such as Lockheed and the Boeing Company, have devoted considerable research to the problem of improving the material and reducing the weight.
- Recent regulatory changes, such as the FAA's emphasis on sustainable aviation practices, are pushing manufacturers to explore advanced composite materials that meet stringent environmental standards, thereby driving innovation in the sector.
Middle East And Africa
- In the Middle East, advanced composites are gaining ground in the oil and gas industry. The leading players such as the Abu Dhabi National Oil Company (ADNOC) are investing in composites for enhancing the performance of their pipes, reducing maintenance costs and increasing their longevity.
- Government initiatives in countries like Saudi Arabia are promoting the use of advanced composites in construction projects, aligning with Vision 2030 goals to diversify the economy and enhance infrastructure.
Did You Know?
“Advanced composites can be up to five times stronger than steel while being significantly lighter, making them ideal for applications where weight reduction is critical.” — American Composites Manufacturers Association (ACMA)
Segmental Market Size
The advanced composites market is booming, driven by the growing demand from industries such as the aeronautics, automobile and construction industries. The need to reduce the weight of the materials used, in order to reduce fuel consumption and improve performance, as well as the tightening of the regulatory framework to reduce CO2 emissions, are driving the market. Further increasing the demand are the technological advances in the manufacture of composite materials, enabling the production of high-performance materials that meet the standards set by the industry. These advances are now at a stage where the industry is using the materials at a larger scale. The aeronautics industry is now led by the likes of Airbus and Boeing, which are deploying carbon fibre-reinforced polymers in the manufacture of aircraft components. In the automobile industry, manufacturers such as BMW and Tesla are using composites to improve the performance and the environment friendliness of their cars. The main applications of composites are in the aeronautics industry, in the manufacture of automobile components and in the wind energy industry. These applications are driven by the macro-economic and regulatory trends towards the green economy and the use of sustainable materials. The development of manufacturing processes such as 3D printing and automated fibre placement are influencing the evolution of the industry.
Future Outlook
In the year 2035, the advanced composites market is expected to grow from a value of $ 41.85 billion to $ 75 billion, a CAGR of 5.56%. This growth is driven by the increasing demand for lightweight and high-strength materials in various industries, such as aviation, automobiles and construction. As a result of the manufacturers' efforts to reduce fuel consumption and emissions, the use of advanced composites is expected to increase further in these industries. In the year 2035, the percentage of advanced composites used in the aircraft industry is expected to reach 30%, and in the automobile industry, it is expected to reach 25%. The development of bio-based composites and the improvement of production methods such as 3D printing will also contribute to the market growth. The government's policy to promote sustainable materials and reduce carbon dioxide emissions will also encourage the use of advanced composites. The development of smart materials and the rise of the circular economy will also promote the development of this industry, and encourage innovation and investment. In this way, the market for advanced composites is expected to face a rapid technological development and policy support.


Leave a Comment