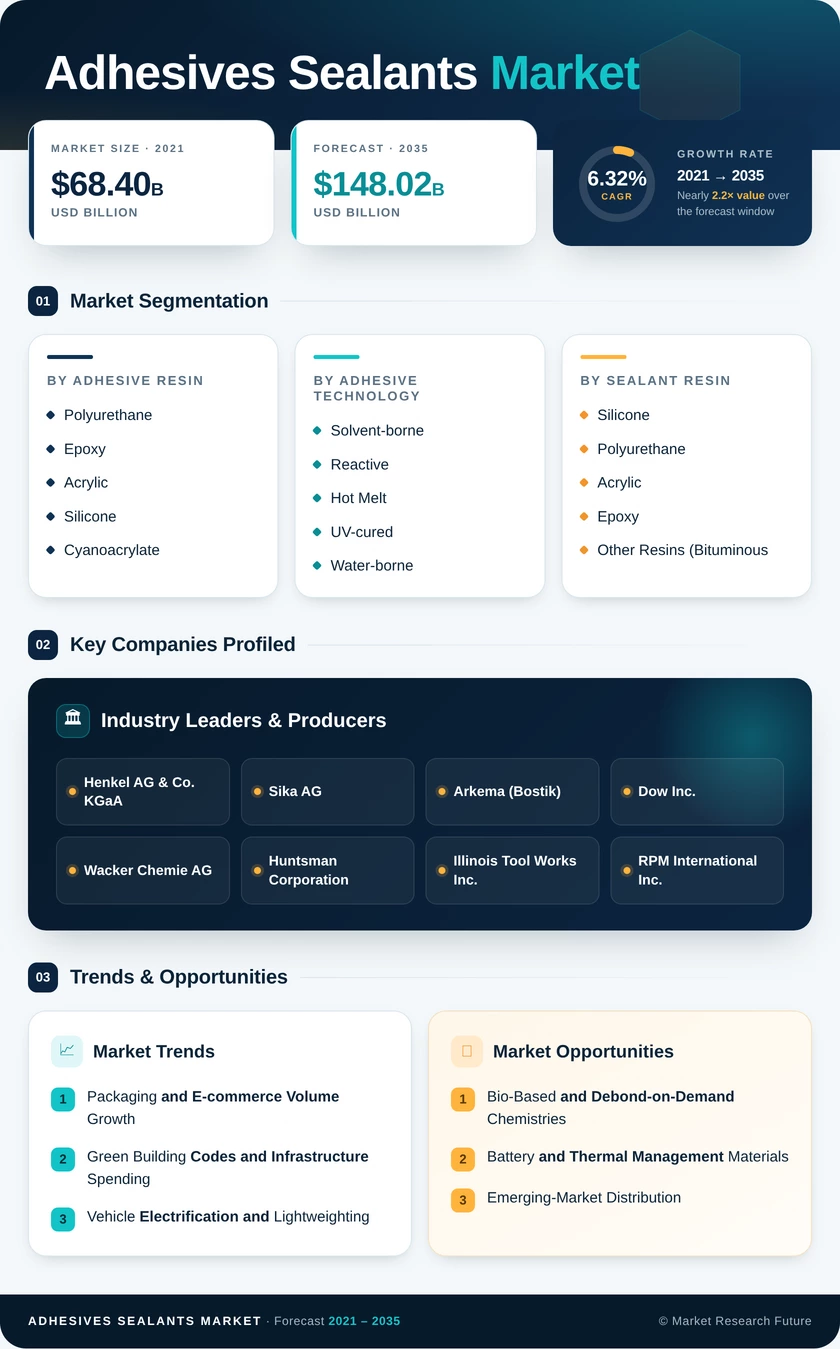
Adhesives Sealants Market (2026 - 2035)

ID: MRFR/CnM/0308-CR 111 Pages Chitranshi Jaiswal Last Updated: October 22, 2026
Adhesives and Sealants Market Research Report Information By Adhesive Resin (Polyurethane, Epoxy, Acrylic, Silicone, Cyanoacrylate, VAE / EVA, and Other Resins (Polyester, Rubber, etc.)), By Adhesive Technology (Solvent-borne, Reactive, Hot Melt, UV-cured, and Water-borne), By Sealant Resin (Silicone, Polyurethane, Acrylic, Epoxy, and Other Resins (Bituminous, Polysulfide, UV-curable, etc.)), By End-User Industry (Aerospace, Automotive, Building and Construction, Footwear and Leather, Healthcare, Packaging (Paper and Flexible), Woodwork and Joinery, and Other End-User Industries (Electronics, Consumer/DIY, etc.)), And By Region (North America, Europe, Asia-Pacific, and Rest of the World) – Market Forecast Till 2035.
Adhesives Sealants Market
Market Size
Forecast Period2026-2035
CAGR (2026-2035)6.32%
2025 Market SizeUSD 80.20 Billion
2035 Market SizeUSD 148.02 Billion
Key Players
Henkel AG & Co. KGaA
Sika AG
Arkema
Dow Inc.
Wacker Chemie AG
Huntsman Corporation
Opportunities
  • Bio-Based and Debond-on-Demand Chemistries
  • Battery and Thermal Management Materials
  • Emerging-Market Distribution
  1. 1 Market Summary | |
  2. 2 Key Report Takeaways | |
    1. 2.1 By Adhesive Resin | |
    2. 2.2 By Adhesive Technology | |
    3. 2.3 By Sealant Resin | |
    4. 2.4 By End-user Industry | |
    5. 2.5 By Region | |
  3. 3 Market Size and Forecast (2021–2035) | |
    1. 3.1 Historical Market Size (2021–2024) | |
    2. 3.2 Base Year and Forecast Market Size (2025–2035) | |
    3. 3.3 Year-over-Year Growth Analysis | |
  4. 4 Driver Impact Analysis | |
    1. 4.1 Packaging and E-commerce Volume Growth | |
    2. 4.2 Green Building Codes and Infrastructure Spending | |
    3. 4.3 Vehicle Electrification and Lightweighting | |
    4. 4.4 Urban Housing Programs in Emerging Asia | |
    5. 4.5 VOC Regulation Accelerating Low-Emission Chemistries | |
    6. 4.6 Electronics Miniaturization and Semiconductor Expansion | |
  5. 5 Restraints Impact Analysis | |
    1. 5.1 Petrochemical Feedstock Volatility | |
    2. 5.2 Diisocyanate and PFAS Restrictions | |
    3. 5.3 Property-Sector Slowdown in China | |
    4. 5.4 Recyclability Requirements for Multilayer Packaging | |
    5. 5.5 Price Competition from Regional Producers | |
  6. 6 Opportunities | |
    1. 6.1 Bio-Based and Debond-on-Demand Chemistries | |
    2. 6.2 Battery and Thermal Management Materials | |
    3. 6.3 Emerging-Market Distribution | |
    4. 6.4 Connected Dispensing and Service-Based Business Models | |
    5. 6.5 Renewable Energy Structures | |
  7. 7 Regional Market Share and Country-Level Analysis | |
    1. 7.1 North America | | |
      1. 7.1.1 United States | | |
      2. 7.1.2 Canada | | |
      3. 7.1.3 Mexico | |
    2. 7.2 Europe | | |
      1. 7.2.1 Germany | | |
      2. 7.2.2 United Kingdom | | |
      3. 7.2.3 France | | |
      4. 7.2.4 Italy | | |
      5. 7.2.5 Spain | | |
      6. 7.2.6 Russia | | |
      7. 7.2.7 Turkey | | |
      8. 7.2.8 Nordic Countries | | |
      9. 7.2.9 Rest of Europe | |
    3. 7.3 Asia-Pacific | | |
      1. 7.3.1 China | | |
      2. 7.3.2 India | | |
      3. 7.3.3 Japan | | |
      4. 7.3.4 South Korea | | |
      5. 7.3.5 Indonesia | | |
      6. 7.3.6 Malaysia | | |
      7. 7.3.7 Thailand | | |
      8. 7.3.8 Vietnam | | |
      9. 7.3.9 Rest of Asia-Pacific | |
    4. 7.4 South America | | |
      1. 7.4.1 Brazil | | |
      2. 7.4.2 Argentina | | |
      3. 7.4.3 Colombia | | |
      4. 7.4.4 Rest of South America | |
    5. 7.5 Middle East and Africa | | |
      1. 7.5.1 Saudi Arabia | | |
      2. 7.5.2 United Arab Emirates | | |
      3. 7.5.3 Qatar | | |
      4. 7.5.4 Egypt | | |
      5. 7.5.5 South Africa | | |
      6. 7.5.6 Algeria | | |
      7. 7.5.7 Rest of the Middle East and Africa | |
  8. 8 Future Outlook (2026–2035) | |
    1. 8.1 Electrification Supercycle | |
    2. 8.2 Circular Packaging and Bio-Based Feedstocks | |
    3. 8.3 AI-Assisted Formulation and Automated Dispensing | |
    4. 8.4 Building Decarbonization and Embodied Carbon Reporting | |
  9. 9 Segmentation Analysis | |
    1. 9.1 By Adhesive Resin | | |
      1. 9.1.1 Polyurethane | | |
      2. 9.1.2 Epoxy | | |
      3. 9.1.3 Acrylic | | |
      4. 9.1.4 Silicone | | |
      5. 9.1.5 Cyanoacrylate | | |
      6. 9.1.6 VAE / EVA | | |
      7. 9.1.7 Other Resins (Polyester, Rubber, etc.) | |
    2. 9.2 By Adhesive Technology | | |
      1. 9.2.1 Solvent-borne | | |
      2. 9.2.2 Reactive | | |
      3. 9.2.3 Hot Melt | | |
      4. 9.2.4 UV-cured | | |
      5. 9.2.5 Water-borne | |
    3. 9.3 By Sealant Resin | | |
      1. 9.3.1 Silicone | | |
      2. 9.3.2 Polyurethane | | |
      3. 9.3.3 Acrylic | | |
      4. 9.3.4 Epoxy | | |
      5. 9.3.5 Other Resins (Bituminous, Polysulfide UV-curable, etc.) | |
    4. 9.4 By End-user Industry | | |
      1. 9.4.1 Aerospace | | |
      2. 9.4.2 Automotive | | |
      3. 9.4.3 Building and Construction | | |
      4. 9.4.4 Footwear and Leather | | |
      5. 9.4.5 Healthcare | | |
      6. 9.4.6 Packaging (Paper and Flexible) | | |
      7. 9.4.7 Woodwork and Joinery | | |
      8. 9.4.8 Other End-user Industries (Electronics, Consumer/DIY, etc.) | |
  10. 10 Competitive Landscape | |
    1. 10.1 Market Concentration Analysis | |
    2. 10.2 Competitive Benchmarking Matrix | |
    3. 10.3 Company Profiles | | |
      1. 10.3.1 Henkel AG & Co. KGaA | | |
      2. 10.3.2 Sika AG | | |
      3. 10.3.3 3M Company | | |
      4. 10.3.4 H.B. Fuller Company | | |
      5. 10.3.5 Arkema (Bostik) | | |
      6. 10.3.6 Dow Inc. | | |
      7. 10.3.7 Wacker Chemie AG | | |
      8. 10.3.8 Huntsman Corporation | | |
      9. 10.3.9 Illinois Tool Works Inc. | | |
      10. 10.3.10 RPM International Inc. | | |
      11. 10.3.11 Avery Dennison Corporation | | |
      12. 10.3.12 Pidilite Industries Limited | |
  11. 11 Recent News & Developments | |
  12. 12 Report Scope and Methodology | |
  13. 13 Detailed Sources and Citations | |
  14. 14 Frequently Asked Questions (FAQs) | | LIST OF TABLES | | LIST OF FIGURES

Segmentation Quick Reference

DimensionSub-SegmentsDominant SegmentFastest Growing Segment
By Adhesive ResinPolyurethane, Epoxy, Acrylic, Silicone, Cyanoacrylate, VAE / EVA, Other Resins (Polyester, Rubber, etc.)Acrylic (21.9% share)Silicone (8.76% CAGR)
By Adhesive TechnologySolvent-borne, Reactive, Hot Melt, UV-cured, Water-borneWater-borne (39.1% share)Reactive (8.51% CAGR)
By Sealant ResinSilicone, Polyurethane, Acrylic, Epoxy, Other Resins (Bituminous, Polysulfide UV-curable, etc.)Silicone (41.6% share)Polyurethane (5.93% CAGR)
By End-user IndustryAerospace, Automotive, Building and Construction, Footwear and Leather, Healthcare, Packaging (Paper and Flexible), Woodwork and Joinery, Other End-user Industries (Electronics, Consumer/DIY, etc.)Packaging (Paper and Flexible) (39.6% share)Building and Construction (6.73% CAGR)
By RegionNorth America, Europe, Asia-Pacific, South America, Middle East and AfricaAsia-Pacific (46.5% share)Asia-Pacific (46.5% share)

Market Segmentation Overview

The four segmentation dimensions below summarize the key trend for each sub-segment of the Adhesives and Sealants Market.

By Adhesive Resin

Sub-SegmentKey Trend
PolyurethaneReactive hot melts gain in appliance and transport assembly
EpoxyBio-based epoxies from glycerol and lignin enter pilot use
AcrylicFaster-curing grades bond low-surface-energy plastics
SiliconeHigh-temperature demand from LED, battery and facade uses
CyanoacrylateMedical-grade and low-bloom formulations expand
VAE / EVAFormaldehyde-free dispersions for paper and wood
Other Resins (Polyester, Rubber, etc.)Retained in tack-sensitive niche applications

Acrylic leads at a 21.9% share because a single chemistry family covers tapes, labels and plastic bonding at moderate cost. Silicone grows fastest at an 8.76% CAGR, as battery modules, LED assemblies and building facades require elasticity and electrical insulation across wide temperature ranges. Polyurethane and VAE / EVA remain high-volume workhorses for laminates and woodworking.

By Adhesive Technology

Sub-SegmentKey Trend
Solvent-borneGradual substitution under VOC limits
ReactiveMoisture-curing hot melts enable structural assembly
Hot MeltLow-temperature grades reduce line energy use
UV-curedSeconds-level cure for electronics and medical devices
Water-borneFaster-drying dispersions close the speed gap

Water-borne technology dominates with a 39.1% share because VOC caps and porous packaging substrates favor dispersions. Reactive technology is the fastest grower at an 8.51% CAGR, displacing mechanical fasteners and Solvent-borne systems wherever structural strength and short fixture times matter. UV-cured grades complement this shift in electronics lines.

By Sealant Resin

Sub-SegmentKey Trend
SiliconeBiomethanol-based grades cut cradle-to-gate emissions
PolyurethaneInfrastructure expansion joints drive volume
AcrylicLow-shrink, paintable interior finishing
EpoxyChemical-resistant flooring and anchoring
Other Resins (Bituminous, Polysulfide UV-curable, etc.)Roofing and insulating-glass edge sealing

Silicone holds a 41.6% share on the strength of decades-long durability in curtain walls and solar framing. Polyurethane grows fastest at a 5.93% CAGR as highway, rail and airport programs specify abrasion-resistant expansion joints. Acrylic retains interior finishing demand where paintability outweighs flexibility.

By End-user Industry

Sub-SegmentKey Trend
AerospaceComposite airframe bonding follows build rates
AutomotiveBattery pack and lightweight body bonding
Building and ConstructionLow-emission codes and renovation programs
Footwear and LeatherWater-borne substitution in Asian factories
HealthcareSkin-friendly wearables and wound closure
Packaging (Paper and Flexible)Repulpable and recyclable-compatible grades
Woodwork and JoineryFormaldehyde-free engineered wood bonding
Other End-user Industries (Electronics, Consumer/DIY, etc.)Miniaturized device assembly and home repair

Packaging (Paper and Flexible) leads with a 39.6% share, sustained by e-commerce parcels and flexible food packaging that consume hot melts and laminating grades. Building and Construction expands fastest at a 6.73% CAGR because renovation mandates and low-emission codes raise both volume and value per project. Automotive and Healthcare add high-specification demand that rewards formulation expertise.


Download PDF ×

We do not share your information with anyone. However, we may send you emails based on your report interest from time to time. You may contact us at any time to opt-out.