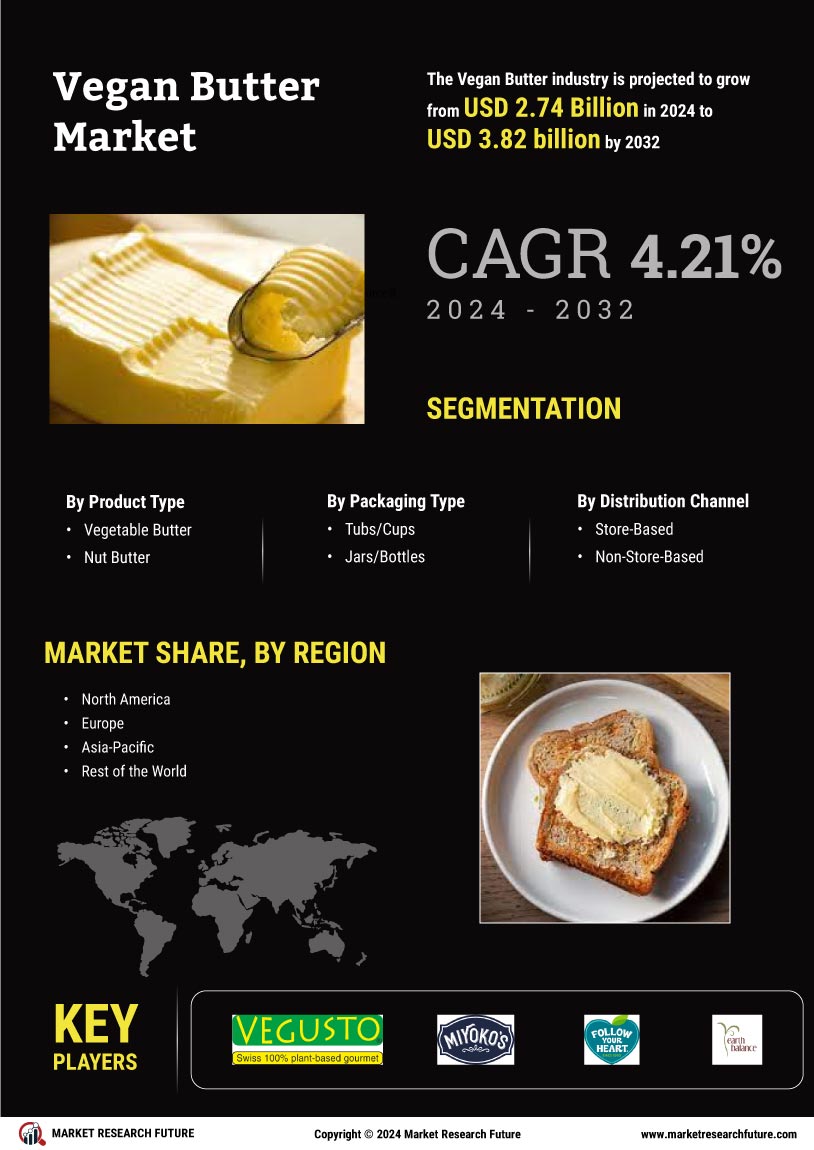


Segmentation du marché
Perspectives sur le type de beurre végétalien (milliards USD, 2018-2032)
- Beurre de légumes
- Beurre de noix
Perspectives sur le type d'emballage du beurre végétalien (milliards USD, 2018-2032)
- Barquettes/Tasses
- Jarres/Bouteilles
Perspectives sur le canal de distribution du beurre végétalien (milliards USD, 2018-2032)
- Basé en magasin
- Non basé en magasin
Perspectives régionales sur le beurre végétalien (milliards USD, 2018-2032)
- Perspectives de l'Amérique du Nord (milliards USD, 2018-2032)
- Beurre végétalien en Amérique du Nord par type
- Beurre de légumes
- Beurre de noix
- Beurre végétalien en Amérique du Nord par type d'emballage
- Barquettes/Tasses
- Jarres/Bouteilles
- Beurre végétalien en Amérique du Nord par canal de distribution
- Beurre végétalien en Amérique du Nord par type
- Basé en magasin
- Non basé en magasin
- Perspectives des États-Unis (milliards USD, 2018-2032)
- Beurre végétalien aux États-Unis par type
- Beurre de légumes
- Beurre de noix
- Beurre végétalien aux États-Unis par type d'emballage
- Barquettes/Tasses
- Jarres/Bouteilles
- Beurre végétalien aux États-Unis par canal de distribution
- Basé en magasin
- Non basé en magasin
- CANADA Perspectives (milliards USD, 2018-2032)
- Beurre végétalien au CANADA par type
- Beurre de légumes
- Beurre de noix
- Beurre végétalien au CANADA par type d'emballage
- Barquettes/Tasses
- Jarres/Bouteilles
- Beurre végétalien au CANADA par canal de distribution
- Basé en magasin
- Non basé en magasin
- Perspectives de l'Europe (milliards USD, 2018-2032)
- Beurre végétalien en Europe par type
- Beurre de légumes
- Beurre de noix
- Beurre végétalien en Europe par type d'emballage
- Barquettes/Tasses
- Jarres/Bouteilles
- Beurre végétalien en Europe par canal de distribution
- Beurre végétalien en Europe par type
- Basé en magasin
- Non basé en magasin
- Allemagne Perspectives (milliards USD, 2018-2032)
- Beurre végétalien en Allemagne par type
- Beurre de légumes
- Beurre de noix
- Beurre végétalien en Allemagne par type d'emballage
- Barquettes/Tasses
- Jarres/Bouteilles
- Beurre végétalien en Allemagne par canal de distribution
- Basé en magasin
- Non basé en magasin
- France Perspectives (milliards USD, 2018-2032)
- Beurre végétalien en France par type
- Beurre de légumes
- Beurre de noix
- Beurre végétalien en France par type d'emballage
- Barquettes/Tasses
- Jarres/Bouteilles
- Beurre végétalien en France par canal de distribution
- Basé en magasin
- Non basé en magasin
- Royaume-Uni Perspectives (milliards USD, 2018-2032)
- Beurre végétalien au Royaume-Uni par type
- Beurre de légumes
- Beurre de noix
- Beurre végétalien au Royaume-Uni par type d'emballage
- Barquettes/Tasses
- Jarres/Bouteilles
- Beurre végétalien au Royaume-Uni par canal de distribution
- Basé en magasin
- Non basé en magasin
- ITALIE Perspectives (milliards USD, 2018-2032)
- Beurre végétalien en ITALIE par type
- Beurre de légumes
- Beurre de noix
- Beurre végétalien en ITALIE par type d'emballage
- Barquettes/Tasses
- Jarres/Bouteilles
- Beurre végétalien en ITALIE par canal de distribution
- Basé en magasin
- Non basé en magasin
- ESPAGNE Perspectives (milliards USD, 2018-2032)
- Beurre végétalien en Espagne par type
- Beurre de légumes
- Beurre de noix
- Beurre végétalien en Espagne par type d'emballage
- Barquettes/Tasses
- Jarres/Bouteilles
- Beurre végétalien en Espagne par canal de distribution
- Basé en magasin
- Non basé en magasin
- Reste de l'Europe Perspectives (milliards USD, 2018-2032)
- Beurre végétalien dans le reste de l'Europe par type
- Beurre de légumes
- Beurre de noix
- Beurre végétalien dans le reste de l'Europe par type d'emballage
- Barquettes/Tasses
- Jarres/Bouteilles
- Beurre végétalien dans le reste de l'Europe par canal de distribution
- Basé en magasin
- Non basé en magasin
- Perspectives de la région Asie-Pacifique (milliards USD, 2018-2032)
- Beurre végétalien dans la région Asie-Pacifique par type
- Beurre de légumes
- Beurre de noix
- Beurre végétalien dans la région Asie-Pacifique par type d'emballage
- Barquettes/Tasses
- Jarres/Bouteilles
- Beurre végétalien dans la région Asie-Pacifique par canal de distribution
- Beurre végétalien dans la région Asie-Pacifique par type
- Basé en magasin
- Non basé en magasin
- Chine Perspectives (milliards USD, 2018-2032)
- Beurre végétalien en Chine par type
- Beurre de légumes
- Beurre de noix
- Beurre végétalien en Chine par type d'emballage
- Barquettes/Tasses
- Jarres/Bouteilles
- Beurre végétalien en Chine par canal de distribution
- Basé en magasin
- Non basé en magasin
- Japon Perspectives (milliards USD, 2018-2032)
- Beurre végétalien au Japon par type
- Beurre de légumes
- Beurre de noix
- Beurre végétalien au Japon par type d'emballage
- Barquettes/Tasses
- Jarres/Bouteilles
- Beurre végétalien au Japon par canal de distribution
- Basé en magasin
- Non basé en magasin
- Inde Perspectives (milliards USD, 2018-2032)
- Beurre végétalien en Inde par type
- Beurre de légumes
- Beurre de noix
- Beurre végétalien en Inde par type d'emballage
- Barquettes/Tasses
- Jarres/Bouteilles
- Beurre végétalien en Inde par canal de distribution
- Basé en magasin
- Non basé en magasin
- Australie Perspectives (milliards USD, 2018-2032)
- Beurre végétalien en Australie par type
- Beurre de légumes
- Beurre de noix
- Beurre végétalien en Australie par type d'emballage
- Barquettes/Tasses
- Jarres/Bouteilles
- Beurre végétalien en Australie par canal de distribution
- Basé en magasin
- Non basé en magasin
- Reste de la région Asie-Pacifique Perspectives (milliards USD, 2018-2032)
- Beurre végétalien dans le reste de la région Asie-Pacifique par type
- Beurre de légumes
- Beurre de noix
- Beurre végétalien dans le reste de la région Asie-Pacifique par type d'emballage
- Barquettes/Tasses
- Jarres/Bouteilles
- Beurre végétalien dans le reste de la région Asie-Pacifique par canal de distribution
- Basé en magasin
- Non basé en magasin
- Perspectives du reste du monde (milliards USD, 2018-2032)
- Beurre végétalien dans le reste du monde par type
- Beurre de légumes
- Beurre de noix
- Beurre végétalien dans le reste du monde par type d'emballage
- Barquettes/Tasses
- Jarres/Bouteilles
- Beurre végétalien dans le reste du monde par canal de distribution
- Beurre végétalien dans le reste du monde par type
- Basé en magasin
- Non basé en magasin
- Moyen-Orient Perspectives (milliards USD, 2018-2032)
- Beurre végétalien au Moyen-Orient par type
- Beurre de légumes
- Beurre de noix
- Beurre végétalien au Moyen-Orient par type d'emballage
- Barquettes/Tasses
- Jarres/Bouteilles
- Beurre végétalien au Moyen-Orient par canal de distribution
- Basé en magasin
- Non basé en magasin
- Africa Perspectives (milliards USD, 2018-2032)
- Beurre végétalien en Afrique par type
- Beurre de légumes
- Beurre de noix
- Beurre végétalien en Afrique par type d'emballage
- Barquettes/Tasses
- Jarres/Bouteilles
- Beurre végétalien en Afrique par canal de distribution
- Basé en magasin
- Non basé en magasin
- Amérique Latine Perspectives (milliards USD, 2018-2032)
- Beurre végétalien en Amérique Latine par type
- Beurre de légumes
- Beurre de noix
- Beurre végétalien en Amérique Latine par type d'emballage
- Barquettes/Tasses
- Jarres/Bouteilles
- Beurre végétalien en Amérique Latine par canal de distribution
- Basé en magasin
- Non basé en magasin


