Request Free Sample ×

Kindly complete the form below to receive a free sample of this Report

* Please use a valid business email

Leading companies partner with us for data-driven Insights

clients tt-cursor
Hero Background

Marché des barres d'armature en acier

ID: MRFR/CnM/8153-CR
111 Pages
Chitranshi Jaiswal
Last Updated: February 25, 2026

Rapport de recherche sur le marché des barres d'acier : Informations par type (Douce, Déformée), par utilisation finale (Infrastructure, Résidentiel, Commercial) et par région - Prévisions mondiales jusqu'en 2035

Partager
Download PDF ×

We do not share your information with anyone. However, we may send you emails based on your report interest from time to time. You may contact us at any time to opt-out.

Steel Rebar Market Infographic
Purchase Options
  1. 1 RÉSUMÉ EXÉCUTIF
    1. 1.1 ANALYSE DE L'ATTRACTIVITÉ DU MARCHÉ
      1. 1.1.1 MARCHÉ MONDIAL DES BARRES D'ACIER, PAR Type
      2. 1.1.2 MARCHÉ MONDIAL DES BARRES D'ACIER, PAR Utilisation Finale
      3. 1.1.3 MARCHÉ MONDIAL DES BARRES D'ACIER, PAR RÉGION
  2. 2 INTRODUCTION AU MARCHÉ
    1. 2.1 DÉFINITION
    2. 2.2 PORTÉE DE L'ÉTUDE
    3. 2.3 Objectif de la Recherche
    4. 2.4 STRUCTURE DU MARCHÉ
  3. 3 MÉTHODOLOGIE DE RECHERCHE
    1. 3.1 EXTRACTION DE DONNÉES
    2. 3.2 RECHERCHE SECONDAIRE
    3. 3.3 RECHERCHE PRIMAIRE
      1. 3.3.1 ENTRETIENS PRIMAIRES ET PROCESSUS DE COLLECTE D'INFORMATIONS
      2. 3.3.2 RÉPARTITION DES RÉPONDANTS PRINCIPAUX
    4. 3.4 MÉTHODOLOGIE DE RECHERCHE POUR L'ESTIMATION DE LA TAILLE DU MARCHÉ
      1. 3.4.1 APPROCHE PAR LE BAS
      2. 3.4.2 APPROCHE PAR LE HAUT
    5. 3.5 Validation des Données
    6. 3.6 Hypothèses et Limitations
  4. 4 Dynamique du Marché
    1. 4.1 Introduction
    2. 4.2 Facteurs de Croissance
      1. 4.2.1 Forte demande de barres d'acier dans l'industrie de la construction
      2. 4.2.2 Expansion du secteur de la construction dans les économies émergentes
    3. 4.3 Contraintes
      1. 4.3.1 Disponibilité d'alternatives efficaces aux barres d'acier
    4. 4.4 Opportunités
      1. 4.4.1 Le développement de la technologie a créé de nouvelles opportunités
      2. 4.4.2 Augmentation des initiatives gouvernementales
    5. 4.5 Défis
      1. 4.5.1 Un manque de connaissances combiné à un nombre insuffisant de personnes qualifiées
  5. 5 Analyse des Facteurs du Marché
    1. 5.1 Analyse de la Chaîne de Valeur
      1. 5.1.1 Matières Premières et Fournisseurs
      2. 5.1.2 Fabricants
      3. 5.1.3 Canaux de Distribution et de Vente
      4. 5.1.4 UTILISATEURS FINAUX
    2. 5.2 Modèle des Cinq Forces de Porter
      1. 5.2.1 Pouvoir de Négociation des Fournisseurs
      2. 5.2.2 Pouvoir de Négociation des Acheteurs
      3. 5.2.3 Menace des Nouveaux Entrants
      4. 5.2.4 Menace des Substituts
      5. 5.2.5 Intensité de la Rivalité
    3. 5.3 Analyse des Prix
    4. 5.4 Impact de l'épidémie de coronavirus sur le marché mondial des barres d'acier
  6. 6 Marché mondial des barres d'acier, par Type
    1. 6.1 Introduction
    2. 6.2 Doux
    3. 6.3 Déformé
  7. 7 Marché mondial des barres d'acier, par Utilisation Finale
    1. 7.1 Introduction
    2. 7.2 Infrastructure
    3. 7.3 Résidentiel
    4. 7.4 Commercial
  8. 8 Marché mondial des barres d'acier, par Région
    1. 8.1 Introduction
    2. 8.2 Amérique du Nord
      1. 8.2.1 États-Unis
      2. 8.2.2 Canada
    3. 8.3 Europe
      1. 8.3.1 Allemagne
      2. 8.3.2 France
      3. 8.3.3 Royaume-Uni
      4. 8.3.4 Italie
      5. 8.3.5 Espagne
      6. 8.3.6 Russie
      7. 8.3.7 Pologne
      8. 8.3.8 Reste de l'Europe
    4. 8.4 Asie-Pacifique
      1. 8.4.1 Chine
      2. 8.4.2 Japon
      3. 8.4.3 Inde
      4. 8.4.4 Australie et Nouvelle-Zélande
      5. 8.4.5 Reste de l'Asie-Pacifique
    5. 8.5 Amérique Latine
      1. 8.5.1 Brésil
      2. 8.5.2 Argentine
      3. 8.5.3 Mexique
      4. 8.5.4 Reste de l'Amérique Latine
    6. 8.6 Moyen-Orient et Afrique
      1. 8.6.1 Turquie
      2. 8.6.2 Israël
      3. 8.6.3 Afrique du Sud
      4. 8.6.4 CCG
      5. 8.6.5 Reste du MEA
  9. 9 PAYSAGE CONCURRENTIEL
    1. 9.1 APERÇU CONCURRENTIEL
    2. 9.2 ÉVALUATION CONCURRENTIELLE
    3. 9.3 DÉVELOPPEMENTS CLÉS ET STRATÉGIES DE CROISSANCE
      1. 9.3.1 LANCEMENT DE NOUVEAUX PRODUITS/DÉPLOIEMENT DE SERVICES
      2. 9.3.2 FUSION ET ACQUISITION
      3. 9.3.3 Expansion et INVESTISSEMENT
  10. 10 PROFILS D'ENTREPRISES
    1. 10.1 ARCELORMITTAL
      1. 10.1.1 APERÇU DE L'ENTREPRISE
      2. 10.1.2 APERÇU FINANCIER
      3. 10.1.3 PRODUITS OFFERTS
      4. 10.1.4 DÉVELOPPEMENTS CLÉS
      5. 10.1.5 Analyse SWOT
      6. 10.1.6 STRATÉGIE CLÉ
    2. 10.2 NUCOR
      1. 10.2.1 APERÇU DE L'ENTREPRISE
      2. 10.2.2 APERÇU FINANCIER
      3. 10.2.3 PRODUITS OFFERTS
      4. 10.2.4 DÉVELOPPEMENTS CLÉS
      5. 10.2.5 Analyse SWOT
      6. 10.2.6 STRATÉGIE CLÉ
    3. 10.3 NIPPON STEEL CORPORATION
      1. 10.3.1 APERÇU DE L'ENTREPRISE
      2. 10.3.2 APERÇU FINANCIER
      3. 10.3.3 PRODUITS OFFERTS
      4. 10.3.4 DÉVELOPPEMENTS CLÉS
      5. 10.3.5 Analyse SWOT
      6. 10.3.6 STRATÉGIE CLÉ
    4. 10.4 NLMK
      1. 10.4.1 APERÇU DE L'ENTREPRISE
      2. 10.4.2 APERÇU FINANCIER
      3. 10.4.3 PRODUITS OFFERTS
      4. 10.4.4 DÉVELOPPEMENTS CLÉS
      5. 10.4.5 Analyse SWOT
      6. 10.4.6 STRATÉGIE CLÉ
    5. 10.5 TATA STEEL
      1. 10.5.1 APERÇU DE L'ENTREPRISE
      2. 10.5.2 APERÇU FINANCIER
      3. 10.5.3 PRODUITS OFFERTS
      4. 10.5.4 Analyse SWOT
      5. 10.5.5 STRATÉGIE CLÉ
    6. 10.6 JSW
      1. 10.6.1 APERÇU DE L'ENTREPRISE
      2. 10.6.2 APERÇU FINANCIER
      3. 10.6.3 PRODUITS OFFERTS
      4. 10.6.4 DÉVELOPPEMENTS CLÉS
      5. 10.6.5 Analyse SWOT
      6. 10.6.6 STRATÉGIE CLÉ
    7. 10.7 SHAGANG GROUP INC
      1. 10.7.1 APERÇU DE L'ENTREPRISE
      2. 10.7.2 PRODUITS OFFERTS
      3. 10.7.3 DÉVELOPPEMENTS CLÉS
      4. 10.7.4 Analyse SWOT
      5. 10.7.5 STRATÉGIE CLÉ
    8. 10.8 SAIL
      1. 10.8.1 APERÇU DE L'ENTREPRISE
      2. 10.8.2 APERÇU FINANCIER
      3. 10.8.3 PRODUITS OFFERTS
      4. 10.8.4 DÉVELOPPEMENTS CLÉS
      5. 10.8.5 Analyse SWOT
      6. 10.8.6 STRATÉGIE CLÉ
    9. 10.9 POSCO
      1. 10.9.1 APERÇU DE L'ENTREPRISE
      2. 10.9.2 APERÇU FINANCIER
      3. 10.9.3 PRODUITS OFFERTS
      4. 10.9.4 DÉVELOPPEMENTS CLÉS
      5. 10.9.5 Analyse SWOT
      6. 10.9.6 STRATÉGIE CLÉ
    10. 10.10 HBIS GROUP
      1. 10.10.1 APERÇU DE L'ENTREPRISE
      2. 10.10.2 APERÇU FINANCIER
      3. 10.10.3 PRODUITS OFFERTS
      4. 10.10.4 DÉVELOPPEMENTS CLÉS
      5. 10.10.5 Analyse SWOT
      6. 10.10.6 STRATÉGIE CLÉ
    11. 10.11 GERDAU S/A
      1. 10.11.1 APERÇU DE L'ENTREPRISE
      2. 10.11.2 APERÇU FINANCIER
      3. 10.11.3 PRODUITS OFFERTS
      4. 10.11.4 DÉVELOPPEMENTS CLÉS
      5. 10.11.5 Analyse SWOT
      6. 10.11.6 STRATÉGIE CLÉ
    12. 10.12 CMC
      1. 10.12.1 APERÇU DE L'ENTREPRISE
      2. 10.12.2 APERÇU FINANCIER
      3. 10.12.3 PRODUITS OFFERTS
      4. 10.12.4 Analyse SWOT
      5. 10.12.5 STRATÉGIE CLÉ
    13. 10.13 ACERINOX S.A.
      1. 10.13.1 APERÇU DE L'ENTREPRISE
      2. 10.13.2 APERÇU FINANCIER
      3. 10.13.3 PRODUITS OFFERTS
      4. 10.13.4 DÉVELOPPEMENTS CLÉS
      5. 10.13.5 Analyse SWOT
      6. 10.13.6 STRATÉGIE CLÉ
    14. 10.14 DAIDO STEEL CO LTD
      1. 10.14.1 APERÇU DE L'ENTREPRISE
      2. 10.14.2 APERÇU FINANCIER
      3. 10.14.3 PRODUITS OFFERTS
      4. 10.14.4 DÉVELOPPEMENTS CLÉS
      5. 10.14.5 Analyse SWOT
      6. 10.14.6 STRATÉGIE CLÉ
    15. 10.15 STEEL DYNAMICS, INC
      1. 10.15.1 APERÇU DE L'ENTREPRISE
      2. 10.15.2 APERÇU FINANCIER
      3. 10.15.3 PRODUITS OFFERTS
      4. 10.15.4 DÉVELOPPEMENTS CLÉS
      5. 10.15.5 Analyse SWOT
      6. 10.15.6 STRATÉGIE CLÉ
    16. LISTE DES TABLEAUX
    17. TABLEAU 1 SYNTHÈSE DU MARCHÉ
    18. TABLEAU 2 LISTE DES HYPOTHÈSES
    19. TABLEAU 3 MARCHÉ MONDIAL DES BARRES D'ACIER, PAR ANALYSE DES PRIX (USD/TONNE)
    20. TABLEAU 4 MARCHÉ MONDIAL DES BARRES D'ACIER, PAR TYPE, 2018-2030 (MILLIONS USD)
    21. TABLEAU 5 MARCHÉ MONDIAL DES BARRES D'ACIER, PAR TYPE, 2018-2030 (MILLIONS DE TONNES)
    22. TABLEAU 6 MARCHÉ MONDIAL DES BARRES D'ACIER, PAR UTILISATION FINALE, 2018-2030 (MILLIONS USD)
    23. TABLEAU 7 MARCHÉ MONDIAL DES BARRES D'ACIER, PAR TYPE, 2018-2030 (MILLIONS DE TONNES)
    24. TABLEAU 8 MARCHÉ MONDIAL DES BARRES D'ACIER, PAR RÉGION, 2018-2030 (MILLIONS USD)
    25. TABLEAU 9 MARCHÉ MONDIAL DES BARRES D'ACIER, PAR RÉGION, 2018-2030 (MILLIONS DE TONNES)
    26. TABLEAU 10 AMÉRIQUE DU NORD : MARCHÉ DES BARRES D'ACIER, PAR PAYS, 2018 À 2030 (MILLIONS USD)
    27. TABLEAU 11 AMÉRIQUE DU NORD : MARCHÉ DES BARRES D'ACIER, PAR PAYS, 2018 À 2030 (MILLIONS DE TONNES)
    28. TABLEAU 12 MARCHÉ DES BARRES D'ACIER EN AMÉRIQUE DU NORD, PAR TYPE, 2018-2030 (MILLIONS USD)
    29. TABLEAU 13 MARCHÉ DES BARRES D'ACIER EN AMÉRIQUE DU NORD, PAR TYPE, 2018-2030 (MILLIONS DE TONNES)
    30. TABLEAU 14 MARCHÉ DES BARRES D'ACIER EN AMÉRIQUE DU NORD, PAR UTILISATION FINALE, 2018-2030 (MILLIONS USD)
    31. TABLEAU 15 MARCHÉ DES BARRES D'ACIER EN AMÉRIQUE DU NORD, PAR TYPE, 2018-2030 (MILLIONS DE TONNES)
    32. TABLEAU 16 MARCHÉ DES BARRES D'ACIER AUX ÉTATS-UNIS, PAR TYPE, 2018-2030 (MILLIONS USD)
    33. TABLEAU 17 MARCHÉ DES BARRES D'ACIER AUX ÉTATS-UNIS, PAR TYPE, 2018-2030 (MILLIONS DE TONNES)
    34. TABLEAU 18 MARCHÉ MONDIAL DES BARRES D'ACIER, PAR UTILISATION FINALE, 2018-2030 (MILLIONS USD)
    35. TABLEAU 19 MARCHÉ DES BARRES D'ACIER AUX ÉTATS-UNIS, PAR TYPE, 2018-2030 (MILLIONS DE TONNES)
    36. TABLEAU 20 MARCHÉ MONDIAL DES BARRES D'ACIER, PAR TYPE, 2018-2030 (MILLIONS USD)
    37. TABLEAU 21 MARCHÉ DES BARRES D'ACIER AU CANADA, PAR TYPE, 2018-2030 (MILLIONS DE TONNES)
    38. TABLEAU 22 MARCHÉ DES BARRES D'ACIER AU CANADA, PAR UTILISATION FINALE, 2018-2030 (MILLIONS USD)
    39. TABLEAU 23 MARCHÉ DES BARRES D'ACIER AU CANADA, PAR TYPE, 2018-2030 (MILLIONS DE TONNES)
    40. TABLEAU 24 EUROPE : MARCHÉ DES BARRES D'ACIER, PAR PAYS, 2018 À 2030 (MILLIONS USD)
    41. TABLEAU 25 EUROPE : MARCHÉ DES BARRES D'ACIER, PAR PAYS, 2018 À 2030 (MILLIONS DE TONNES)
    42. TABLEAU 26 MARCHÉ DES BARRES D'ACIER EN EUROPE, PAR TYPE, 2018-2030 (MILLIONS USD)
    43. TABLEAU 27 MARCHÉ DES BARRES D'ACIER EN EUROPE, PAR TYPE, 2018-2030 (MILLIONS DE TONNES)
    44. TABLEAU 28 MARCHÉ DES BARRES D'ACIER EN EUROPE, PAR UTILISATION FINALE, 2018-2030 (MILLIONS USD)
    45. TABLEAU 29 MARCHÉ DES BARRES D'ACIER EN EUROPE, PAR TYPE, 2018-2030 (MILLIONS DE TONNES)
    46. TABLEAU 30 MARCHÉ DES BARRES D'ACIER EN ALLEMAGNE, PAR TYPE, 2018-2030 (MILLIONS USD)
    47. TABLEAU 31 MARCHÉ DES BARRES D'ACIER EN FRANCE, PAR TYPE, 2018-2030 (MILLIONS DE TONNES)
    48. TABLEAU 32 MARCHÉ DES BARRES D'ACIER EN FRANCE, PAR UTILISATION FINALE, 2018-2030 (MILLIONS USD)
    49. TABLEAU 33 MARCHÉ DES BARRES D'ACIER EN FRANCE, PAR TYPE, 2018-2030 (MILLIONS DE TONNES)
    50. TABLEAU 34 MARCHÉ DES BARRES D'ACIER EN FRANCE, PAR TYPE, 2018-2030 (MILLIONS USD)
    51. TABLEAU 35 MARCHÉ DES BARRES D'ACIER EN FRANCE, PAR TYPE, 2018-2030 (MILLIONS DE TONNES)
    52. TABLEAU 36 MARCHÉ DES BARRES D'ACIER EN FRANCE, PAR UTILISATION FINALE, 2018-2030 (MILLIONS USD)
    53. TABLEAU 37 MARCHÉ DES BARRES D'ACIER EN FRANCE, PAR TYPE, 2018-2030 (MILLIONS DE TONNES)
    54. TABLEAU 38 MARCHÉ DES BARRES D'ACIER AU ROYAUME-UNI, PAR TYPE, 2018-2030 (MILLIONS USD)
    55. TABLEAU 39 MARCHÉ DES BARRES D'ACIER AU ROYAUME-UNI, PAR TYPE, 2018-2030 (MILLIONS DE TONNES)
    56. TABLEAU 40 MARCHÉ DES BARRES D'ACIER AU ROYAUME-UNI, PAR UTILISATION FINALE, 2018-2030 (MILLIONS USD)
    57. TABLEAU 41 MARCHÉ DES BARRES D'ACIER AU ROYAUME-UNI, PAR TYPE, 2018-2030 (MILLIONS DE TONNES)
    58. TABLEAU 42 MARCHÉ DES BARRES D'ACIER EN ITALIE, PAR TYPE, 2018-2030 (MILLIONS USD)
    59. TABLEAU 43 MARCHÉ DES BARRES D'ACIER EN ITALIE, PAR TYPE, 2018-2030 (MILLIONS DE TONNES)
    60. TABLEAU 44 MARCHÉ DES BARRES D'ACIER EN ITALIE, PAR UTILISATION FINALE, 2018-2030 (MILLIONS USD)
    61. TABLEAU 45 MARCHÉ DES BARRES D'ACIER EN ITALIE, PAR TYPE, 2018-2030 (MILLIONS DE TONNES)
    62. TABLEAU 46 MARCHÉ DES BARRES D'ACIER EN ESPAGNE, PAR TYPE, 2018-2030 (MILLIONS USD)
    63. TABLEAU 47 MARCHÉ DES BARRES D'ACIER EN ESPAGNE, PAR TYPE, 2018-2030 (MILLIONS DE TONNES)
    64. TABLEAU 48 MARCHÉ DES BARRES D'ACIER EN ESPAGNE, PAR UTILISATION FINALE, 2018-2030 (MILLIONS USD)
    65. TABLEAU 49 MARCHÉ DES BARRES D'ACIER EN ESPAGNE, PAR TYPE, 2018-2030 (MILLIONS DE TONNES)
    66. TABLEAU 50 MARCHÉ DES BARRES D'ACIER EN RUSSIE, PAR TYPE, 2018-2030 (MILLIONS USD)
    67. TABLEAU 51 MARCHÉ DES BARRES D'ACIER EN RUSSIE, PAR TYPE, 2018-2030 (MILLIONS DE TONNES)
    68. TABLEAU 52 MARCHÉ DES BARRES D'ACIER EN RUSSIE, PAR UTILISATION FINALE, 2018-2030 (MILLIONS USD)
    69. TABLEAU 53 MARCHÉ DES BARRES D'ACIER EN RUSSIE, PAR TYPE, 2018-2030 (MILLIONS DE TONNES)
    70. TABLEAU 54 MARCHÉ DES BARRES D'ACIER EN POLOGNE, PAR TYPE, 2018-2030 (MILLIONS USD)
    71. TABLEAU 55 MARCHÉ DES BARRES D'ACIER EN POLOGNE, PAR TYPE, 2018-2030 (MILLIONS DE TONNES)
    72. TABLEAU 56 MARCHÉ DES BARRES D'ACIER EN POLOGNE, PAR UTILISATION FINALE, 2018-2030 (MILLIONS USD)
    73. TABLEAU 57 MARCHÉ DES BARRES D'ACIER EN POLOGNE, PAR TYPE, 2018-2030 (MILLIONS DE TONNES)
    74. TABLEAU 58 MARCHÉ DES BARRES D'ACIER DANS LE RESTE DE L'EUROPE, PAR TYPE, 2018-2030 (MILLIONS USD)
    75. TABLEAU 59 MARCHÉ DES BARRES D'ACIER DANS LE RESTE DE L'EUROPE, PAR TYPE, 2018-2030 (MILLIONS DE TONNES)
    76. TABLEAU 60 MARCHÉ DES BARRES D'ACIER DANS LE RESTE DE L'EUROPE, PAR UTILISATION FINALE, 2018-2030 (MILLIONS USD)
    77. TABLEAU 61 MARCHÉ DES BARRES D'ACIER DANS LE RESTE DE L'EUROPE, PAR TYPE, 2018-2030 (MILLIONS DE TONNES)
    78. TABLEAU 62 ASIE-PACIFIQUE : MARCHÉ DES BARRES D'ACIER, PAR PAYS, 2018 À 2030 (MILLIONS USD)
    79. TABLEAU 63 MARCHÉ DES BARRES D'ACIER EN ASIE-PACIFIQUE, PAR PAYS, 2018 À 2030 (MILLIONS DE TONNES)
    80. TABLEAU 64 MARCHÉ DES BARRES D'ACIER EN ASIE-PACIFIQUE, PAR TYPE, 2018-2030 (MILLIONS USD)
    81. TABLEAU 65 MARCHÉ DES BARRES D'ACIER EN ASIE-PACIFIQUE, PAR TYPE, 2018-2030 (MILLIONS DE TONNES)
    82. TABLEAU 66 MARCHÉ DES BARRES D'ACIER EN ASIE-PACIFIQUE, PAR UTILISATION FINALE, 2018-2030 (MILLIONS USD)
    83. TABLEAU 67 MARCHÉ DES BARRES D'ACIER EN ASIE-PACIFIQUE, PAR TYPE, 2018-2030 (MILLIONS DE TONNES)
    84. TABLEAU 68 MARCHÉ DES BARRES D'ACIER EN CHINE, PAR TYPE, 2018-2030 (MILLIONS USD)
    85. TABLEAU 69 MARCHÉ DES BARRES D'ACIER EN CHINE, PAR TYPE, 2018-2030 (MILLIONS DE TONNES)
    86. TABLEAU 70 MARCHÉ DES BARRES D'ACIER EN CHINE, PAR UTILISATION FINALE, 2018-2030 (MILLIONS USD)
    87. TABLEAU 71 MARCHÉ DES BARRES D'ACIER EN CHINE, PAR TYPE, 2018-2030 (MILLIONS DE TONNES)
    88. TABLEAU 72 MARCHÉ DES BARRES D'ACIER AU JAPON, PAR TYPE, 2018-2030 (MILLIONS USD)
    89. TABLEAU 73 MARCHÉ DES BARRES D'ACIER AU JAPON, PAR TYPE, 2018-2030 (MILLIONS DE TONNES)
    90. TABLEAU 74 MARCHÉ DES BARRES D'ACIER AU JAPON, PAR UTILISATION FINALE, 2018-2030 (MILLIONS USD)
    91. TABLEAU 75 MARCHÉ DES BARRES D'ACIER AU JAPON, PAR TYPE, 2018-2030 (MILLIONS DE TONNES)
    92. TABLEAU 76 MARCHÉ DES BARRES D'ACIER EN INDE, PAR TYPE, 2018-2030 (MILLIONS USD)
    93. TABLEAU 77 MARCHÉ DES BARRES D'ACIER EN INDE, PAR TYPE, 2018-2030 (MILLIONS DE TONNES)
    94. TABLEAU 78 MARCHÉ DES BARRES D'ACIER EN INDE, PAR UTILISATION FINALE, 2018-2030 (MILLIONS USD)
    95. TABLEAU 79 MARCHÉ DES BARRES D'ACIER EN INDE, PAR TYPE, 2018-2030 (MILLIONS DE TONNES)
    96. TABLEAU 80 MARCHÉ DES BARRES D'ACIER EN AUSTRALIE ET NOUVELLE-ZÉLANDE, PAR TYPE, 2018-2030 (MILLIONS USD)
    97. TABLEAU 81 MARCHÉ DES BARRES D'ACIER EN AUSTRALIE ET NOUVELLE-ZÉLANDE, PAR TYPE, 2018-2030 (MILLIONS DE TONNES)
    98. TABLEAU 82 MARCHÉ DES BARRES D'ACIER EN AUSTRALIE ET NOUVELLE-ZÉLANDE, PAR UTILISATION FINALE, 2018-2030 (MILLIONS USD)
    99. TABLEAU 83 MARCHÉ DES BARRES D'ACIER EN AUSTRALIE ET NOUVELLE-ZÉLANDE, PAR TYPE, 2018-2030 (MILLIONS DE TONNES)
    100. TABLEAU 84 MARCHÉ DES BARRES D'ACIER DANS LE RESTE DE L'ASIE-PACIFIQUE, PAR TYPE, 2018-2030 (MILLIONS USD)
    101. TABLEAU 85 MARCHÉ DES BARRES D'ACIER DANS LE RESTE DE L'ASIE-PACIFIQUE, PAR TYPE, 2018-2030 (MILLIONS DE TONNES)
    102. TABLEAU 86 MARCHÉ DES BARRES D'ACIER DANS LE RESTE DE L'ASIE-PACIFIQUE, PAR UTILISATION FINALE, 2018-2030 (MILLIONS USD)
    103. TABLEAU 87 MARCHÉ DES BARRES D'ACIER DANS LE RESTE DE L'ASIE-PACIFIQUE, PAR TYPE, 2018-2030 (MILLIONS DE TONNES)
    104. TABLEAU 88 AMÉRIQUE LATINE : MARCHÉ DES BARRES D'ACIER, PAR PAYS, 2018 À 2030 (MILLIONS USD)
    105. TABLEAU 89 AMÉRIQUE LATINE : MARCHÉ DES BARRES D'ACIER, PAR PAYS, 2018 À 2030 (MILLIONS DE TONNES)
    106. TABLEAU 90 MARCHÉ DES BARRES D'ACIER EN AMÉRIQUE LATINE, PAR TYPE, 2018-2030 (MILLIONS USD)
    107. TABLEAU 91 MARCHÉ DES BARRES D'ACIER EN AMÉRIQUE LATINE, PAR TYPE, 2018-2030 (MILLIONS DE TONNES)
    108. TABLEAU 92 MARCHÉ DES BARRES D'ACIER EN AMÉRIQUE LATINE, PAR UTILISATION FINALE, 2018-2030 (MILLIONS USD)
    109. TABLEAU 93 MARCHÉ DES BARRES D'ACIER EN AMÉRIQUE LATINE, PAR TYPE, 2018-2030 (MILLIONS DE TONNES)
    110. TABLEAU 94 MARCHÉ DES BARRES D'ACIER AU BRÉSIL, PAR TYPE, 2018-2030 (MILLIONS USD)
    111. TABLEAU 95 MARCHÉ DES BARRES D'ACIER AU BRÉSIL, PAR TYPE, 2018-2030 (MILLIONS DE TONNES)
    112. TABLEAU 96 MARCHÉ DES BARRES D'ACIER AU BRÉSIL, PAR UTILISATION FINALE, 2018-2030 (MILLIONS USD)
    113. TABLEAU 97 MARCHÉ DES BARRES D'ACIER AU BRÉSIL, PAR TYPE, 2018-2030 (MILLIONS DE TONNES)
    114. TABLEAU 98 MARCHÉ DES BARRES D'ACIER EN ARGENTINE, PAR TYPE, 2018-2030 (MILLIONS USD)
    115. TABLEAU 99 MARCHÉ DES BARRES D'ACIER EN ARGENTINE, PAR TYPE, 2018-2030 (MILLIONS DE TONNES)

Segmentation du marché des barres d'armature en acier

Barres d'armature en acier Perspectives de type (millions USD, 2019-2030)
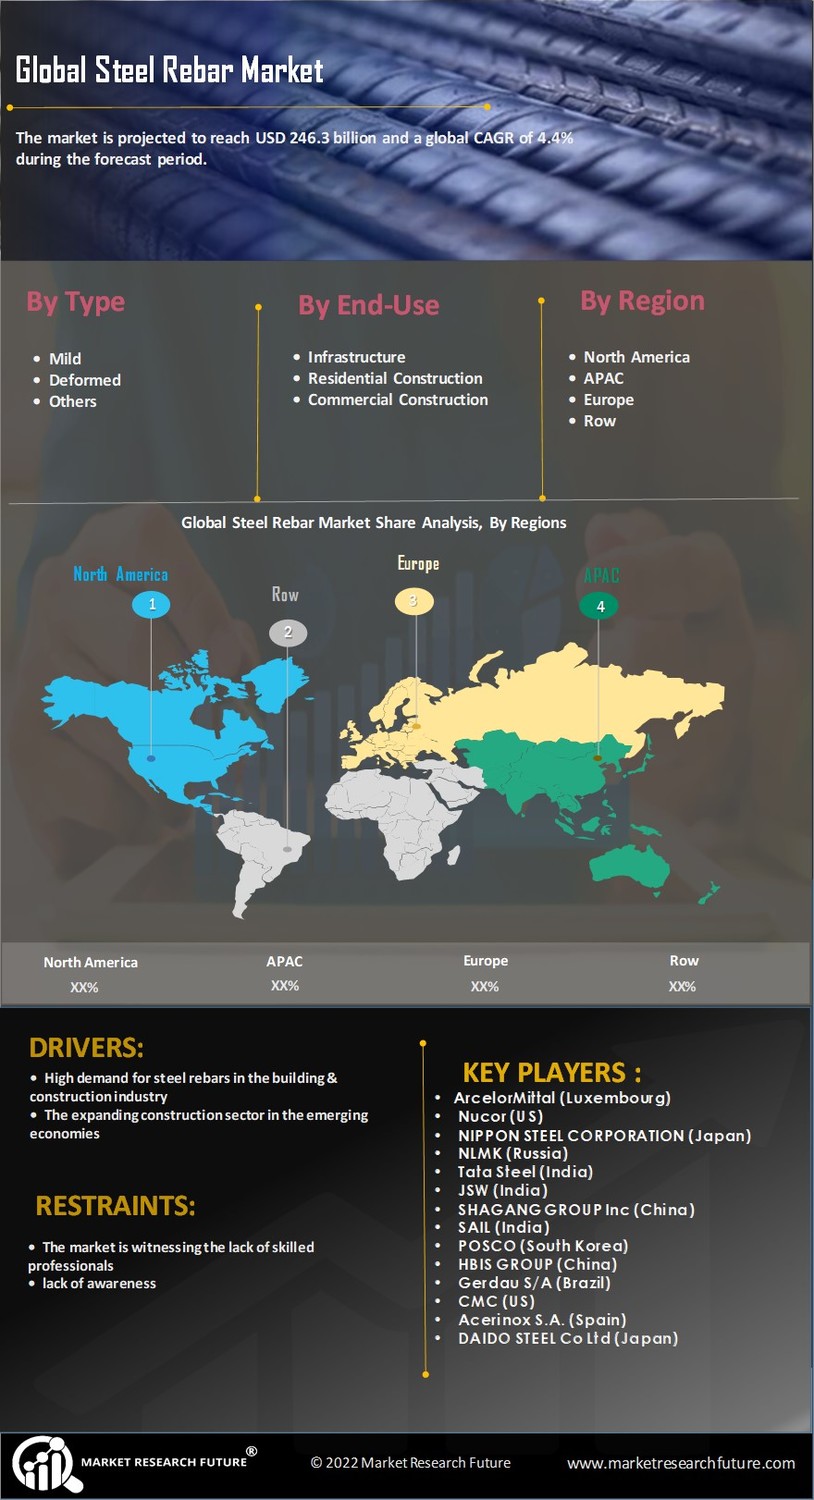
  • Doux
  • Déformé

Perspectives d'utilisation finale des barres d'armature en acier (millions USD, 2019-2030)

  • Infrastructures
  • Résidentiel
  • Commercial

Perspectives régionales des barres d'armature en acier (millions USD, 2019-2030)

  • Perspectives de l'Amérique du Nord (en millions de dollars, 2019-2030)
    • Barres d'armature en acier d'Amérique du Nord par type
      • Doux
      • Déformé
    • Barres d'armature en acier d'Amérique du Nord par utilisation finale
      • Infrastructures
      • Résidentiel
      • Commercial
    • Perspectives américaines (en millions de dollars, 2019-2030)
    • Barres d'armature en acier américaines par type
      • Doux
      • Déformé
    • Barres d'armature en acier américaines par utilisation finale
      • Infrastructures
      • Résidentiel
      • Commercial
    • Canada Perspectives (en millions de dollars américains, 2019-2030)
    • Barres d'armature en acier du Canada par type
      • Doux
      • Déformé
    • Barres d'armature en acier Canada par utilisation finale
      • Infrastructures
      • Résidentiel
      • Commercial
    • Perspectives européennes (en millions de dollars, 2019-2030)
      • Barres d'armature en acier européennes par type
        • Doux
        • Déformé
      • Barres d'armature en acier européennes par utilisation finale
        • Infrastructures
        • Résidentiel
        • Commercial
      • Allemagne Perspectives (en millions de dollars, 2019-2030)
      • Barres d'armature en acier en Allemagne par type
        • Doux
        • Déformé
      • Barres d'armature en acier en Allemagne par utilisation finale
        • Infrastructures
        • Résidentiel
        • Commercial
      • France Perspectives (en millions de dollars, 2019-2030)
      • Barres d'armature en acier France par type
        • Doux
        • Déformé
      • Barres d'armature en acier France par utilisation finale
        • Infrastructures
        • Résidentiel
        • Commercial
      • Royaume-Uni Perspectives (millions USD, 2019-2030)
      • Barres d'armature en acier au Royaume-Uni par type
        • Doux
        • Déformé
      • Barres d'armature en acier au Royaume-Uni par utilisation finale
        • Infrastructures
        • Résidentiel
        • Commercial
      • Italie Perspectives (en millions de dollars, 2019-2030)
      • Barres d'armature en acier en Italie par type
        • Doux
        • Déformé
      • Barres d'armature en acier en Italie par utilisation finale
        • Infrastructures
        • Résidentiel
        • Commercial
      • Perspectives de l'Espagne (en millions de dollars, 2019-2030)
      • Barres d'armature en acier d'Espagne par type
        • Doux
        • Déformé
      • Barres d'armature en acier d'Espagne par utilisation finale
        • Infrastructures
        • Résidentiel
        • Commercial
      • Russie Perspectives (en millions de dollars, 2019-2030)
      • Barres d'armature en acier de Russie par type
        • Doux
        • Déformé
      • Barres d'armature en acier russe par utilisation finale
        • Infrastructures
        • Résidentiel
        • Commercial
      • Pologne Perspectives (millions USD, 2019-2030)
      • Barres d'armature en acier de Pologne par type
        • Doux
        • Déformé
      • Barres d'armature en acier de Pologne par utilisation finale
        • Infrastructures
        • Résidentiel
        • Commercial
      • Reste de l'Europe Perspectives (millions USD, 2019-2030)
      • Barres d'armature en acier pour le reste de l'Europe, par type
        • Doux
        • Déformé
      • Barres d'armature en acier pour le reste de l'Europe, par utilisation finale
        • Infrastructures
        • Résidentiel
        • Commercial
      • Perspectives Asie-Pacifique (millions USD, 2019-2030)
        • Barres d'armature en acier Asie-Pacifique par type
          • Doux
          • Déformé
        • Barres d'armature en acier Asie-Pacifique par utilisation finale
          • Infrastructures
          • Résidentiel
          • Commercial
        • Chine Perspectives (millions USD, 2019-2030)
        • Barres d'armature en acier de Chine par type
          • Doux
          • Déformé
        • Barres d'armature en acier de Chine par utilisation finale
          • Infrastructures
          • Résidentiel
          • Commercial
        • Japon Perspectives (millions USD, 2019-2030)
        • Barres d'armature en acier japonaises par type
          • Doux
          • Déformé
        • Barres d'armature en acier japonaises par utilisation finale
          • Infrastructures
          • Résidentiel
          • Commercial
        • Inde Perspectives (millions USD, 2019-2030)
        • Barres d'armature en acier en Inde par type
          • Doux
          • Déformé
        • Barres d'armature en acier en Inde par utilisation finale
          • Infrastructures
          • Résidentiel
          • Commercial
        • Australie et Nouvelle-Zélande Perspectives (millions USD, 2019-2030)
        • Barres d'armature en acier d'Australie et de Nouvelle-Zélande par type
          • Doux
          • Déformé
        • Barres d'armature en acier d'Australie et de Nouvelle-Zélande par utilisation finale
          • Infrastructures
          • Résidentiel
          • Commercial
        • Reste de Perspectives de l'Asie-Pacifique (en millions de dollars, 2019-2030)
        • Rebares en acier pour le reste de la région Asie-Pacifique, par type
          • Doux
          • Déformé
        • Reste des Barres d'armature en acier Asie-Pacifique par utilisation finale
          • Infrastructures
          • Résidentiel
          • Commercial
        • Perspectives de l'Amérique latine (en millions de dollars, 2019-2030)
          • Barres d'armature en acier d'Amérique latine par type
            • Doux
            • Déformé
          • Barres d'armature en acier d'Amérique latine par utilisation finale
            • Infrastructures
            • Résidentiel
            • Commercial
          • Brésil Perspectives (millions USD, 2019-2030)
          • Barres d'armature en acier brésilien par type
            • Doux
            • Déformé
          • Barres d'armature en acier du Brésil par utilisation finale
            • Infrastructures
            • Résidentiel
            • Commercial
          • Argentine Perspectives (millions USD, 2019-2030)
          • Barres d'armature en acier d'Argentine par type
            • Doux
            • Déformé
          • Barres d'armature en acier d'Argentine par utilisation finale
            • Infrastructures
            • Résidentiel
            • Commercial
          • Mexique Perspectives (millions USD, 2019-2030)
          • Barres d'armature en acier du Mexique par type
            • Doux
            • Déformé
          • Barres d'armature en acier du Mexique par utilisation finale
            • Infrastructures
            • Résidentiel
            • Commercial
          • Reste de l'Amérique latine Perspectives (millions USD, 2019-2030)
          • Barres d'armature en acier pour le reste de l'Amérique latine, par type
            • Doux
            • Déformé
          • Barres d'armature en acier pour le reste de l'Amérique latine, par utilisation finale
            • Infrastructures
            • Résidentiel
            • Commercial
          • Moyen-Orient etamp; Perspectives de l'Afrique (millions USD, 2019-2030)
            • Moyen-Orient etamp; Barres d'armature en acier d'Afrique par type
              • Doux
              • Déformé
            • Moyen-Orient etamp; Barres d'armature en acier d'Afrique par utilisation finale
              • Infrastructures
              • Résidentiel
              • Commercial
            • Turquie Perspectives (millions USD, 2019-2030)
            • Barres d'armature en acier de Turquie par type
              • Doux
              • Déformé
            • Barres d'armature en acier de Turquie par utilisation finale
              • Infrastructures
              • Résidentiel
              • Commercial
            • Israël Perspectives (millions USD, 2019-2030)
            • Barres d'armature en acier israélien par type
              • Doux
              • Déformé
            • Barres d'armature en acier israélien par utilisation finale
              • Infrastructures
              • Résidentiel
              • Commercial
            • Afrique du Sud Perspectives (millions USD, 2019-2030)
            • Barres d'armature en acier d'Afrique du Sud par type
              • Doux
              • Déformé
            • Barres d'armature en acier d'Afrique du Sud par utilisation finale
              • Infrastructures
              • Résidentiel
              • Commercial
            • CCG Perspectives (millions USD, 2019-2030)
            • Barres d'armature en acier GCC par type
              • Doux
              • Déformé
            • Barres d'armature en acier GCC par utilisation finale
              • Infrastructures
              • Résidentiel
              • Commercial
            • Reste du Moyen-Orient et du Moyen-Orient Afrique Perspectives (millions USD, 2019-2030)
            • Reste du Moyen-Orient et du Moyen-Orient Barres d'armature en acier d'Afrique par type
              • Doux
              • Déformé
            • Reste du Moyen-Orient et du Moyen-Orient Barres d'armature en acier d'Afrique par utilisation finale
              • Infrastructures
              • Résidentiel
              • Commercial


Compare Licence

×
Features License Type
Single User Multiuser License Enterprise User
Price $4,950 $5,950 $7,250
Maximum User Access Limit 1 User Upto 10 Users Unrestricted Access Throughout the Organization
Free Customization
Direct Access to Analyst
Deliverable Format
Platform Access
Discount on Next Purchase 10% 15% 15%
Printable Versions