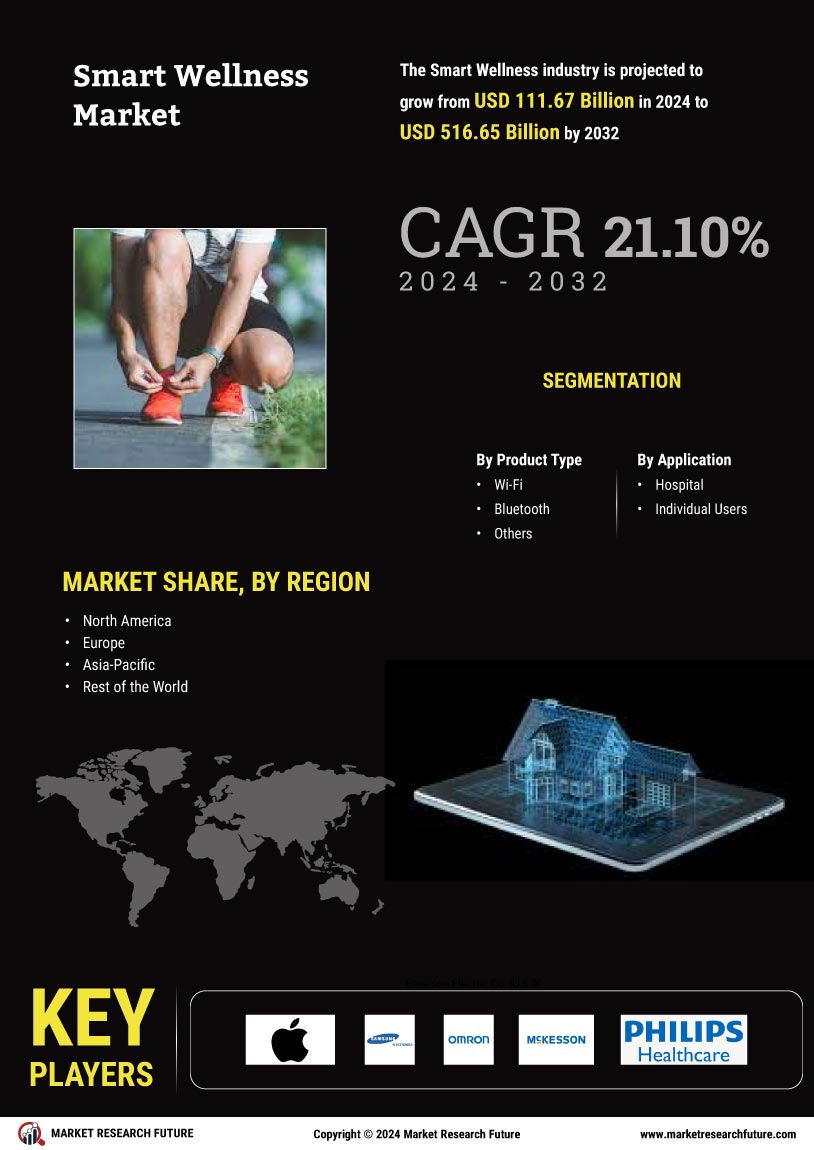
Request Free Sample ×

Kindly complete the form below to receive a free sample of this Report

* Please use a valid business email

Leading companies partner with us for data-driven Insights

clients tt-cursor
Hero Background

MarchĂ© du Bien-Être Intelligent

ID: MRFR/SEM/3070-CR
100 Pages
Aarti Dhapte
Last Updated: April 02, 2026

Rapport d'Ă©tude de marchĂ© sur le bien-ĂȘtre intelligent Informations par application (hĂŽpital et utilisateurs individuels), par type de produit (Wi-Fi, Bluetooth et autres), et par rĂ©gion (AmĂ©rique du Nord, Europe, Asie-Pacifique et reste du monde) – PrĂ©visions de marchĂ© jusqu'en 2035

Partager
Download PDF ×

We do not share your information with anyone. However, we may send you emails based on your report interest from time to time. You may contact us at any time to opt-out.

Smart Wellness Market Infographic
Purchase Options
  1. SECTION I : RÉSUMÉ EXÉCUTIF ET POINTS CLÉS
    1. 1.1 RÉSUMÉ EXÉCUTIF
      1. 1.1.1 Aperçu du marché
      2. 1.1.2 Conclusions clés
      3. 1.1.3 Segmentation du marché
      4. 1.1.4 Paysage concurrentiel
      5. 1.1.5 Défis et opportunités
      6. 1.1.6 Perspectives futures 2
  2. SECTION II : DÉLIMITATION, MÉTHODOLOGIE ET STRUCTURE DU MARCHÉ
    1. 2.1 INTRODUCTION AU MARCHÉ
      1. 2.1.1 Définition
      2. 2.1.2 Portée de l'étude
        1. 2.1.2.1 Objectif de recherche
        2. 2.1.2.2 HypothĂšse
        3. 2.1.2.3 Limitations
    2. 2.2 MÉTHODOLOGIE DE RECHERCHE
      1. 2.2.1 Aperçu
      2. 2.2.2 Exploration de données
      3. 2.2.3 Recherche secondaire
      4. 2.2.4 Recherche primaire
        1. 2.2.4.1 Interviews primaires et processus de collecte d'informations
        2. 2.2.4.2 Répartition des répondants principaux
      5. 2.2.5 ModÚle de prévision
      6. 2.2.6 Estimation de la taille du marché
        1. 2.2.6.1 Approche ascendante
        2. 2.2.6.2 Approche descendante
      7. 2.2.7 Triangulation des données
      8. 2.2.8 Validation 3
  3. SECTION III : ANALYSE QUALITATIVE
    1. 3.1 DYNAMIQUE DU MARCHÉ
      1. 3.1.1 Aperçu
      2. 3.1.2 Facteurs moteurs
      3. 3.1.3 Contraintes
      4. 3.1.4 Opportunités
    2. 3.2 ANALYSE DES FACTEURS DU MARCHÉ
      1. 3.2.1 Analyse de la chaĂźne de valeur
      2. 3.2.2 Analyse des Cinq Forces de Porter
        1. 3.2.2.1 Pouvoir de négociation des fournisseurs
        2. 3.2.2.2 Pouvoir de négociation des acheteurs
        3. 3.2.2.3 Menace des nouveaux entrants
        4. 3.2.2.4 Menace des substituts
        5. 3.2.2.5 Intensité de la rivalité
      3. 3.2.3 Analyse de l'impact du COVID-19
        1. 3.2.3.1 Analyse de l'impact sur le marché
        2. 3.2.3.2 Impact régional
        3. 3.2.3.3 Analyse des opportunités et des menaces 4
  4. SECTION IV : ANALYSE QUANTITATIVE
    1. 4.1 Semi-conducteurs et Électronique, PAR Application (milliards USD)
      1. 4.1.1 HĂŽpital
      2. 4.1.2 Utilisateurs individuels
    2. 4.2 Semi-conducteurs et Électronique, PAR Type de produit (milliards USD)
      1. 4.2.1 Wi-Fi
      2. 4.2.2 Bluetooth
      3. 4.2.3 Autres
    3. 4.3 Semi-conducteurs et Électronique, PAR RĂ©gion (milliards USD)
      1. 4.3.1 Amérique du Nord
        1. 4.3.1.1 États-Unis
        2. 4.3.1.2 Canada
      2. 4.3.2 Europe
        1. 4.3.2.1 Allemagne
        2. 4.3.2.2 Royaume-Uni
        3. 4.3.2.3 France
        4. 4.3.2.4 Russie
        5. 4.3.2.5 Italie
        6. 4.3.2.6 Espagne
        7. 4.3.2.7 Reste de l'Europe
      3. 4.3.3 APAC
        1. 4.3.3.1 Chine
        2. 4.3.3.2 Inde
        3. 4.3.3.3 Japon
        4. 4.3.3.4 Corée du Sud
        5. 4.3.3.5 Malaisie
        6. 4.3.3.6 ThaĂŻlande
        7. 4.3.3.7 Indonésie
        8. 4.3.3.8 Reste de l'APAC
      4. 4.3.4 Amérique du Sud
        1. 4.3.4.1 Brésil
        2. 4.3.4.2 Mexique
        3. 4.3.4.3 Argentine
        4. 4.3.4.4 Reste de l'Amérique du Sud
      5. 4.3.5 MEA
        1. 4.3.5.1 Pays du CCG
        2. 4.3.5.2 Afrique du Sud
        3. 4.3.5.3 Reste de la MEA 5
  5. SECTION V : ANALYSE CONCURRENTIELLE
    1. 5.1 Paysage concurrentiel
      1. 5.1.1 Aperçu
      2. 5.1.2 Analyse concurrentielle
      3. 5.1.3 Analyse de la part de marché
      4. 5.1.4 StratĂ©gie de croissance majeure dans les Semi-conducteurs et Électronique
      5. 5.1.5 Évaluation comparative
      6. 5.1.6 Acteurs principaux en termes de nombre de dĂ©veloppements dans les Semi-conducteurs et Électronique
      7. 5.1.7 Développements clés et stratégies de croissance
        1. 5.1.7.1 Lancement de nouveaux produits/Déploiement de services
        2. 5.1.7.2 Fusions et acquisitions
        3. 5.1.7.3 Coentreprises
      8. 5.1.8 Matrice financiĂšre des principaux acteurs
        1. 5.1.8.1 Ventes et revenu d'exploitation
        2. 5.1.8.2 Dépenses de R&D des principaux acteurs. 2023
    2. 5.2 Profils d'entreprise
      1. 5.2.1 Apple Inc (États-Unis)
        1. 5.2.1.1 Aperçu financier
        2. 5.2.1.2 Produits offerts
        3. 5.2.1.3 Développements clés
        4. 5.2.1.4 Analyse SWOT
        5. 5.2.1.5 Stratégies clés
      2. 5.2.2 Samsung Electronics (Corée du Sud)
        1. 5.2.2.1 Aperçu financier
        2. 5.2.2.2 Produits offerts
        3. 5.2.2.3 Développements clés
        4. 5.2.2.4 Analyse SWOT
        5. 5.2.2.5 Stratégies clés
      3. 5.2.3 Fitbit Inc (États-Unis)
        1. 5.2.3.1 Aperçu financier
        2. 5.2.3.2 Produits offerts
        3. 5.2.3.3 Développements clés
        4. 5.2.3.4 Analyse SWOT
        5. 5.2.3.5 Stratégies clés
      4. 5.2.4 Garmin Ltd (États-Unis)
        1. 5.2.4.1 Aperçu financier
        2. 5.2.4.2 Produits offerts
        3. 5.2.4.3 Développements clés
        4. 5.2.4.4 Analyse SWOT
        5. 5.2.4.5 Stratégies clés
      5. 5.2.5 Philips Healthcare (Pays-Bas)
        1. 5.2.5.1 Aperçu financier
        2. 5.2.5.2 Produits offerts
        3. 5.2.5.3 Développements clés
        4. 5.2.5.4 Analyse SWOT
        5. 5.2.5.5 Stratégies clés
      6. 5.2.6 Xiaomi Corporation (Chine)
        1. 5.2.6.1 Aperçu financier
        2. 5.2.6.2 Produits offerts
        3. 5.2.6.3 Développements clés
        4. 5.2.6.4 Analyse SWOT
        5. 5.2.6.5 Stratégies clés
      7. 5.2.7 Withings (France)
        1. 5.2.7.1 Aperçu financier
        2. 5.2.7.2 Produits offerts
        3. 5.2.7.3 Développements clés
        4. 5.2.7.4 Analyse SWOT
        5. 5.2.7.5 Stratégies clés
      8. 5.2.8 Omron Corporation (Japon)
        1. 5.2.8.1 Aperçu financier
        2. 5.2.8.2 Produits offerts
        3. 5.2.8.3 Développements clés
        4. 5.2.8.4 Analyse SWOT
        5. 5.2.8.5 Stratégies clés
      9. 5.2.9 Huawei Technologies (Chine)
        1. 5.2.9.1 Aperçu financier
        2. 5.2.9.2 Produits offerts
        3. 5.2.9.3 Développements clés
        4. 5.2.9.4 Analyse SWOT
        5. 5.2.9.5 Stratégies clés
    3. 5.3 Annexe
      1. 5.3.1 Références
      2. 5.3.2 Rapports connexes 6 LISTE DES FIGURES
    4. 6.1 SYNOPSIS DU MARCHÉ
    5. 6.2 ANALYSE DU MARCHÉ EN AMÉRIQUE DU NORD
    6. 6.3 ANALYSE DU MARCHÉ AUX ÉTATS-UNIS PAR APPLICATION
    7. 6.4 ANALYSE DU MARCHÉ AUX ÉTATS-UNIS PAR TYPE DE PRODUIT
    8. 6.5 ANALYSE DU MARCHÉ AU CANADA PAR APPLICATION
    9. 6.6 ANALYSE DU MARCHÉ AU CANADA PAR TYPE DE PRODUIT
    10. 6.7 ANALYSE DU MARCHÉ EN EUROPE
    11. 6.8 ANALYSE DU MARCHÉ EN ALLEMAGNE PAR APPLICATION
    12. 6.9 ANALYSE DU MARCHÉ EN ALLEMAGNE PAR TYPE DE PRODUIT
    13. 6.10 ANALYSE DU MARCHÉ AU ROYAUME-UNI PAR APPLICATION
    14. 6.11 ANALYSE DU MARCHÉ AU ROYAUME-UNI PAR TYPE DE PRODUIT
    15. 6.12 ANALYSE DU MARCHÉ EN FRANCE PAR APPLICATION
    16. 6.13 ANALYSE DU MARCHÉ EN FRANCE PAR TYPE DE PRODUIT
    17. 6.14 ANALYSE DU MARCHÉ EN RUSSIE PAR APPLICATION
    18. 6.15 ANALYSE DU MARCHÉ EN RUSSIE PAR TYPE DE PRODUIT
    19. 6.16 ANALYSE DU MARCHÉ EN ITALIE PAR APPLICATION
    20. 6.17 ANALYSE DU MARCHÉ EN ITALIE PAR TYPE DE PRODUIT
    21. 6.18 ANALYSE DU MARCHÉ EN ESPAGNE PAR APPLICATION
    22. 6.19 ANALYSE DU MARCHÉ EN ESPAGNE PAR TYPE DE PRODUIT
    23. 6.20 ANALYSE DU MARCHÉ DANS LE RESTE DE L'EUROPE PAR APPLICATION
    24. 6.21 ANALYSE DU MARCHÉ DANS LE RESTE DE L'EUROPE PAR TYPE DE PRODUIT
    25. 6.22 ANALYSE DU MARCHÉ EN APAC
    26. 6.23 ANALYSE DU MARCHÉ EN CHINE PAR APPLICATION
    27. 6.24 ANALYSE DU MARCHÉ EN CHINE PAR TYPE DE PRODUIT
    28. 6.25 ANALYSE DU MARCHÉ EN INDE PAR APPLICATION
    29. 6.26 ANALYSE DU MARCHÉ EN INDE PAR TYPE DE PRODUIT
    30. 6.27 ANALYSE DU MARCHÉ AU JAPON PAR APPLICATION
    31. 6.28 ANALYSE DU MARCHÉ AU JAPON PAR TYPE DE PRODUIT
    32. 6.29 ANALYSE DU MARCHÉ EN CORÉE DU SUD PAR APPLICATION
    33. 6.30 ANALYSE DU MARCHÉ EN CORÉE DU SUD PAR TYPE DE PRODUIT
    34. 6.31 ANALYSE DU MARCHÉ EN MALAYSIE PAR APPLICATION
    35. 6.32 ANALYSE DU MARCHÉ EN MALAYSIE PAR TYPE DE PRODUIT
    36. 6.33 ANALYSE DU MARCHÉ EN THAÏLANDE PAR APPLICATION
    37. 6.34 ANALYSE DU MARCHÉ EN THAÏLANDE PAR TYPE DE PRODUIT
    38. 6.35 ANALYSE DU MARCHÉ EN INDONÉSIE PAR APPLICATION
    39. 6.36 ANALYSE DU MARCHÉ EN INDONÉSIE PAR TYPE DE PRODUIT
    40. 6.37 ANALYSE DU MARCHÉ DANS LE RESTE DE L'APAC PAR APPLICATION
    41. 6.38 ANALYSE DU MARCHÉ DANS LE RESTE DE L'APAC PAR TYPE DE PRODUIT
    42. 6.39 ANALYSE DU MARCHÉ EN AMÉRIQUE DU SUD
    43. 6.40 ANALYSE DU MARCHÉ AU BRÉSIL PAR APPLICATION
    44. 6.41 ANALYSE DU MARCHÉ AU BRÉSIL PAR TYPE DE PRODUIT
    45. 6.42 ANALYSE DU MARCHÉ AU MEXIQUE PAR APPLICATION
    46. 6.43 ANALYSE DU MARCHÉ AU MEXIQUE PAR TYPE DE PRODUIT
    47. 6.44 ANALYSE DU MARCHÉ EN ARGENTINE PAR APPLICATION
    48. 6.45 ANALYSE DU MARCHÉ EN ARGENTINE PAR TYPE DE PRODUIT
    49. 6.46 ANALYSE DU MARCHÉ DANS LE RESTE DE L'AMÉRIQUE DU SUD PAR APPLICATION
    50. 6.47 ANALYSE DU MARCHÉ DANS LE RESTE DE L'AMÉRIQUE DU SUD PAR TYPE DE PRODUIT
    51. 6.48 ANALYSE DU MARCHÉ EN MEA
    52. 6.49 ANALYSE DU MARCHÉ DANS LES PAYS DU CCG PAR APPLICATION
    53. 6.50 ANALYSE DU MARCHÉ DANS LES PAYS DU CCG PAR TYPE DE PRODUIT
    54. 6.51 ANALYSE DU MARCHÉ EN AFRIQUE DU SUD PAR APPLICATION
    55. 6.52 ANALYSE DU MARCHÉ EN AFRIQUE DU SUD PAR TYPE DE PRODUIT
    56. 6.53 ANALYSE DU MARCHÉ DANS LE RESTE DE LA MEA PAR APPLICATION
    57. 6.54 ANALYSE DU MARCHÉ DANS LE RESTE DE LA MEA PAR TYPE DE PRODUIT
    58. 6.55 CRITÈRES D'ACHAT CLÉS DES SEMI-CONDUCTEURS ET ÉLECTRONIQUE
    59. 6.56 PROCESSUS DE RECHERCHE DE MRFR
    60. 6.57 ANALYSE DRO DES SEMI-CONDUCTEURS ET ÉLECTRONIQUE
    61. 6.58 ANALYSE D'IMPACT DES FACTEURS MOTRICES : SEMI-CONDUCTEURS ET ÉLECTRONIQUE
    62. 6.59 ANALYSE D'IMPACT DES CONTRAINTES : SEMI-CONDUCTEURS ET ÉLECTRONIQUE
    63. 6.60 CHAÎNE D'APPROVISIONNEMENT / VALEUR : SEMI-CONDUCTEURS ET ÉLECTRONIQUE
    64. 6.61 SEMI-CONDUCTEURS ET ÉLECTRONIQUE, PAR APPLICATION, 2024 (% PART)
    65. 6.62 SEMI-CONDUCTEURS ET ÉLECTRONIQUE, PAR APPLICATION, 2024 À 2035 (milliards USD)
    66. 6.63 SEMI-CONDUCTEURS ET ÉLECTRONIQUE, PAR TYPE DE PRODUIT, 2024 (% PART)
    67. 6.64 SEMI-CONDUCTEURS ET ÉLECTRONIQUE, PAR TYPE DE PRODUIT, 2024 À 2035 (milliards USD)
    68. 6.65 ÉVALUATION COMPARATIVE DES PRINCIPAUX CONCURRENTS 7 LISTE DES TABLEAUX
    69. 7.1 LISTE DES HYPOTHÈSES
    70. 7.2 ESTIMATIONS DE TAILLE DU MARCHÉ EN AMÉRIQUE DU NORD ; PRÉVISIONS
      1. 7.2.1 PAR APPLICATION, 2025-2035 (milliards USD)
      2. 7.2.2 PAR TYPE DE PRODUIT, 2025-2035 (milliards USD)
    71. 7.3 ESTIMATIONS DE TAILLE DU MARCHÉ AUX ÉTATS-UNIS ; PRÉVISIONS
      1. 7.3.1 PAR APPLICATION, 2025-2035 (milliards USD)
      2. 7.3.2 PAR TYPE DE PRODUIT, 2025-2035 (milliards USD)
    72. 7.4 ESTIMATIONS DE TAILLE DU MARCHÉ AU CANADA ; PRÉVISIONS
      1. 7.4.1 PAR APPLICATION, 2025-2035 (milliards USD)
      2. 7.4.2 PAR TYPE DE PRODUIT, 2025-2035 (milliards USD)
    73. 7.5 ESTIMATIONS DE TAILLE DU MARCHÉ EN EUROPE ; PRÉVISIONS
      1. 7.5.1 PAR APPLICATION, 2025-2035 (milliards USD)
      2. 7.5.2 PAR TYPE DE PRODUIT, 2025-2035 (milliards USD)
    74. 7.6 ESTIMATIONS DE TAILLE DU MARCHÉ EN ALLEMAGNE ; PRÉVISIONS
      1. 7.6.1 PAR APPLICATION, 2025-2035 (milliards USD)
      2. 7.6.2 PAR TYPE DE PRODUIT, 2025-2035 (milliards USD)
    75. 7.7 ESTIMATIONS DE TAILLE DU MARCHÉ AU ROYAUME-UNI ; PRÉVISIONS
      1. 7.7.1 PAR APPLICATION, 2025-2035 (milliards USD)
      2. 7.7.2 PAR TYPE DE PRODUIT, 2025-2035 (milliards USD)
    76. 7.8 ESTIMATIONS DE TAILLE DU MARCHÉ EN FRANCE ; PRÉVISIONS
      1. 7.8.1 PAR APPLICATION, 2025-2035 (milliards USD)
      2. 7.8.2 PAR TYPE DE PRODUIT, 2025-2035 (milliards USD)
    77. 7.9 ESTIMATIONS DE TAILLE DU MARCHÉ EN RUSSIE ; PRÉVISIONS
      1. 7.9.1 PAR APPLICATION, 2025-2035 (milliards USD)
      2. 7.9.2 PAR TYPE DE PRODUIT, 2025-2035 (milliards USD)
    78. 7.10 ESTIMATIONS DE TAILLE DU MARCHÉ EN ITALIE ; PRÉVISIONS
      1. 7.10.1 PAR APPLICATION, 2025-2035 (milliards USD)
      2. 7.10.2 PAR TYPE DE PRODUIT, 2025-2035 (milliards USD)
    79. 7.11 ESTIMATIONS DE TAILLE DU MARCHÉ EN ESPAGNE ; PRÉVISIONS
      1. 7.11.1 PAR APPLICATION, 2025-2035 (milliards USD)
      2. 7.11.2 PAR TYPE DE PRODUIT, 2025-2035 (milliards USD)
    80. 7.12 ESTIMATIONS DE TAILLE DU MARCHÉ DANS LE RESTE DE L'EUROPE ; PRÉVISIONS
      1. 7.12.1 PAR APPLICATION, 2025-2035 (milliards USD)
      2. 7.12.2 PAR TYPE DE PRODUIT, 2025-2035 (milliards USD)
    81. 7.13 ESTIMATIONS DE TAILLE DU MARCHÉ EN APAC ; PRÉVISIONS
      1. 7.13.1 PAR APPLICATION, 2025-2035 (milliards USD)
      2. 7.13.2 PAR TYPE DE PRODUIT, 2025-2035 (milliards USD)
    82. 7.14 ESTIMATIONS DE TAILLE DU MARCHÉ EN CHINE ; PRÉVISIONS
      1. 7.14.1 PAR APPLICATION, 2025-2035 (milliards USD)
      2. 7.14.2 PAR TYPE DE PRODUIT, 2025-2035 (milliards USD)
    83. 7.15 ESTIMATIONS DE TAILLE DU MARCHÉ EN INDE ; PRÉVISIONS
      1. 7.15.1 PAR APPLICATION, 2025-2035 (milliards USD)
      2. 7.15.2 PAR TYPE DE PRODUIT, 2025-2035 (milliards USD)
    84. 7.16 ESTIMATIONS DE TAILLE DU MARCHÉ AU JAPON ; PRÉVISIONS
      1. 7.16.1 PAR APPLICATION, 2025-2035 (milliards USD)
      2. 7.16.2 PAR TYPE DE PRODUIT, 2025-2035 (milliards USD)
    85. 7.17 ESTIMATIONS DE TAILLE DU MARCHÉ EN CORÉE DU SUD ; PRÉVISIONS
      1. 7.17.1 PAR APPLICATION, 2025-2035 (milliards USD)
      2. 7.17.2 PAR TYPE DE PRODUIT, 2025-2035 (milliards USD)
    86. 7.18 ESTIMATIONS DE TAILLE DU MARCHÉ EN MALAYSIE ; PRÉVISIONS
      1. 7.18.1 PAR APPLICATION, 2025-2035 (milliards USD)
      2. 7.18.2 PAR TYPE DE PRODUIT, 2025-2035 (milliards USD)
    87. 7.19 ESTIMATIONS DE TAILLE DU MARCHÉ EN THAÏLANDE ; PRÉVISIONS
      1. 7.19.1 PAR APPLICATION, 2025-2035 (milliards USD)
      2. 7.19.2 PAR TYPE DE PRODUIT, 2025-2035 (milliards USD)
    88. 7.20 ESTIMATIONS DE TAILLE DU MARCHÉ EN INDONÉSIE ; PRÉVISIONS
      1. 7.20.1 PAR APPLICATION, 2025-2035 (milliards USD)
      2. 7.20.2 PAR TYPE DE PRODUIT, 2025-2035 (milliards USD)
    89. 7.21 ESTIMATIONS DE TAILLE DU MARCHÉ DANS LE RESTE DE L'APAC ; PRÉVISIONS
      1. 7.21.1 PAR APPLICATION, 2025-2035 (milliards USD)
      2. 7.21.2 PAR TYPE DE PRODUIT, 2025-2035 (milliards USD)
    90. 7.22 ESTIMATIONS DE TAILLE DU MARCHÉ EN AMÉRIQUE DU SUD ; PRÉVISIONS
      1. 7.22.1 PAR APPLICATION, 2025-2035 (milliards USD)
      2. 7.22.2 PAR TYPE DE PRODUIT, 2025-2035 (milliards USD)
    91. 7.23 ESTIMATIONS DE TAILLE DU MARCHÉ AU BRÉSIL ; PRÉVISIONS
      1. 7.23.1 PAR APPLICATION, 2025-2035 (milliards USD)
      2. 7.23.2 PAR TYPE DE PRODUIT, 2025-2035 (milliards USD)
    92. 7.24 ESTIMATIONS DE TAILLE DU MARCHÉ AU MEXIQUE ; PRÉVISIONS
      1. 7.24.1 PAR APPLICATION, 2025-2035 (milliards USD)
      2. 7.24.2 PAR TYPE DE PRODUIT, 2025-2035 (milliards USD)
    93. 7.25 ESTIMATIONS DE TAILLE DU MARCHÉ EN ARGENTINE ; PRÉVISIONS
      1. 7.25.1 PAR APPLICATION, 2025-2035 (milliards USD)
      2. 7.25.2 PAR TYPE DE PRODUIT, 2025-2035 (milliards USD)
    94. 7.26 ESTIMATIONS DE TAILLE DU MARCHÉ DANS LE RESTE DE L'AMÉRIQUE DU SUD ; PRÉVISIONS
      1. 7.26.1 PAR APPLICATION, 2025-2035 (milliards USD)
      2. 7.26.2 PAR TYPE DE PRODUIT, 2025-2035 (milliards USD)
    95. 7.27 ESTIMATIONS DE TAILLE DU MARCHÉ EN MEA ; PRÉVISIONS
      1. 7.27.1 PAR APPLICATION, 2025-2035 (milliards USD)
      2. 7.27.2 PAR TYPE DE PRODUIT, 2025-2035 (milliards USD)
    96. 7.28 ESTIMATIONS DE TAILLE DU MARCHÉ DANS LES PAYS DU CCG ; PRÉVISIONS
      1. 7.28.1 PAR APPLICATION, 2025-2035 (milliards USD)
      2. 7.28.2 PAR TYPE DE PRODUIT, 2025-2035 (milliards USD)
    97. 7.29 ESTIMATIONS DE TAILLE DU MARCHÉ EN AFRIQUE DU SUD ; PRÉVISIONS
      1. 7.29.1 PAR APPLICATION, 2025-2035 (milliards USD)
      2. 7.29.2 PAR TYPE DE PRODUIT, 2025-2035 (milliards USD)
    98. 7.30 ESTIMATIONS DE TAILLE DU MARCHÉ DANS LE RESTE DE LA MEA ; PRÉVISIONS
      1. 7.30.1 PAR APPLICATION, 2025-2035 (milliards USD)
      2. 7.30.2 PAR TYPE DE PRODUIT, 2025-2035 (milliards USD)
    99. 7.31 LANCEMENT DE PRODUIT/DÉVELOPPEMENT/APPROBATION
    100. 7.32 ACQUISITION/PARTENARIAT

Segmentation du marchĂ© du bien-ĂȘtre intelligent

Perspectives par type de produit de bien-ĂȘtre intelligent (milliards USD, 2018-2032)

  • Bluetooth

  • Wi-Fi

  • Autres

Perspectives par application de bien-ĂȘtre intelligent (milliards USD, 2018-2032)

  • HĂŽpitaux

  • Utilisateurs individuels

Perspectives rĂ©gionales de bien-ĂȘtre intelligent (milliards USD, 2018-2032)

  • Perspectives pour l'AmĂ©rique du Nord (milliards USD, 2018-2032)

    • Bien-ĂȘtre connectĂ© en AmĂ©rique du Nord par type

      • Bluetooth

      • Wi-Fi

      • Autres

    • Bien-ĂȘtre connectĂ© en AmĂ©rique du Nord par application

      • HĂŽpitaux

      • Utilisateurs individuels

    • Perspectives aux États-Unis (milliards USD, 2018-2032)

    • Bien-ĂȘtre connectĂ© aux États-Unis par Type

      • Bluetooth

      • Wi-Fi

      • Autres

    • Bien-ĂȘtre intelligent aux États-Unis par application

      • HĂŽpitaux

      • Utilisateurs individuels

    • Perspectives pour le Canada (milliards USD, 2018-2032)

    • Bien-ĂȘtre intelligent au Canada par Type

      • Bluetooth

      • Wi-Fi

      • Autres

    • CANADA Smart Wellness par application

      • HĂŽpital

      • Utilisateurs individuels

  • Perspectives pour l'Europe (milliards USD, 2018-2032)

    • Europe Smart Wellness par Type

      • Bluetooth

      • Wi-Fi

      • Autres

    • Bien-ĂȘtre intelligent en Europe par application

      • HĂŽpital

      • Utilisateurs individuels

    • Allemagne Perspectives (milliards USD, 2018-2032)

    • Allemagne : Bien-ĂȘtre intelligent par Type

      • Bluetooth

      • Wi-Fi

      • Autres

    • Allemagne : Bien-ĂȘtre intelligent par application

      • HĂŽpital

      • Utilisateurs individuels

    • France : Perspectives (milliards USD, 2018-2032)

    • France : Bien-ĂȘtre intelligent par Type

      • Bluetooth

      • Wi-Fi

      • Autres

    • France Smart Wellness par application

      • HĂŽpital

      • Utilisateurs individuels

    • Perspectives au Royaume-Uni (milliards USD, 2018-2032)

    • Royaume-Uni Smart Wellness par Type

      • Bluetooth

      • Wi-Fi

      • Autres

    • Royaume-Uni : Bien-ĂȘtre intelligent par application

      • HĂŽpital

      • Utilisateurs individuels

    • Perspectives pour l'Italie (milliards USD, 2018-2032)

    • Italie : Bien-ĂȘtre intelligent par Type

      • Bluetooth

      • Wi-Fi

      • Autres

    • ITALIE Smart Wellness par application

      • HĂŽpital

      • Utilisateurs individuels

    • ESPAGNE Perspectives (milliards USD, 2018-2032)

    • Espagne Smart Wellness par Type

      • Bluetooth

      • Wi-Fi

      • Autres

    • Espagne : Smart Wellness par application

      • HĂŽpital

      • Utilisateurs individuels

    • Perspectives pour le reste de l'Europe (milliards USD, 2018-2032)

    • Reste de l'Europe : Smart Wellness par Type

      • Bluetooth

      • Wi-Fi

      • Autres

    • RESTE DE L'EUROPE : Bien-ĂȘtre intelligent par application

      • HĂŽpital

      • Utilisateurs individuels

  • Perspectives Asie-Pacifique (milliards USD, 2018-2032)

    • Bien-ĂȘtre intelligent Asie-Pacifique par Type

      • Bluetooth

      • Wi-Fi

      • Autres

    • Bien-ĂȘtre intelligent en Asie-Pacifique par application

      • HĂŽpital

      • Utilisateurs individuels

    • Perspectives pour la Chine (milliards USD, 2018-2032)

    • Bien-ĂȘtre intelligent en Chine par Type

      • Bluetooth

      • Wi-Fi

      • Autres

    • Bien-ĂȘtre intelligent en Chine par application

      • HĂŽpital

      • Utilisateurs individuels

    • Perspectives au Japon (milliards USD, 2018-2032)

    • Bien-ĂȘtre intelligent au Japon par Type

      • Bluetooth

      • Wi-Fi

      • Autres

    • Japon Smart Wellness par application

      • HĂŽpital

      • Utilisateurs individuels

    • Perspectives pour l'Inde (milliards USD, 2018-2032)

    • Inde Smart Wellness par Type

      • Bluetooth

      • Wi-Fi

      • Autres

    • Inde : Smart Wellness par application

      • HĂŽpital

      • Utilisateurs individuels

    • Perspectives pour l'Australie (milliards USD, 2018-2032)

    • Australie : Smart Wellness par Type

      • Bluetooth

      • Wi-Fi

      • Autres

    • Australie Smart Wellness par application

      • HĂŽpital

      • Utilisateurs individuels

    • Perspectives pour le reste de l'Asie-Pacifique (milliards USD, 2018-2032)

    • Reste de l'Asie-Pacifique Smart Wellness par Type

      • Bluetooth

      • Wi-Fi

      • Autres

    • Bien-ĂȘtre intelligent dans le reste de l'Asie-Pacifique par application

      • HĂŽpital

      • Utilisateurs individuels

  • Perspectives pour le reste du monde (milliards USD, 2018-2032)

    • Bien-ĂȘtre intelligent dans le reste du monde par Type

      • Bluetooth

      • Wi-Fi

      • Autres

    • Reste du monde : Bien-ĂȘtre intelligent par application

      • HĂŽpital

      • Utilisateurs individuels

    • Perspectives pour le Moyen-Orient (milliards de dollars amĂ©ricains, 2018-2032)

    • Bien-ĂȘtre intelligent au Moyen-Orient par Type

      • Bluetooth

      • Wi-Fi

      • Autres

    • Middle East Smart Wellness par application

      • HĂŽpital

      • Utilisateurs individuels

    • Perspectives en Afrique (milliards USD, 2018-2032)

    • Africa Smart Wellness par Type

      • Bluetooth

      • Wi-Fi

      • Autres

    • Africa Smart Wellness par application

      • HĂŽpital

      • Utilisateurs individuels

    • Perspectives pour l'AmĂ©rique latine (milliards USD, 2018-2032)

    • AmĂ©rique latine Smart Wellness par Type

      • Bluetooth

      • Wi-Fi

      • Autres

    • AmĂ©rique latine : Bien-ĂȘtre intelligent par application

      • HĂŽpital

      • Utilisateurs individuels

Compare Licence

×
Features License Type
Single User Multiuser License Enterprise User
Price $4,950 $5,950 $7,250
Maximum User Access Limit 1 User Upto 10 Users Unrestricted Access Throughout the Organization
Free Customization ✓ ✓ ✓
Direct Access to Analyst ✓ ✓ ✓
Deliverable Format ✓ ✓ ✓
Platform Access ✗ ✗ ✓
Discount on Next Purchase 10% 15% 15%
Printable Versions ✗ ✗ ✓