Request Free Sample ×

Kindly complete the form below to receive a free sample of this Report

* Please use a valid business email

Leading companies partner with us for data-driven Insights

clients tt-cursor
Hero Background

Marché des bâtiments préfabriqués en Inde

ID: MRFR/PCM/1925-CR
87 Pages
Varsha More
Last Updated: April 06, 2026

Rapport de recherche sur le marché des bâtiments préfabriqués en Inde Informations par matériau (Acier, Aluminium et Autres), par produits (Murs, Colonnes et Poutres, Toits et Planchers, et Autres), et par application (Résidentiel, Commercial et Institutionnel) – Par pays (Inde) Prévisions de marché jusqu'en 2035.

Partager
Download PDF ×

We do not share your information with anyone. However, we may send you emails based on your report interest from time to time. You may contact us at any time to opt-out.

India Pre Engineered Buildings Market Infographic
Purchase Options
  1. 1 SECTION I : RÉSUMÉ EXÉCUTIF ET POINTS CLÉS
    1. 1.1 RÉSUMÉ EXÉCUTIF
      1. 1.1.1 Vue d'ensemble du marché
      2. 1.1.2 Conclusions clés
      3. 1.1.3 Segmentation du marché
      4. 1.1.4 Paysage concurrentiel
      5. 1.1.5 Défis et opportunités
      6. 1.1.6 Perspectives futures
  2. 2 SECTION II : DÉLIMITATION, MÉTHODOLOGIE ET STRUCTURE DU MARCHÉ
    1. 2.1 INTRODUCTION AU MARCHÉ
      1. 2.1.1 Définition
      2. 2.1.2 Portée de l'étude
        1. 2.1.2.1 Objectif de recherche
        2. 2.1.2.2 Hypothèse
        3. 2.1.2.3 Limitations
    2. 2.2 MÉTHODOLOGIE DE RECHERCHE
      1. 2.2.1 Vue d'ensemble
      2. 2.2.2 Exploration de données
      3. 2.2.3 Recherche secondaire
      4. 2.2.4 Recherche primaire
        1. 2.2.4.1 Interviews primaires et processus de collecte d'informations
        2. 2.2.4.2 Répartition des répondants principaux
      5. 2.2.5 Modèle de prévision
      6. 2.2.6 Estimation de la taille du marché
        1. 2.2.6.1 Approche ascendante
        2. 2.2.6.2 Approche descendante
      7. 2.2.7 Triangulation des données
      8. 2.2.8 Validation
  3. 3 SECTION III : ANALYSE QUALITATIVE
    1. 3.1 DYNAMIQUE DU MARCHÉ
      1. 3.1.1 Vue d'ensemble
      2. 3.1.2 Facteurs moteurs
      3. 3.1.3 Contraintes
      4. 3.1.4 Opportunités
    2. 3.2 ANALYSE DES FACTEURS DU MARCHÉ
      1. 3.2.1 Analyse de la chaîne de valeur
      2. 3.2.2 Analyse des cinq forces de Porter
        1. 3.2.2.1 Pouvoir de négociation des fournisseurs
        2. 3.2.2.2 Pouvoir de négociation des acheteurs
        3. 3.2.2.3 Menace des nouveaux entrants
        4. 3.2.2.4 Menace des substituts
        5. 3.2.2.5 Intensité de la rivalité
      3. 3.2.3 Analyse d'impact du COVID-19
        1. 3.2.3.1 Analyse d'impact sur le marché
        2. 3.2.3.2 Impact régional
        3. 3.2.3.3 Analyse des opportunités et des menaces
  4. 4 SECTION IV : ANALYSE QUANTITATIVE
    1. 4.1 Emballage et transport, PAR Matériau (millions USD)
      1. 4.1.1 Acier
      2. 4.1.2 Aluminium
      3. 4.1.3 Autres
    2. 4.2 Emballage et transport, PAR Produit (millions USD)
      1. 4.2.1 Murs
      2. 4.2.2 Colonnes et poutres
      3. 4.2.3 Toits et planchers
      4. 4.2.4 Autres
    3. 4.3 Emballage et transport, PAR Application (millions USD)
      1. 4.3.1 Résidentiel
      2. 4.3.2 Commercial
      3. 4.3.3 Industriel
  5. 5 SECTION V : ANALYSE CONCURRENTIELLE
    1. 5.1 Paysage concurrentiel
      1. 5.1.1 Vue d'ensemble
      2. 5.1.2 Analyse concurrentielle
      3. 5.1.3 Analyse de part de marché
      4. 5.1.4 Stratégie de croissance majeure dans l'emballage et le transport
      5. 5.1.5 Évaluation comparative concurrentielle
      6. 5.1.6 Acteurs principaux en termes de nombre de développements dans l'emballage et le transport
      7. 5.1.7 Développements clés et stratégies de croissance
        1. 5.1.7.1 Lancement de nouveaux produits / Déploiement de services
        2. 5.1.7.2 Fusions et acquisitions
        3. 5.1.7.3 Coentreprises
      8. 5.1.8 Matrice financière des principaux acteurs
        1. 5.1.8.1 Ventes et revenu d'exploitation
        2. 5.1.8.2 Dépenses R&D des principaux acteurs. 2023
    2. 5.2 Profils d'entreprise
      1. 5.2.1 Larsen & Toubro (IN)
        1. 5.2.1.1 Vue d'ensemble financière
        2. 5.2.1.2 Produits offerts
        3. 5.2.1.3 Développements clés
        4. 5.2.1.4 Analyse SWOT
        5. 5.2.1.5 Stratégies clés
      2. 5.2.2 Zamil Steel (SA)
        1. 5.2.2.1 Vue d'ensemble financière
        2. 5.2.2.2 Produits offerts
        3. 5.2.2.3 Développements clés
        4. 5.2.2.4 Analyse SWOT
        5. 5.2.2.5 Stratégies clés
      3. 5.2.3 Nucor Corporation (US)
        1. 5.2.3.1 Vue d'ensemble financière
        2. 5.2.3.2 Produits offerts
        3. 5.2.3.3 Développements clés
        4. 5.2.3.4 Analyse SWOT
        5. 5.2.3.5 Stratégies clés
      4. 5.2.4 BlueScope Steel (AU)
        1. 5.2.4.1 Vue d'ensemble financière
        2. 5.2.4.2 Produits offerts
        3. 5.2.4.3 Développements clés
        4. 5.2.4.4 Analyse SWOT
        5. 5.2.4.5 Stratégies clés
      5. 5.2.5 PEB Steel (VN)
        1. 5.2.5.1 Vue d'ensemble financière
        2. 5.2.5.2 Produits offerts
        3. 5.2.5.3 Développements clés
        4. 5.2.5.4 Analyse SWOT
        5. 5.2.5.5 Stratégies clés
      6. 5.2.6 Kirby Building Systems (KW)
        1. 5.2.6.1 Vue d'ensemble financière
        2. 5.2.6.2 Produits offerts
        3. 5.2.6.3 Développements clés
        4. 5.2.6.4 Analyse SWOT
        5. 5.2.6.5 Stratégies clés
      7. 5.2.7 Steelway Building Systems (CA)
        1. 5.2.7.1 Vue d'ensemble financière
        2. 5.2.7.2 Produits offerts
        3. 5.2.7.3 Développements clés
        4. 5.2.7.4 Analyse SWOT
        5. 5.2.7.5 Stratégies clés
      8. 5.2.8 Vistawall (US)
        1. 5.2.8.1 Vue d'ensemble financière
        2. 5.2.8.2 Produits offerts
        3. 5.2.8.3 Développements clés
        4. 5.2.8.4 Analyse SWOT
        5. 5.2.8.5 Stratégies clés
    3. 5.3 Annexe
      1. 5.3.1 Références
      2. 5.3.2 Rapports connexes
  6. 6 LISTE DES FIGURES
    1. 6.1 SYNOPSIS DU MARCHÉ
    2. 6.2 ANALYSE DU MARCHÉ INDIEN PAR MATÉRIAU
    3. 6.3 ANALYSE DU MARCHÉ INDIEN PAR PRODUIT
    4. 6.4 ANALYSE DU MARCHÉ INDIEN PAR APPLICATION
    5. 6.5 CRITÈRES D'ACHAT CLÉS DE L'EMBALLAGE ET DU TRANSPORT
    6. 6.6 PROCESSUS DE RECHERCHE DE MRFR
    7. 6.7 ANALYSE DRO DE L'EMBALLAGE ET DU TRANSPORT
    8. 6.8 ANALYSE D'IMPACT DES FACTEURS MOTRICES : EMBALLAGE ET TRANSPORT
    9. 6.9 ANALYSE D'IMPACT DES CONTRAINTES : EMBALLAGE ET TRANSPORT
    10. 6.10 CHAÎNE D'APPROVISIONNEMENT / DE VALEUR : EMBALLAGE ET TRANSPORT
    11. 6.11 EMBALLAGE ET TRANSPORT, PAR MATÉRIAU, 2024 (% PART)
    12. 6.12 EMBALLAGE ET TRANSPORT, PAR MATÉRIAU, 2024 À 2035 (millions USD)
    13. 6.13 EMBALLAGE ET TRANSPORT, PAR PRODUIT, 2024 (% PART)
    14. 6.14 EMBALLAGE ET TRANSPORT, PAR PRODUIT, 2024 À 2035 (millions USD)
    15. 6.15 EMBALLAGE ET TRANSPORT, PAR APPLICATION, 2024 (% PART)
    16. 6.16 EMBALLAGE ET TRANSPORT, PAR APPLICATION, 2024 À 2035 (millions USD)
    17. 6.17 ÉVALUATION COMPARATIVE DES PRINCIPAUX CONCURRENTS
  7. 7 LISTE DES TABLEAUX
    1. 7.1 LISTE DES HYPOTHÈSES
    2. 7.2 ESTIMATIONS DE TAILLE DU MARCHÉ INDIEN ; PRÉVISIONS
      1. 7.2.1 PAR MATÉRIAU, 2025-2035 (millions USD)
      2. 7.2.2 PAR PRODUIT, 2025-2035 (millions USD)
      3. 7.2.3 PAR APPLICATION, 2025-2035 (millions USD)
    3. 7.3 LANCEMENT DE PRODUIT / DÉVELOPPEMENT DE PRODUIT / APPROBATION
    4. 7.4 ACQUISITION / PARTENARIAT

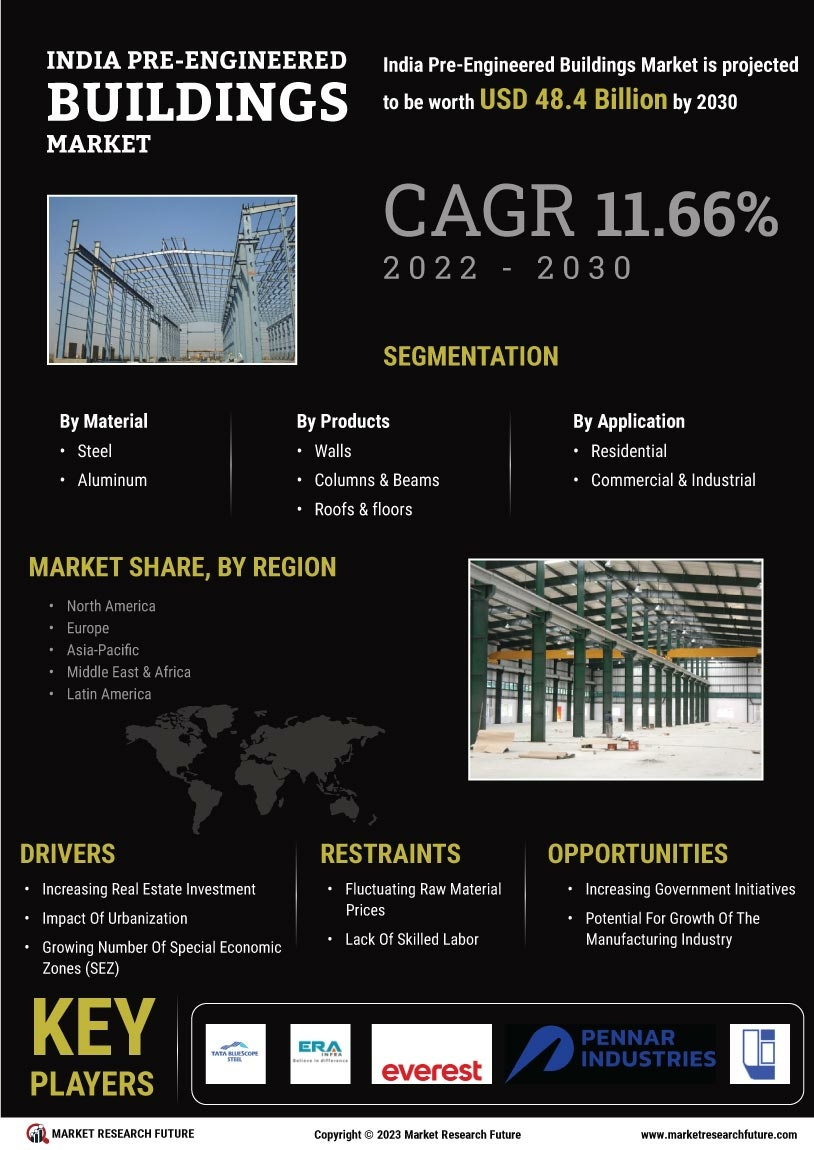
Perspectives des matériaux de construction préfabriqués en Inde (milliards USD, 2018-2032)

  • Acier

  • Aluminium

  • Autres

Perspectives des produits de construction préfabriqués en Inde (milliards USD, 2018-2032)

  • Murs

  • Poteaux et poutres

  • Toitures et Étages

  • Autres

Perspectives d'application des bâtiments préfabriqués en Inde (milliards USD, 2018-2032)

  • Résidentiel

  • Commercial

  • Institutionnel

Compare Licence

×
Features License Type
Single User Multiuser License Enterprise User
Price $4,950 $5,950 $7,250
Maximum User Access Limit 1 User Upto 10 Users Unrestricted Access Throughout the Organization
Free Customization
Direct Access to Analyst
Deliverable Format
Platform Access
Discount on Next Purchase 10% 15% 15%
Printable Versions