Request Free Sample ×

Kindly complete the form below to receive a free sample of this Report

* Please use a valid business email

Leading companies partner with us for data-driven Insights

clients tt-cursor
Hero Background

Marché des hydrosols

ID: MRFR/FnB/3362-HCR
110 Pages
Varsha More
Last Updated: April 06, 2026

Rapport d'étude de marché sur les hydrosols : Informations, par source (Rose, Camomille romaine, Néroli, Lavande, et autres), par catégorie (Biologique et Conventionnelle), par canal de distribution (Basé sur les magasins et Non basé sur les magasins), et par région (Amérique du Nord, Europe, Asie-Pacifique, et Reste du monde) – Prévisions de marché jusqu'en 2035

Partager
Download PDF ×

We do not share your information with anyone. However, we may send you emails based on your report interest from time to time. You may contact us at any time to opt-out.

  1. 1 SECTION I : RÉSUMÉ EXÉCUTIF ET POINTS CLÉS
    1. 1.1 RÉSUMÉ EXÉCUTIF
      1. 1.1.1 Vue d'ensemble du marché
      2. 1.1.2 Conclusions clés
      3. 1.1.3 Segmentation du marché
      4. 1.1.4 Paysage concurrentiel
      5. 1.1.5 Défis et opportunités
      6. 1.1.6 Perspectives futures
  2. 2 SECTION II : DÉLIMITATION, MÉTHODOLOGIE ET STRUCTURE DU MARCHÉ
    1. 2.1 INTRODUCTION AU MARCHÉ
      1. 2.1.1 Définition
      2. 2.1.2 Portée de l'étude
        1. 2.1.2.1 Objectif de recherche
        2. 2.1.2.2 Hypothèse
        3. 2.1.2.3 Limitations
    2. 2.2 MÉTHODOLOGIE DE RECHERCHE
      1. 2.2.1 Vue d'ensemble
      2. 2.2.2 Exploration des données
      3. 2.2.3 Recherche secondaire
      4. 2.2.4 Recherche primaire
        1. 2.2.4.1 Interviews primaires et processus de collecte d'informations
        2. 2.2.4.2 Répartition des répondants principaux
      5. 2.2.5 Modèle de prévision
      6. 2.2.6 Estimation de la taille du marché
        1. 2.2.6.1 Approche ascendante
        2. 2.2.6.2 Approche descendante
      7. 2.2.7 Triangulation des données
      8. 2.2.8 Validation
  3. 3 SECTION III : ANALYSE QUALITATIVE
    1. 3.1 DYNAMIQUE DU MARCHÉ
      1. 3.1.1 Vue d'ensemble
      2. 3.1.2 Facteurs moteurs
      3. 3.1.3 Contraintes
      4. 3.1.4 Opportunités
    2. 3.2 ANALYSE DES FACTEURS DU MARCHÉ
      1. 3.2.1 Analyse de la chaîne de valeur
      2. 3.2.2 Analyse des cinq forces de Porter
        1. 3.2.2.1 Pouvoir de négociation des fournisseurs
        2. 3.2.2.2 Pouvoir de négociation des acheteurs
        3. 3.2.2.3 Menace des nouveaux entrants
        4. 3.2.2.4 Menace des substituts
        5. 3.2.2.5 Intensité de la rivalité
      3. 3.2.3 Analyse de l'impact du COVID-19
        1. 3.2.3.1 Analyse de l'impact sur le marché
        2. 3.2.3.2 Impact régional
        3. 3.2.3.3 Analyse des opportunités et des menaces
  4. 4 SECTION IV : ANALYSE QUANTITATIVE
    1. 4.1 Alimentation, Boissons & Nutrition, PAR Source (milliards USD)
      1. 4.1.1 Rose
      2. 4.1.2 Camomille romaine
      3. 4.1.3 Néroli
      4. 4.1.4 Lavande
      5. 4.1.5 Autres
    2. 4.2 Alimentation, Boissons & Nutrition, PAR Catégorie (milliards USD)
      1. 4.2.1 Biologique
      2. 4.2.2 Conventionnel
    3. 4.3 Alimentation, Boissons & Nutrition, PAR Canal de distribution (milliards USD)
      1. 4.3.1 Basé sur les magasins
      2. 4.3.2 Non basé sur les magasins
    4. 4.4 Alimentation, Boissons & Nutrition, PAR Région (milliards USD)
      1. 4.4.1 Amérique du Nord
        1. 4.4.1.1 États-Unis
        2. 4.4.1.2 Canada
      2. 4.4.2 Europe
        1. 4.4.2.1 Allemagne
        2. 4.4.2.2 Royaume-Uni
        3. 4.4.2.3 France
        4. 4.4.2.4 Russie
        5. 4.4.2.5 Italie
        6. 4.4.2.6 Espagne
        7. 4.4.2.7 Reste de l'Europe
      3. 4.4.3 APAC
        1. 4.4.3.1 Chine
        2. 4.4.3.2 Inde
        3. 4.4.3.3 Japon
        4. 4.4.3.4 Corée du Sud
        5. 4.4.3.5 Malaisie
        6. 4.4.3.6 Thaïlande
        7. 4.4.3.7 Indonésie
        8. 4.4.3.8 Reste de l'APAC
      4. 4.4.4 Amérique du Sud
        1. 4.4.4.1 Brésil
        2. 4.4.4.2 Mexique
        3. 4.4.4.3 Argentine
        4. 4.4.4.4 Reste de l'Amérique du Sud
      5. 4.4.5 MEA
        1. 4.4.5.1 Pays du CCG
        2. 4.4.5.2 Afrique du Sud
        3. 4.4.5.3 Reste de la MEA
  5. 5 SECTION V : ANALYSE CONCURRENTIELLE
    1. 5.1 Paysage concurrentiel
      1. 5.1.1 Vue d'ensemble
      2. 5.1.2 Analyse concurrentielle
      3. 5.1.3 Analyse de la part de marché
      4. 5.1.4 Stratégie de croissance majeure dans l'Alimentation, Boissons & Nutrition
      5. 5.1.5 Évaluation comparative
      6. 5.1.6 Acteurs principaux en termes de nombre de développements dans l'Alimentation, Boissons & Nutrition
      7. 5.1.7 Développements clés et stratégies de croissance
        1. 5.1.7.1 Lancement de nouveaux produits/Déploiement de services
        2. 5.1.7.2 Fusions & Acquisitions
        3. 5.1.7.3 Coentreprises
      8. 5.1.8 Matrice financière des principaux acteurs
        1. 5.1.8.1 Ventes et revenu d'exploitation
        2. 5.1.8.2 Dépenses de R&D des principaux acteurs. 2023
    2. 5.2 Profils d'entreprise
      1. 5.2.1 Flora Health (CA)
        1. 5.2.1.1 Vue d'ensemble financière
        2. 5.2.1.2 Produits offerts
        3. 5.2.1.3 Développements clés
        4. 5.2.1.4 Analyse SWOT
        5. 5.2.1.5 Stratégies clés
      2. 5.2.2 Aromaaz International (IN)
        1. 5.2.2.1 Vue d'ensemble financière
        2. 5.2.2.2 Produits offerts
        3. 5.2.2.3 Développements clés
        4. 5.2.2.4 Analyse SWOT
        5. 5.2.2.5 Stratégies clés
      3. 5.2.3 Essential Oils of New Zealand (NZ)
        1. 5.2.3.1 Vue d'ensemble financière
        2. 5.2.3.2 Produits offerts
        3. 5.2.3.3 Développements clés
        4. 5.2.3.4 Analyse SWOT
        5. 5.2.3.5 Stratégies clés
      4. 5.2.4 The Lavender Company (GB)
        1. 5.2.4.1 Vue d'ensemble financière
        2. 5.2.4.2 Produits offerts
        3. 5.2.4.3 Développements clés
        4. 5.2.4.4 Analyse SWOT
        5. 5.2.4.5 Stratégies clés
      5. 5.2.5 Himalayan Aromatics (IN)
        1. 5.2.5.1 Vue d'ensemble financière
        2. 5.2.5.2 Produits offerts
        3. 5.2.5.3 Développements clés
        4. 5.2.5.4 Analyse SWOT
        5. 5.2.5.5 Stratégies clés
      6. 5.2.6 Kanta Enterprises (IN)
        1. 5.2.6.1 Vue d'ensemble financière
        2. 5.2.6.2 Produits offerts
        3. 5.2.6.3 Développements clés
        4. 5.2.6.4 Analyse SWOT
        5. 5.2.6.5 Stratégies clés
      7. 5.2.7 Aromatics International (US)
        1. 5.2.7.1 Vue d'ensemble financière
        2. 5.2.7.2 Produits offerts
        3. 5.2.7.3 Développements clés
        4. 5.2.7.4 Analyse SWOT
        5. 5.2.7.5 Stratégies clés
      8. 5.2.8 Herbal Infusions (US)
        1. 5.2.8.1 Vue d'ensemble financière
        2. 5.2.8.2 Produits offerts
        3. 5.2.8.3 Développements clés
        4. 5.2.8.4 Analyse SWOT
        5. 5.2.8.5 Stratégies clés
      9. 5.2.9 Natures Garden (US)
        1. 5.2.9.1 Vue d'ensemble financière
        2. 5.2.9.2 Produits offerts
        3. 5.2.9.3 Développements clés
        4. 5.2.9.4 Analyse SWOT
        5. 5.2.9.5 Stratégies clés
      10. 5.2.10 Aromatherapy Associates (GB)
        1. 5.2.10.1 Vue d'ensemble financière
        2. 5.2.10.2 Produits offerts
        3. 5.2.10.3 Développements clés
        4. 5.2.10.4 Analyse SWOT
        5. 5.2.10.5 Stratégies clés
    3. 5.3 Annexe
      1. 5.3.1 Références
      2. 5.3.2 Rapports connexes
  6. 6 LISTE DES FIGURES
    1. 6.1 SYNOPSIS DU MARCHÉ
    2. 6.2 ANALYSE DU MARCHÉ EN AMÉRIQUE DU NORD
    3. 6.3 ANALYSE DU MARCHÉ AUX ÉTATS-UNIS PAR SOURCE
    4. 6.4 ANALYSE DU MARCHÉ AUX ÉTATS-UNIS PAR CATÉGORIE
    5. 6.5 ANALYSE DU MARCHÉ AUX ÉTATS-UNIS PAR CANAL DE DISTRIBUTION
    6. 6.6 ANALYSE DU MARCHÉ AU CANADA PAR SOURCE
    7. 6.7 ANALYSE DU MARCHÉ AU CANADA PAR CATÉGORIE
    8. 6.8 ANALYSE DU MARCHÉ AU CANADA PAR CANAL DE DISTRIBUTION
    9. 6.9 ANALYSE DU MARCHÉ EN EUROPE
    10. 6.10 ANALYSE DU MARCHÉ EN ALLEMAGNE PAR SOURCE
    11. 6.11 ANALYSE DU MARCHÉ EN ALLEMAGNE PAR CATÉGORIE
    12. 6.12 ANALYSE DU MARCHÉ EN ALLEMAGNE PAR CANAL DE DISTRIBUTION
    13. 6.13 ANALYSE DU MARCHÉ AU ROYAUME-UNI PAR SOURCE
    14. 6.14 ANALYSE DU MARCHÉ AU ROYAUME-UNI PAR CATÉGORIE
    15. 6.15 ANALYSE DU MARCHÉ AU ROYAUME-UNI PAR CANAL DE DISTRIBUTION
    16. 6.16 ANALYSE DU MARCHÉ EN FRANCE PAR SOURCE
    17. 6.17 ANALYSE DU MARCHÉ EN FRANCE PAR CATÉGORIE
    18. 6.18 ANALYSE DU MARCHÉ EN FRANCE PAR CANAL DE DISTRIBUTION
    19. 6.19 ANALYSE DU MARCHÉ EN RUSSIE PAR SOURCE
    20. 6.20 ANALYSE DU MARCHÉ EN RUSSIE PAR CATÉGORIE
    21. 6.21 ANALYSE DU MARCHÉ EN RUSSIE PAR CANAL DE DISTRIBUTION
    22. 6.22 ANALYSE DU MARCHÉ EN ITALIE PAR SOURCE
    23. 6.23 ANALYSE DU MARCHÉ EN ITALIE PAR CATÉGORIE
    24. 6.24 ANALYSE DU MARCHÉ EN ITALIE PAR CANAL DE DISTRIBUTION
    25. 6.25 ANALYSE DU MARCHÉ EN ESPAGNE PAR SOURCE
    26. 6.26 ANALYSE DU MARCHÉ EN ESPAGNE PAR CATÉGORIE
    27. 6.27 ANALYSE DU MARCHÉ EN ESPAGNE PAR CANAL DE DISTRIBUTION
    28. 6.28 ANALYSE DU MARCHÉ DANS LE RESTE DE L'EUROPE PAR SOURCE
    29. 6.29 ANALYSE DU MARCHÉ DANS LE RESTE DE L'EUROPE PAR CATÉGORIE
    30. 6.30 ANALYSE DU MARCHÉ DANS LE RESTE DE L'EUROPE PAR CANAL DE DISTRIBUTION
    31. 6.31 ANALYSE DU MARCHÉ EN APAC
    32. 6.32 ANALYSE DU MARCHÉ EN CHINE PAR SOURCE
    33. 6.33 ANALYSE DU MARCHÉ EN CHINE PAR CATÉGORIE
    34. 6.34 ANALYSE DU MARCHÉ EN CHINE PAR CANAL DE DISTRIBUTION
    35. 6.35 ANALYSE DU MARCHÉ EN INDE PAR SOURCE
    36. 6.36 ANALYSE DU MARCHÉ EN INDE PAR CATÉGORIE
    37. 6.37 ANALYSE DU MARCHÉ EN INDE PAR CANAL DE DISTRIBUTION
    38. 6.38 ANALYSE DU MARCHÉ AU JAPON PAR SOURCE
    39. 6.39 ANALYSE DU MARCHÉ AU JAPON PAR CATÉGORIE
    40. 6.40 ANALYSE DU MARCHÉ AU JAPON PAR CANAL DE DISTRIBUTION
    41. 6.41 ANALYSE DU MARCHÉ EN CORÉE DU SUD PAR SOURCE
    42. 6.42 ANALYSE DU MARCHÉ EN CORÉE DU SUD PAR CATÉGORIE
    43. 6.43 ANALYSE DU MARCHÉ EN CORÉE DU SUD PAR CANAL DE DISTRIBUTION
    44. 6.44 ANALYSE DU MARCHÉ EN MALAYSIE PAR SOURCE
    45. 6.45 ANALYSE DU MARCHÉ EN MALAYSIE PAR CATÉGORIE
    46. 6.46 ANALYSE DU MARCHÉ EN MALAYSIE PAR CANAL DE DISTRIBUTION
    47. 6.47 ANALYSE DU MARCHÉ EN THAÏLANDE PAR SOURCE
    48. 6.48 ANALYSE DU MARCHÉ EN THAÏLANDE PAR CATÉGORIE
    49. 6.49 ANALYSE DU MARCHÉ EN THAÏLANDE PAR CANAL DE DISTRIBUTION
    50. 6.50 ANALYSE DU MARCHÉ EN INDONÉSIE PAR SOURCE
    51. 6.51 ANALYSE DU MARCHÉ EN INDONÉSIE PAR CATÉGORIE
    52. 6.52 ANALYSE DU MARCHÉ EN INDONÉSIE PAR CANAL DE DISTRIBUTION
    53. 6.53 ANALYSE DU MARCHÉ DANS LE RESTE DE L'APAC PAR SOURCE
    54. 6.54 ANALYSE DU MARCHÉ DANS LE RESTE DE L'APAC PAR CATÉGORIE
    55. 6.55 ANALYSE DU MARCHÉ DANS LE RESTE DE L'APAC PAR CANAL DE DISTRIBUTION
    56. 6.56 ANALYSE DU MARCHÉ EN AMÉRIQUE DU SUD
    57. 6.57 ANALYSE DU MARCHÉ AU BRÉSIL PAR SOURCE
    58. 6.58 ANALYSE DU MARCHÉ AU BRÉSIL PAR CATÉGORIE
    59. 6.59 ANALYSE DU MARCHÉ AU BRÉSIL PAR CANAL DE DISTRIBUTION
    60. 6.60 ANALYSE DU MARCHÉ AU MEXIQUE PAR SOURCE
    61. 6.61 ANALYSE DU MARCHÉ AU MEXIQUE PAR CATÉGORIE
    62. 6.62 ANALYSE DU MARCHÉ AU MEXIQUE PAR CANAL DE DISTRIBUTION
    63. 6.63 ANALYSE DU MARCHÉ EN ARGENTINE PAR SOURCE
    64. 6.64 ANALYSE DU MARCHÉ EN ARGENTINE PAR CATÉGORIE
    65. 6.65 ANALYSE DU MARCHÉ EN ARGENTINE PAR CANAL DE DISTRIBUTION
    66. 6.66 ANALYSE DU MARCHÉ DANS LE RESTE DE L'AMÉRIQUE DU SUD PAR SOURCE
    67. 6.67 ANALYSE DU MARCHÉ DANS LE RESTE DE L'AMÉRIQUE DU SUD PAR CATÉGORIE
    68. 6.68 ANALYSE DU MARCHÉ DANS LE RESTE DE L'AMÉRIQUE DU SUD PAR CANAL DE DISTRIBUTION
    69. 6.69 ANALYSE DU MARCHÉ EN MEA
    70. 6.70 ANALYSE DU MARCHÉ DANS LES PAYS DU CCG PAR SOURCE
    71. 6.71 ANALYSE DU MARCHÉ DANS LES PAYS DU CCG PAR CATÉGORIE
    72. 6.72 ANALYSE DU MARCHÉ DANS LES PAYS DU CCG PAR CANAL DE DISTRIBUTION
    73. 6.73 ANALYSE DU MARCHÉ EN AFRIQUE DU SUD PAR SOURCE
    74. 6.74 ANALYSE DU MARCHÉ EN AFRIQUE DU SUD PAR CATÉGORIE
    75. 6.75 ANALYSE DU MARCHÉ EN AFRIQUE DU SUD PAR CANAL DE DISTRIBUTION
    76. 6.76 ANALYSE DU MARCHÉ DANS LE RESTE DE LA MEA PAR SOURCE
    77. 6.77 ANALYSE DU MARCHÉ DANS LE RESTE DE LA MEA PAR CATÉGORIE
    78. 6.78 ANALYSE DU MARCHÉ DANS LE RESTE DE LA MEA PAR CANAL DE DISTRIBUTION
    79. 6.79 CRITÈRES D'ACHAT CLÉS DES ALIMENTS, BOISSONS & NUTRITION
    80. 6.80 PROCESSUS DE RECHERCHE DE MRFR
    81. 6.81 ANALYSE DRO DE L'ALIMENTATION, DES BOISSONS & DE LA NUTRITION
    82. 6.82 ANALYSE D'IMPACT DES FACTEURS : ALIMENTATION, BOISSONS & NUTRITION
    83. 6.83 ANALYSE D'IMPACT DES CONTRAINTES : ALIMENTATION, BOISSONS & NUTRITION
    84. 6.84 CHAÎNE D'APPROVISIONNEMENT / DE VALEUR : ALIMENTATION, BOISSONS & NUTRITION
    85. 6.85 ALIMENTATION, BOISSONS & NUTRITION, PAR SOURCE, 2024 (% PART)
    86. 6.86 ALIMENTATION, BOISSONS & NUTRITION, PAR SOURCE, 2024 À 2035 (milliards USD)
    87. 6.87 ALIMENTATION, BOISSONS & NUTRITION, PAR CATÉGORIE, 2024 (% PART)
    88. 6.88 ALIMENTATION, BOISSONS & NUTRITION, PAR CATÉGORIE, 2024 À 2035 (milliards USD)
    89. 6.89 ALIMENTATION, BOISSONS & NUTRITION, PAR CANAL DE DISTRIBUTION, 2024 (% PART)
    90. 6.90 ALIMENTATION, BOISSONS & NUTRITION, PAR CANAL DE DISTRIBUTION, 2024 À 2035 (milliards USD)
    91. 6.91 ÉVALUATION DES PRINCIPAUX CONCURRENTS
  7. 7 LISTE DES TABLEAUX
    1. 7.1 LISTE DES HYPOTHÈSES
    2. 7.2 ESTIMATIONS DE TAILLE DU MARCHÉ EN AMÉRIQUE DU NORD ; PRÉVISIONS
      1. 7.2.1 PAR SOURCE, 2025-2035 (milliards USD)
      2. 7.2.2 PAR CATÉGORIE, 2025-2035 (milliards USD)
      3. 7.2.3 PAR CANAL DE DISTRIBUTION, 2025-2035 (milliards USD)
    3. 7.3 ESTIMATIONS DE TAILLE DU MARCHÉ AUX ÉTATS-UNIS ; PRÉVISIONS
      1. 7.3.1 PAR SOURCE, 2025-2035 (milliards USD)
      2. 7.3.2 PAR CATÉGORIE, 2025-2035 (milliards USD)
      3. 7.3.3 PAR CANAL DE DISTRIBUTION, 2025-2035 (milliards USD)
    4. 7.4 ESTIMATIONS DE TAILLE DU MARCHÉ AU CANADA ; PRÉVISIONS
      1. 7.4.1 PAR SOURCE, 2025-2035 (milliards USD)
      2. 7.4.2 PAR CATÉGORIE, 2025-2035 (milliards USD)
      3. 7.4.3 PAR CANAL DE DISTRIBUTION, 2025-2035 (milliards USD)
    5. 7.5 ESTIMATIONS DE TAILLE DU MARCHÉ EN EUROPE ; PRÉVISIONS
      1. 7.5.1 PAR SOURCE, 2025-2035 (milliards USD)
      2. 7.5.2 PAR CATÉGORIE, 2025-2035 (milliards USD)
      3. 7.5.3 PAR CANAL DE DISTRIBUTION, 2025-2035 (milliards USD)
    6. 7.6 ESTIMATIONS DE TAILLE DU MARCHÉ EN ALLEMAGNE ; PRÉVISIONS
      1. 7.6.1 PAR SOURCE, 2025-2035 (milliards USD)
      2. 7.6.2 PAR CATÉGORIE, 2025-2035 (milliards USD)
      3. 7.6.3 PAR CANAL DE DISTRIBUTION, 2025-2035 (milliards USD)
    7. 7.7 ESTIMATIONS DE TAILLE DU MARCHÉ AU ROYAUME-UNI ; PRÉVISIONS
      1. 7.7.1 PAR SOURCE, 2025-2035 (milliards USD)
      2. 7.7.2 PAR CATÉGORIE, 2025-2035 (milliards USD)
      3. 7.7.3 PAR CANAL DE DISTRIBUTION, 2025-2035 (milliards USD)
    8. 7.8 ESTIMATIONS DE TAILLE DU MARCHÉ EN FRANCE ; PRÉVISIONS
      1. 7.8.1 PAR SOURCE, 2025-2035 (milliards USD)
      2. 7.8.2 PAR CATÉGORIE, 2025-2035 (milliards USD)
      3. 7.8.3 PAR CANAL DE DISTRIBUTION, 2025-2035 (milliards USD)
    9. 7.9 ESTIMATIONS DE TAILLE DU MARCHÉ EN RUSSIE ; PRÉVISIONS
      1. 7.9.1 PAR SOURCE, 2025-2035 (milliards USD)
      2. 7.9.2 PAR CATÉGORIE, 2025-2035 (milliards USD)
      3. 7.9.3 PAR CANAL DE DISTRIBUTION, 2025-2035 (milliards USD)
    10. 7.10 ESTIMATIONS DE TAILLE DU MARCHÉ EN ITALIE ; PRÉVISIONS
      1. 7.10.1 PAR SOURCE, 2025-2035 (milliards USD)
      2. 7.10.2 PAR CATÉGORIE, 2025-2035 (milliards USD)
      3. 7.10.3 PAR CANAL DE DISTRIBUTION, 2025-2035 (milliards USD)
    11. 7.11 ESTIMATIONS DE TAILLE DU MARCHÉ EN ESPAGNE ; PRÉVISIONS
      1. 7.11.1 PAR SOURCE, 2025-2035 (milliards USD)
      2. 7.11.2 PAR CATÉGORIE, 2025-2035 (milliards USD)
      3. 7.11.3 PAR CANAL DE DISTRIBUTION, 2025-2035 (milliards USD)
    12. 7.12 ESTIMATIONS DE TAILLE DU MARCHÉ DANS LE RESTE DE L'EUROPE ; PRÉVISIONS
      1. 7.12.1 PAR SOURCE, 2025-2035 (milliards USD)
      2. 7.12.2 PAR CATÉGORIE, 2025-2035 (milliards USD)
      3. 7.12.3 PAR CANAL DE DISTRIBUTION, 2025-2035 (milliards USD)
    13. 7.13 ESTIMATIONS DE TAILLE DU MARCHÉ EN APAC ; PRÉVISIONS
      1. 7.13.1 PAR SOURCE, 2025-2035 (milliards USD)
      2. 7.13.2 PAR CATÉGORIE, 2025-2035 (milliards USD)
      3. 7.13.3 PAR CANAL DE DISTRIBUTION, 2025-2035 (milliards USD)
    14. 7.14 ESTIMATIONS DE TAILLE DU MARCHÉ EN CHINE ; PRÉVISIONS
      1. 7.14.1 PAR SOURCE, 2025-2035 (milliards USD)
      2. 7.14.2 PAR CATÉGORIE, 2025-2035 (milliards USD)
      3. 7.14.3 PAR CANAL DE DISTRIBUTION, 2025-2035 (milliards USD)
    15. 7.15 ESTIMATIONS DE TAILLE DU MARCHÉ EN INDE ; PRÉVISIONS
      1. 7.15.1 PAR SOURCE, 2025-2035 (milliards USD)
      2. 7.15.2 PAR CATÉGORIE, 2025-2035 (milliards USD)
      3. 7.15.3 PAR CANAL DE DISTRIBUTION, 2025-2035 (milliards USD)
    16. 7.16 ESTIMATIONS DE TAILLE DU MARCHÉ AU JAPON ; PRÉVISIONS
      1. 7.16.1 PAR SOURCE, 2025-2035 (milliards USD)
      2. 7.16.2 PAR CATÉGORIE, 2025-2035 (milliards USD)
      3. 7.16.3 PAR CANAL DE DISTRIBUTION, 2025-2035 (milliards USD)
    17. 7.17 ESTIMATIONS DE TAILLE DU MARCHÉ EN CORÉE DU SUD ; PRÉVISIONS
      1. 7.17.1 PAR SOURCE, 2025-2035 (milliards USD)
      2. 7.17.2 PAR CATÉGORIE, 2025-2035 (milliards USD)
      3. 7.17.3 PAR CANAL DE DISTRIBUTION, 2025-2035 (milliards USD)
    18. 7.18 ESTIMATIONS DE TAILLE DU MARCHÉ EN MALAYSIE ; PRÉVISIONS
      1. 7.18.1 PAR SOURCE, 2025-2035 (milliards USD)
      2. 7.18.2 PAR CATÉGORIE, 2025-2035 (milliards USD)
      3. 7.18.3 PAR CANAL DE DISTRIBUTION, 2025-2035 (milliards USD)
    19. 7.19 ESTIMATIONS DE TAILLE DU MARCHÉ EN THAÏLANDE ; PRÉVISIONS
      1. 7.19.1 PAR SOURCE, 2025-2035 (milliards USD)
      2. 7.19.2 PAR CATÉGORIE, 2025-2035 (milliards USD)
      3. 7.19.3 PAR CANAL DE DISTRIBUTION, 2025-2035 (milliards USD)
    20. 7.20 ESTIMATIONS DE TAILLE DU MARCHÉ EN INDONÉSIE ; PRÉVISIONS
      1. 7.20.1 PAR SOURCE, 2025-2035 (milliards USD)
      2. 7.20.2 PAR CATÉGORIE, 2025-2035 (milliards USD)
      3. 7.20.3 PAR CANAL DE DISTRIBUTION, 2025-2035 (milliards USD)
    21. 7.21 ESTIMATIONS DE TAILLE DU MARCHÉ DANS LE RESTE DE L'APAC ; PRÉVISIONS
      1. 7.21.1 PAR SOURCE, 2025-2035 (milliards USD)
      2. 7.21.2 PAR CATÉGORIE, 2025-2035 (milliards USD)
      3. 7.21.3 PAR CANAL DE DISTRIBUTION, 2025-2035 (milliards USD)
    22. 7.22 ESTIMATIONS DE TAILLE DU MARCHÉ EN AMÉRIQUE DU SUD ; PRÉVISIONS
      1. 7.22.1 PAR SOURCE, 2025-2035 (milliards USD)
      2. 7.22.2 PAR CATÉGORIE, 2025-2035 (milliards USD)
      3. 7.22.3 PAR CANAL DE DISTRIBUTION, 2025-2035 (milliards USD)
    23. 7.23 ESTIMATIONS DE TAILLE DU MARCHÉ AU BRÉSIL ; PRÉVISIONS
      1. 7.23.1 PAR SOURCE, 2025-2035 (milliards USD)
      2. 7.23.2 PAR CATÉGORIE, 2025-2035 (milliards USD)
      3. 7.23.3 PAR CANAL DE DISTRIBUTION, 2025-2035 (milliards USD)
    24. 7.24 ESTIMATIONS DE TAILLE DU MARCHÉ AU MEXIQUE ; PRÉVISIONS
      1. 7.24.1 PAR SOURCE, 2025-2035 (milliards USD)
      2. 7.24.2 PAR CATÉGORIE, 2025-2035 (milliards USD)
      3. 7.24.3 PAR CANAL DE DISTRIBUTION, 2025-2035 (milliards USD)
    25. 7.25 ESTIMATIONS DE TAILLE DU MARCHÉ EN ARGENTINE ; PRÉVISIONS
      1. 7.25.1 PAR SOURCE, 2025-2035 (milliards USD)
      2. 7.25.2 PAR CATÉGORIE, 2025-2035 (milliards USD)
      3. 7.25.3 PAR CANAL DE DISTRIBUTION, 2025-2035 (milliards USD)
    26. 7.26 ESTIMATIONS DE TAILLE DU MARCHÉ DANS LE RESTE DE L'AMÉRIQUE DU SUD ; PRÉVISIONS
      1. 7.26.1 PAR SOURCE, 2025-2035 (milliards USD)
      2. 7.26.2 PAR CATÉGORIE, 2025-2035 (milliards USD)
      3. 7.26.3 PAR CANAL DE DISTRIBUTION, 2025-2035 (milliards USD)
    27. 7.27 ESTIMATIONS DE TAILLE DU MARCHÉ EN MEA ; PRÉVISIONS
      1. 7.27.1 PAR SOURCE, 2025-2035 (milliards USD)
      2. 7.27.2 PAR CATÉGORIE, 2025-2035 (milliards USD)
      3. 7.27.3 PAR CANAL DE DISTRIBUTION, 2025-2035 (milliards USD)
    28. 7.28 ESTIMATIONS DE TAILLE DU MARCHÉ DANS LES PAYS DU CCG ; PRÉVISIONS
      1. 7.28.1 PAR SOURCE, 2025-2035 (milliards USD)
      2. 7.28.2 PAR CATÉGORIE, 2025-2035 (milliards USD)
      3. 7.28.3 PAR CANAL DE DISTRIBUTION, 2025-2035 (milliards USD)
    29. 7.29 ESTIMATIONS DE TAILLE DU MARCHÉ EN AFRIQUE DU SUD ; PRÉVISIONS
      1. 7.29.1 PAR SOURCE, 2025-2035 (milliards USD)
      2. 7.29.2 PAR CATÉGORIE, 2025-2035 (milliards USD)
      3. 7.29.3 PAR CANAL DE DISTRIBUTION, 2025-2035 (milliards USD)
    30. 7.30 ESTIMATIONS DE TAILLE DU MARCHÉ DANS LE RESTE DE LA MEA ; PRÉVISIONS
      1. 7.30.1 PAR SOURCE, 2025-2035 (milliards USD)
      2. 7.30.2 PAR CATÉGORIE, 2025-2035 (milliards USD)
      3. 7.30.3 PAR CANAL DE DISTRIBUTION, 2025-2035 (milliards USD)
    31. 7.31 LANCEMENT DE PRODUIT/DÉVELOPPEMENT/APPROBATION
    32. 7.32 ACQUISITION/PARTENARIAT

Segmentation du marché

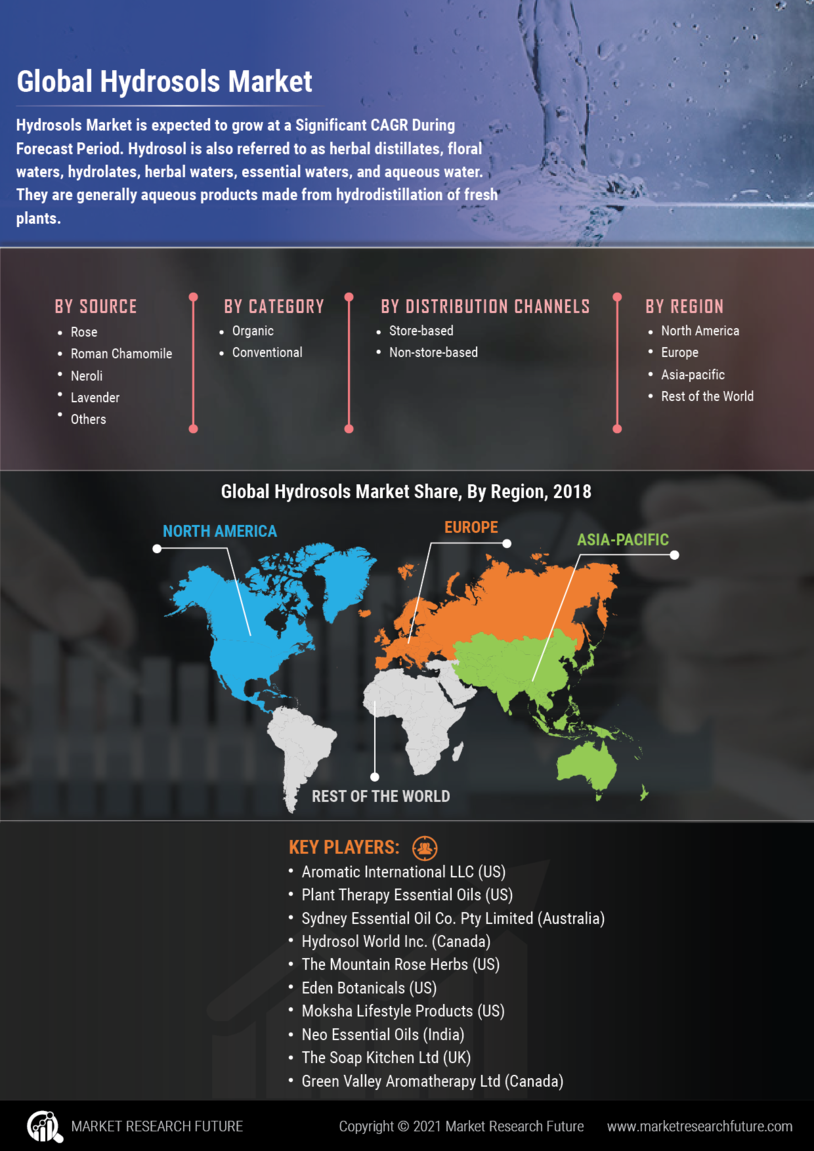
Perspectives des sources d'hydrolats (milliards USD, 2018-2032)

  • Rose
  • Camomille romaine
  • Néroli
  • Lavande
  • Autres

Perspectives des catégories d'hydrolats (milliards USD, 2018-2032)

  • Bio
  • Conventionnel

Perspectives des canaux de distribution d'hydrolats (milliards USD, 2018-2032)

  • En magasin
  • Hors magasin

Perspectives régionales d'hydrolats (milliards USD, 2018-2032)

  • Perspectives pour l'Amérique du Nord (milliards USD, 2018-2032)
    • Hydrolats d'Amérique du Nord par source
      • Rose
      • Camomille romaine
      • Néroli
      • Lavande
      • Autres
    • Hydrolats d'Amérique du Nord par catégorie de source
      • Bio
      • Conventionnel
    • Hydrolats d'Amérique du Nord par canal de distribution
      • En magasin
      • Hors magasin
    • Perspectives aux États-Unis(USD) Milliards, 2018-2032)
    • Hydrolats américains par source
      • Rose
      • Camomille romaine
      • Néroli
      • Lavande
      • Autres
    • Hydrolats américains par catégorie de source
      • Biologique
      • Conventionnel
    • Hydrolats américains par canal de distribution
      • En magasin
      • Hors magasin
    • CANADAPerspectives (milliards USD, 2018-2032)
    • CANADA Hydrolats par source
      • Rose
      • Camomille romaine
      • Néroli
      • Lavande
      • Autres
    • Hydrolats du Canada par catégorie de source
      • Biologique
      • Conventionnel
    • Hydrolats du Canada par canal de distribution
      • En magasin
      • Hors magasin
    • Perspectives pour l'Europe (milliards USD, 2018-2032)
      • Hydrolats d'Europe par source
        • Rose
        • Romaine Camomille
        • Néroli
        • Lavande
        • Autres
      • Hydrolats européens par catégorie d'origine
        • Bio
        • Conventionnel
      • Hydrolats européens par canal de distribution
        • En magasin
        • Hors magasin
      • Allemagne Perspectives (milliards USD, 2018-2032)
      • Allemagne Hydrolats par source
        • Rose
        • Romaine Camomille
        • Néroli
        • Lavande
        • Autres
      • Hydrolats allemands par catégorie d'origine
        • Bio
        • Conventionnel
      • Hydrolats allemands par canal de distribution
        • En magasin
        • Hors magasin
      • Perspectives pour la France (milliards de dollars américains, 2018-2032)
      • Hydrolats français par source
        • Rose
        • Romaine Camomille
        • Néroli
        • Lavande
        • Autres
      • Hydrolats français par catégorie d'origine
        • Bio
        • Conventionnel
      • Hydrolats français par canal de distribution
        • En magasin
        • Hors magasin
      • Perspectives pour le Royaume-Uni(milliards USD, 2018-2032)
      • Hydrolats britanniques par source
        • Rose
        • Romaine Camomille
        • Néroli
        • Lavande
        • Autres
      • Hydrolats britanniques par catégorie d'origine
        • Bio
        • Conventionnel
      • Hydrolats britanniques par canal de distribution
        • En magasin
        • Hors magasin
      • ITALIEPerspectives (milliards USD, 2018-2032)
      • ITALIEHydrolats par source
        • Rose
        • Romaine Camomille
        • Néroli
        • Lavande
        • Autres
      • Italie : Hydrolats par catégorie d'origine
        • Bio
        • Conventionnel
      • Italie : Hydrolats par canal de distribution
        • En magasin
        • Hors magasin
      • Espagne : Perspectives (milliards USD, 2018-2032)
      • Espagne : Hydrolats par source
        • Rose
        • Romaine Camomille
        • Néroli
        • Lavande
        • Autres
      • Hydrolats d'Espagne par catégorie d'origine
        • Bio
        • Conventionnel
      • Hydrolats d'Espagne par canal de distribution
        • En magasin
        • Hors magasin
      • Reste de l'EuropePerspectives (milliards USD, 2018-2032)
      • Reste de l'EuropeHydrolats par source
        • Rose
        • Romaine Camomille
        • Néroli
        • Lavande
        • Autres
      • Hydrolats du RESTE DE L'EUROPE par catégorie d'origine
        • Bio
        • Conventionnel
      • Hydrolats du RESTE DE L'EUROPE par canal de distribution
        • En magasin
        • Hors magasin
      • Perspectives Asie-Pacifique (milliards USD, 2018-2032)
        • Hydrolats Asie-Pacifique par source
          • Rose
          • Camomille romaine
        • Hydrolats Asie-Pacifique Par catégorie de source
          • Biologique
          • Conventionnel
        • Hydrolats d'Asie-Pacifique par canal de distribution
          • En magasin
          • Hors magasin
        • Perspectives pour la Chine (milliards de dollars américains, 2018-2032)
        • Hydrolats de Chine par source
          • Rose
          • Camomille romaine
          • Néroli
          • Lavande
          • Autres
        • Hydrolats de Chine par catégorie Source
          • Biologique
          • Conventionnel
        • Hydrolats chinois par canal de distribution
          • En magasin
          • Hors magasin
        • Perspectives japonaises (milliards USD, 2018-2032)
        • Hydrolats japonais par source
          • Rose
          • Camomille romaine
          • Néroli
          • Lavande
          • Autres
        • Hydrolats japonais par catégorie Source
          • Biologique
          • Conventionnel
        • Hydrolats japonais par canal de distribution
          • En magasin
          • Hors magasin
        • Perspectives pour l'Inde(milliards USD, 2018-2032)
        • Hydrolats indiens par source
          • Rose
          • Camomille romaine
          • Néroli
          • Lavande
          • Autres
        • Hydrolats indiens par catégorie Source
          • Biologique
          • Conventionnel
        • Hydrolats d'Inde par canal de distribution
          • En magasin
          • Hors magasin
        • Perspectives pour l'Australie (milliards de dollars américains, 2018-2032)
        • Hydrolats d'Australie par source
          • Rose
          • Camomille romaine
          • Néroli
          • Lavande
          • Autres
        • Hydrolats d'Australie par catégorie Source
          • Biologique
          • Conventionnel
        • Hydrolats d'Australie par canal de distribution
          • En magasin
          • Hors magasin
        • Perspectives pour le reste de l'Asie-Pacifique (milliards USD, 2018-2032)
        • Hydrolats du reste de l'Asie-Pacifique par source
          • Rose
          • Camomille romaine
          • Néroli
          • Lavande
          • Autres
        • Hydrolats du reste de l'Asie-Pacifique par catégorie Source
          • Biologique
          • Conventionnel
        • Hydrolats du reste de l'Asie-Pacifique par canal de distribution
          • En magasin
          • Hors magasin
        • Perspectives pour le reste du monde (milliards USD, 2018-2032)
          • Hydrolats du reste du monde par source
            • Rose
            • Camomille romaine
            • Néroli
            • Lavande
            • Autres
          • Hydrolats du reste du monde par catégorie Source
            • Biologique
            • Conventionnel
          • Répartition des hydrolats du reste du monde par canal de distribution
            • En magasin
            • Hors magasin
          • Perspectives pour le Moyen-Orient (milliards de dollars américains, 2018-2032)
          • Hydrolats du Moyen-Orient par source
            • Rose
            • Camomille romaine
            • Néroli
            • Lavande
            • Autres
          • Hydrolats du Moyen-Orient par catégorie Source
            • Biologique
            • Conventionnel
          • Hydrolats du Moyen-Orient par canal de distribution
            • En magasin
            • Hors magasin
          • Perspectives pour l'Afrique(milliards USD, 2018-2032)
          • Hydrolats d'Afrique par source
            • Rose
            • Camomille romaine
            • Néroli
            • Lavande
            • Autres
          • Hydrolats d'Afrique par catégorie Source
            • Biologique
            • Conventionnel
          • Hydrolats d'Afrique par canal de distribution
            • En magasin
            • Hors magasin
          • Perspectives pour l'Amérique latine(milliards USD, 2018-2032)
          • Hydrolats d'Amérique latine par source
            • Rose
            • Camomille romaine
            • Néroli
            • Lavande
            • Autres
          • Hydrolats d'Amérique latine par catégorie Source
            • Biologique
            • Conventionnel
          • Hydrolats d'Amérique latine par canal de distribution
            • En magasin
            • Hors magasin


Compare Licence

×
Features License Type
Single User Multiuser License Enterprise User
Price $4,950 $5,950 $7,250
Maximum User Access Limit 1 User Upto 10 Users Unrestricted Access Throughout the Organization
Free Customization
Direct Access to Analyst
Deliverable Format
Platform Access
Discount on Next Purchase 10% 15% 15%
Printable Versions