Segmentation du marché de l'automatisation des services d'assistance
Perspectives par type de logiciel d'automatisation des services d'assistance (milliards USD, 2018-2032)
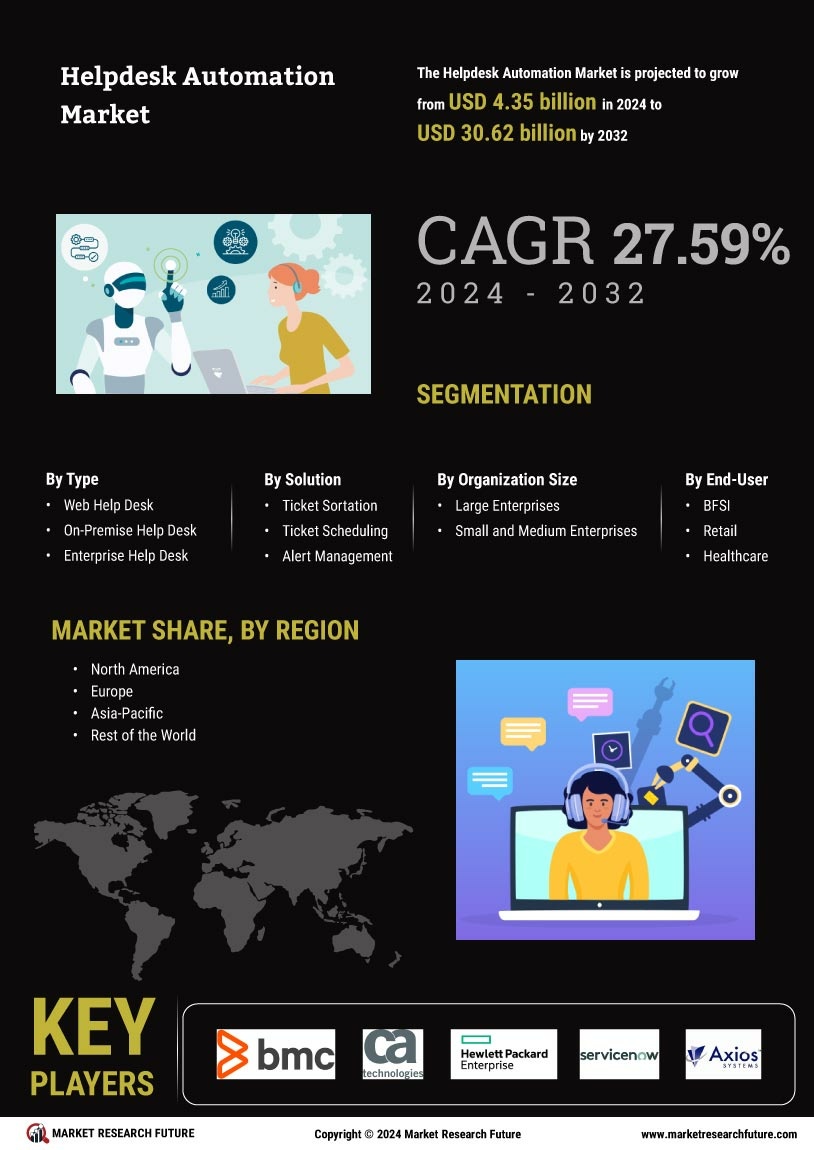
Service d'assistance Web
Service d'assistance sur site
Service d'assistance d'entreprise
Service d'assistance open source
Perspectives par solution d'automatisation des services d'assistance (milliards USD, 2018-2032)
Tri des tickets
Planification des tickets
Gestion des alertes
Autres
Perspectives par taille d'organisation pour l'automatisation des services d'assistance (milliards USD, 2018-2032)
Grandes entreprises
Petites et moyennes entreprises
Perspectives par utilisateur final pour l'automatisation des services d'assistance (milliards USD, 2018-2032)
BFSI
Commerce de détail
Santé
Automobile
Télécommunications
Éducation
Gouvernement
Perspectives régionales pour l'automatisation des services d'assistance (milliards USD, 2018-2032)
Perspectives pour l'Amérique du Nord (milliards USD, 2018-2032)
Automatisation des services d'assistance en Amérique du Nord par type de logiciel
Service d'assistance Web
Service d'assistance sur site
Service d'assistance d'entreprise
Service d'assistance open source
Automatisation des services d'assistance en Amérique du Nord par solution
Tri des tickets
Planification des tickets
Gestion des alertes
Autres
Automatisation des services d'assistance en Amérique du Nord par taille d'organisation
Grandes entreprises
Petites et moyennes entreprises
Automatisation des services d'assistance en Amérique du Nord par utilisateur final
BFSI
Commerce de détail
Santé
Automobile
Télécommunications
Éducation
Gouvernement
Perspectives pour les États-Unis (milliards USD, 2018-2032)
Automatisation des services d'assistance aux États-Unis par type de logiciel
Service d'assistance Web
Service d'assistance sur site
Service d'assistance d'entreprise
Service d'assistance open source
Automatisation des services d'assistance aux États-Unis par solution
Tri des tickets
Planification des tickets
Gestion des alertes
Autres
Automatisation des services d'assistance aux États-Unis par taille d'organisation
Grandes entreprises
Petites et moyennes entreprises
Automatisation des services d'assistance aux États-Unis par utilisateur final
BFSI
Commerce de détail
Santé
Automobile
Télécommunications
Éducation
Gouvernement
Perspectives pour le Canada (milliards USD, 2018-2032)
Automatisation des services d'assistance au Canada par type de logiciel
Service d'assistance Web
Service d'assistance sur site
Service d'assistance d'entreprise
Service d'assistance open source
Automatisation des services d'assistance au Canada par solution
Tri des tickets
Planification des tickets
Gestion des alertes
Autres
Automatisation des services d'assistance au Canada par taille d'organisation
Grandes entreprises
Petites et moyennes entreprises
Automatisation des services d'assistance au Canada par utilisateur final
BFSI
Commerce de détail
Santé
Automobile
Télécommunications
Éducation
Gouvernement
Perspectives pour l'Europe (milliards USD, 2018-2032)
Automatisation des services d'assistance en Europe par type de logiciel
Service d'assistance Web
Service d'assistance sur site
Service d'assistance d'entreprise
Service d'assistance open source
Automatisation des services d'assistance en Europe par solution
Tri des tickets
Planification des tickets
Gestion des alertes
Autres
Automatisation des services d'assistance en Europe par taille d'organisation
Grandes entreprises
Petites et moyennes entreprises
Automatisation des services d'assistance en Europe par utilisateur final
BFSI
Commerce de détail
Santé
Automobile
Télécommunications
Éducation
Gouvernement
Perspectives pour l'Allemagne (milliards USD, 2018-2032)
Automatisation des services d'assistance en Allemagne par type de logiciel
Service d'assistance Web
Service d'assistance sur site
Service d'assistance d'entreprise
Service d'assistance open source
Automatisation des services d'assistance en Allemagne par solution
Tri des tickets
Planification des tickets
Gestion des alertes
Autres
Automatisation des services d'assistance en Allemagne par taille d'organisation
Grandes entreprises
Petites et moyennes entreprises
Automatisation des services d'assistance en Allemagne par utilisateur final
BFSI
Commerce de détail
Santé
Automobile
Télécommunications
Éducation
Gouvernement
Perspectives pour la France (milliards USD, 2018-2032)
Automatisation des services d'assistance en France par type de logiciel
Service d'assistance Web
Service d'assistance sur site
Service d'assistance d'entreprise
Service d'assistance open source
Automatisation des services d'assistance en France par solution
Tri des tickets
Planification des tickets
Gestion des alertes
Autres
Automatisation des services d'assistance en France par taille d'organisation
Grandes entreprises
Petites et moyennes entreprises
Automatisation des services d'assistance en France par utilisateur final
BFSI
Commerce de détail
Santé
Automobile
Télécommunications
Éducation
Gouvernement
Perspectives pour le Royaume-Uni (milliards USD, 2018-2032)
Automatisation des services d'assistance au Royaume-Uni par type de logiciel
Service d'assistance Web
Service d'assistance sur site
Service d'assistance d'entreprise
Service d'assistance open source
Automatisation des services d'assistance au Royaume-Uni par solution
Tri des tickets
Planification des tickets
Gestion des alertes
Autres
Automatisation des services d'assistance au Royaume-Uni par taille d'organisation
Grandes entreprises
Petites et moyennes entreprises
Automatisation des services d'assistance au Royaume-Uni par utilisateur final
BFSI
Commerce de détail
Santé
Automobile
Télécommunications
Éducation
Gouvernement
Perspectives pour l'Italie (milliards USD, 2018-2032)
Automatisation des services d'assistance en Italie par type de logiciel
Service d'assistance Web
Service d'assistance sur site
Service d'assistance d'entreprise
Service d'assistance open source
Automatisation des services d'assistance en Italie par solution
Tri des tickets
Planification des tickets
Gestion des alertes
Autres
Automatisation des services d'assistance en Italie par taille d'organisation
Grandes entreprises
Petites et moyennes entreprises
Automatisation des services d'assistance en Italie par utilisateur final
BFSI
Commerce de détail
Santé
Automobile
Télécommunications
Éducation
Gouvernement
Perspectives pour l'Espagne (milliards USD, 2018-2032)
Automatisation des services d'assistance en Espagne par type de logiciel
Service d'assistance Web
Service d'assistance sur site
Service d'assistance d'entreprise
Service d'assistance open source
Automatisation des services d'assistance en Espagne par solution
Tri des tickets
Planification des tickets
Gestion des alertes
Autres
Automatisation des services d'assistance en Espagne par taille d'organisation
Grandes entreprises
Petites et moyennes entreprises
Automatisation des services d'assistance en Espagne par utilisateur final
BFSI
Commerce de détail
Santé
Automobile
Télécommunications
Éducation
Gouvernement
Perspectives pour le reste de l'Europe (milliards USD, 2018-2032)
Automatisation des services d'assistance dans le reste de l'Europe par type de logiciel
Service d'assistance Web
Service d'assistance sur site
Service d'assistance d'entreprise
Service d'assistance open source
Automatisation des services d'assistance dans le reste de l'Europe par solution
Tri des tickets
Planification des tickets
Gestion des alertes
Autres
Automatisation des services d'assistance dans le reste de l'Europe par taille d'organisation
Grandes entreprises
Petites et moyennes entreprises
Automatisation des services d'assistance dans le reste de l'Europe par utilisateur final
BFSI
Commerce de détail
Santé
Automobile
Télécommunications
Éducation
Gouvernement
Perspectives pour la région Asie-Pacifique (milliards USD, 2018-2032)
Automatisation des services d'assistance en Asie-Pacifique par type de logiciel
Service d'assistance Web
Service d'assistance sur site
Service d'assistance d'entreprise
Service d'assistance open source
Automatisation des services d'assistance en Asie-Pacifique par solution
Tri des tickets
Planification des tickets
Gestion des alertes
Autres
Automatisation des services d'assistance en Asie-Pacifique par taille d'organisation
Grandes entreprises
Petites et moyennes entreprises
Automatisation des services d'assistance en Asie-Pacifique par utilisateur final
BFSI
Commerce de détail
Santé
Automobile
Télécommunications
Éducation
Gouvernement
Perspectives pour la Chine (milliards USD, 2018-2032)
Automatisation des services d'assistance en Chine par type de logiciel
Service d'assistance Web
Service d'assistance sur site
Service d'assistance d'entreprise
Service d'assistance open source
Automatisation des services d'assistance en Chine par solution
Tri des tickets
Planification des tickets
Gestion des alertes
Autres
Automatisation des services d'assistance en Chine par taille d'organisation
Grandes entreprises
Petites et moyennes entreprises
Automatisation des services d'assistance en Chine par utilisateur final
BFSI
Commerce de détail
Santé
Automobile
Télécommunications
Éducation
Gouvernement
Perspectives pour le Japon (milliards USD, 2018-2032)
Automatisation des services d'assistance au Japon par type de logiciel
Service d'assistance Web
Service d'assistance sur site
Service d'assistance d'entreprise
Service d'assistance open source
Automatisation des services d'assistance au Japon par solution
Tri des tickets
Planification des tickets
Gestion des alertes
Autres
Automatisation des services d'assistance au Japon par taille d'organisation
Grandes entreprises
Petites et moyennes entreprises
Automatisation des services d'assistance au Japon par utilisateur final
BFSI
Commerce de détail
Santé
Automobile
Télécommunications
Éducation
Gouvernement
Perspectives pour l'Inde (milliards USD, 2018-2032)
Automatisation des services d'assistance en Inde par type de logiciel
Service d'assistance Web
Service d'assistance sur site
Service d'assistance d'entreprise
Service d'assistance open source
Automatisation des services d'assistance en Inde par solution
Tri des tickets
Planification des tickets
Gestion des alertes
Autres
Automatisation des services d'assistance en Inde par taille d'organisation
Grandes entreprises
Petites et moyennes entreprises
Automatisation des services d'assistance en Inde par utilisateur final
BFSI
Commerce de détail
Santé
Automobile
Télécommunications
Éducation
Gouvernement
Perspectives pour l'Australie (milliards USD, 2018-2032)
Automatisation des services d'assistance en Australie par type de logiciel
Service d'assistance Web
Service d'assistance sur site
Service d'assistance d'entreprise
Service d'assistance open source
Automatisation des services d'assistance en Australie par solution
Tri des tickets
Planification des tickets
Gestion des alertes
Autres
Automatisation des services d'assistance en Australie par taille d'organisation
Grandes entreprises
Petites et moyennes entreprises
Automatisation des services d'assistance en Australie par utilisateur final
BFSI
Commerce de détail
Santé
Automobile
Télécommunications
Éducation
Gouvernement
Perspectives pour le reste de la région Asie-Pacifique (milliards USD, 2018-2032)
Automatisation des services d'assistance dans le reste de la région Asie-Pacifique par type de logiciel
Service d'assistance Web
Service d'assistance sur site
Service d'assistance d'entreprise
Service d'assistance open source
Automatisation des services d'assistance dans le reste de la région Asie-Pacifique par solution
Tri des tickets
Planification des tickets
Gestion des alertes
Autres
Automatisation des services d'assistance dans le reste de la région Asie-Pacifique par taille d'organisation
Grandes entreprises
Petites et moyennes entreprises
Automatisation des services d'assistance dans le reste de la région Asie-Pacifique par utilisateur final
BFSI
Commerce de détail
Santé
Automobile
Télécommunications
Éducation
Gouvernement
Perspectives pour le reste du monde (milliards USD, 2018-2032)
Automatisation des services d'assistance dans le reste du monde par type de logiciel
Service d'assistance Web
Service d'assistance sur site
Service d'assistance d'entreprise
Service d'assistance open source
Automatisation des services d'assistance dans le reste du monde par solution
Tri des tickets
Planification des tickets
Gestion des alertes
Autres
Automatisation des services d'assistance dans le reste du monde par taille d'organisation
Grandes entreprises
Petites et moyennes entreprises
Automatisation des services d'assistance dans le reste du monde par utilisateur final
BFSI
Commerce de détail
Santé
Automobile
Télécommunications
Éducation
Gouvernement
Perspectives pour le Moyen-Orient (milliards USD, 2018-2032)
Automatisation des services d'assistance au Moyen-Orient par type de logiciel
Service d'assistance Web
Service d'assistance sur site
Service d'assistance d'entreprise
Service d'assistance open source
Automatisation des services d'assistance au Moyen-Orient par solution
Tri des tickets
Planification des tickets
Gestion des alertes
Autres
Automatisation des services d'assistance au Moyen-Orient par taille d'organisation
Grandes entreprises
Petites et moyennes entreprises
Automatisation des services d'assistance au Moyen-Orient par utilisateur final
BFSI
Commerce de détail
Santé
Automobile
Télécommunications
Éducation
Gouvernement
Perspectives pour l'Afrique (milliards USD, 2018-2032)
Automatisation des services d'assistance en Afrique par type de logiciel
Service d'assistance Web
Service d'assistance sur site
Service d'assistance d'entreprise
Service d'assistance open source
Automatisation des services d'assistance en Afrique par solution
Tri des tickets
Planification des tickets
Gestion des alertes
Autres
Automatisation des services d'assistance en Afrique par taille d'organisation
Grandes entreprises
Petites et moyennes entreprises
Automatisation des services d'assistance en Afrique par utilisateur final
BFSI
Commerce de détail
Santé
Automobile
Télécommunications
Éducation
Gouvernement
Perspectives pour l'Amérique latine (milliards USD, 2018-2032)
Automatisation des services d'assistance en Amérique latine par type de logiciel
Service d'assistance Web
Service d'assistance sur site
Service d'assistance d'entreprise
Service d'assistance open source
Automatisation des services d'assistance en Amérique latine par solution
Tri des tickets
Planification des tickets
Gestion des alertes
Autres
Automatisation des services d'assistance en Amérique latine par taille d'organisation
Grandes entreprises
Petites et moyennes entreprises
Automatisation des services d'assistance en Amérique latine par utilisateur final
BFSI
Commerce de détail
Santé
Automobile
Télécommunications
Éducation
Gouvernement