
Marché de la construction écologique
Rapport de recherche sur le marché des bâtiments écologiques Informations par produit (Intérieurs, Extérieurs), application (Résidentiel, Non résidentiel) et par région (Amérique du Nord, Europe, Asie-Pacifique et reste du monde) – Prévisions du marché jusqu'en 2035

- 1 Résumé Exécutif
-
2 Introduction au Marché
- 2.1 Définition 16
- 2.2 Portée de l'Étude 16
- 2.3 Liste des Hypothèses 16
- 2.4 Structure du Marché 17
- 2.5 Points Clés 17
- 2.6 Critères d'Achat Clés 18
-
3 Méthodologie de Recherche
- 3.1 Processus de Recherche 20
- 3.2 Recherche Primaire 20
- 3.3 Recherche Secondaire 21
- 3.4 Estimation de la Taille du Marché 22
- 3.5 Modèle de Prévision 23
-
4 Dynamiques du Marché
- 4.1 Introduction 25
-
4.2 Facteurs de Croissance 25
- 4.2.1 Croissance du Concept de Bâtiment Vert 25
- 4.2.2 Gestion des Coûts des Bâtiments Verts 26
- 4.2.3 Loyers et Valeurs Plus Élevés 26
- 4.2.4 Impact sur la Productivité et la Santé au Travail 26
- 4.2.5 Analyse d'Impact des Facteurs de Croissance 27
-
4.3 Contraintes 27
- 4.3.1 Retards dans l'Obtention de Certifications et de Permis 27
- 4.3.2 Analyse d'Impact des Contraintes 27
-
4.4 Opportunité 28
- 4.4.1 Durabilité dans les Économies Émergentes et le Monde en Développement 28
-
5 Analyse des Facteurs du Marché
-
5.1 Analyse de la Chaîne d'Approvisionnement 30
- 5.1.1 Acquisition de Matériaux 30
- 5.1.2 Conception des Composants 30
- 5.1.3 Construction/Rénovation 30
- 5.1.4 Gestion des Installations 31
-
5.2 Modèle des Cinq Forces de Porter 31
- 5.2.1 Menace des Nouveaux Entrants 31
- 5.2.2 Pouvoir de Négociation des Fournisseurs 31
- 5.2.3 Pouvoir de Négociation des Acheteurs 32
- 5.2.4 Menace des Substituts 32
- 5.2.5 Intensité de la Rivalité 32
- 5.3 Initiatives Politiques pour les Bâtiments Verts en Inde 32
-
5.4 Incitations Fiscales pour les Bâtiments Verts 33
- 5.4.1 Gouvernement de l'Inde 33
- 5.4.2 Gouvernements des États/Organismes Locaux 33
- 5.4.3 Institutions Financières 33
-
5.1 Analyse de la Chaîne d'Approvisionnement 30
-
6 Marché Mondial des Bâtiments Verts, par Produit
-
6.1 Aperçu 35
- 6.1.1 Produits Extérieurs 35
- 6.1.2 Produits Intérieurs 35
-
6.1 Aperçu 35
-
7 Marché Mondial des Bâtiments Verts, par Application
-
7.1 Aperçu 38
- 7.1.1 Résidentiel 38
- 7.1.2 Non-Résidentiel 38
-
7.1 Aperçu 38
-
8 Marché Mondial des Bâtiments Verts, par Région
- 8.1 Introduction 41
-
8.2 Amérique du Nord 43
- 8.2.1 États-Unis 44
- 8.2.2 Canada 45
- 8.2.3 Mexique 46
-
8.3 Europe 47
- 8.3.1 Allemagne 48
- 8.3.2 Royaume-Uni 49
- 8.3.3 Norvège 50
- 8.3.4 Pologne 50
- 8.3.5 France 51
- 8.3.6 Reste de l'Europe 52
-
8.4 Asie-Pacifique 53
- 8.4.1 Chine 55
- 8.4.2 Japon 55
- 8.4.3 Inde 56
- 8.4.4 Corée du Sud 57
- 8.4.5 Australie 58
- 8.4.6 Singapour 58
- 8.4.7 Hong Kong 59
- 8.4.8 Reste de l'Asie-Pacifique 60
-
8.5 Moyen-Orient et Afrique 61
- 8.5.1 Moyen-Orient 62
- 8.5.2 Afrique 62
- 9 Paysage Concurrentiel
-
10 Profils d'Entreprises
-
10.1 E. I. du Pont de Nemours and Company 67
- 10.1.1 Aperçu de l'Entreprise 67
- 10.1.2 Aperçu Financier 67
- 10.1.3 Offres de Produits 68
- 10.1.4 Stratégie Clé 68
- 10.1.5 Analyse SWOT 68
-
10.2 Saint Global S.A. 69
- 10.2.1 Aperçu de l'Entreprise 69
- 10.2.2 Aperçu Financier 69
- 10.2.3 Offres de Produits 70
- 10.2.4 Stratégie Clé 70
- 10.2.5 Analyse SWOT 71
-
10.3 Wienerberger AG 72
- 10.3.1 Aperçu de l'Entreprise 72
- 10.3.2 Aperçu Financier 72
- 10.3.3 Offres de Produits 72
- 10.3.4 Stratégie Clé 72
- 10.3.5 Analyse SWOT 73
-
10.4 SGS 74
- 10.4.1 Aperçu de l'Entreprise 74
- 10.4.2 Aperçu Financier 74
- 10.4.3 Offres de Produits 74
- 10.4.4 Stratégie Clé 74
- 10.4.5 Analyse SWOT 75
-
10.5 Kingspan Group Plc. 76
- 10.5.1 Aperçu de l'Entreprise 76
- 10.5.2 Aperçu Financier 76
- 10.5.3 Offres de Produits 77
- 10.5.4 Stratégie Clé 77
- 10.5.5 Analyse SWOT 77
-
10.6 Bauder 78
- 10.6.1 Aperçu de l'Entreprise 78
- 10.6.2 Aperçu Financier 78
- 10.6.3 Offres de Produits 78
- 10.6.4 Stratégie Clé 78
-
10.7 NATiVE 79
- 10.7.1 Aperçu de l'Entreprise 79
- 10.7.2 Aperçu Financier 79
- 10.7.3 Offres de Produits 79
- 10.7.4 Stratégie Clé 80
-
10.8 Green Building Store 81
- 10.8.1 Aperçu de l'Entreprise 81
- 10.8.2 Aperçu Financier 81
- 10.8.3 Offres de Produits 81
- 10.8.4 Stratégie Clé 81
-
10.9 Ginkgo Sustainability Inc. 82
- 10.9.1 Aperçu de l'Entreprise 82
- 10.9.2 Aperçu Financier 82
- 10.9.3 Offres de Produits 82
- 10.9.4 Stratégie Clé 82
-
10.10 Green Build Products (I) Pvt Ltd 83
- 10.10.1 Aperçu de l'Entreprise 83
- 10.10.2 Aperçu Financier 83
- 10.10.3 Offres de Produits 83
- 10.10.4 Stratégie Clé 83
-
10.1 E. I. du Pont de Nemours and Company 67
-
11 Conclusion
-
11.1 Conclusions Clés 85
- 11.1.1 Entreprises Clés à Surveiller 85
- 11.1.2 Prédiction 85
-
11.1 Conclusions Clés 85
- 12 Annexe
-
13 Liste des Tableaux
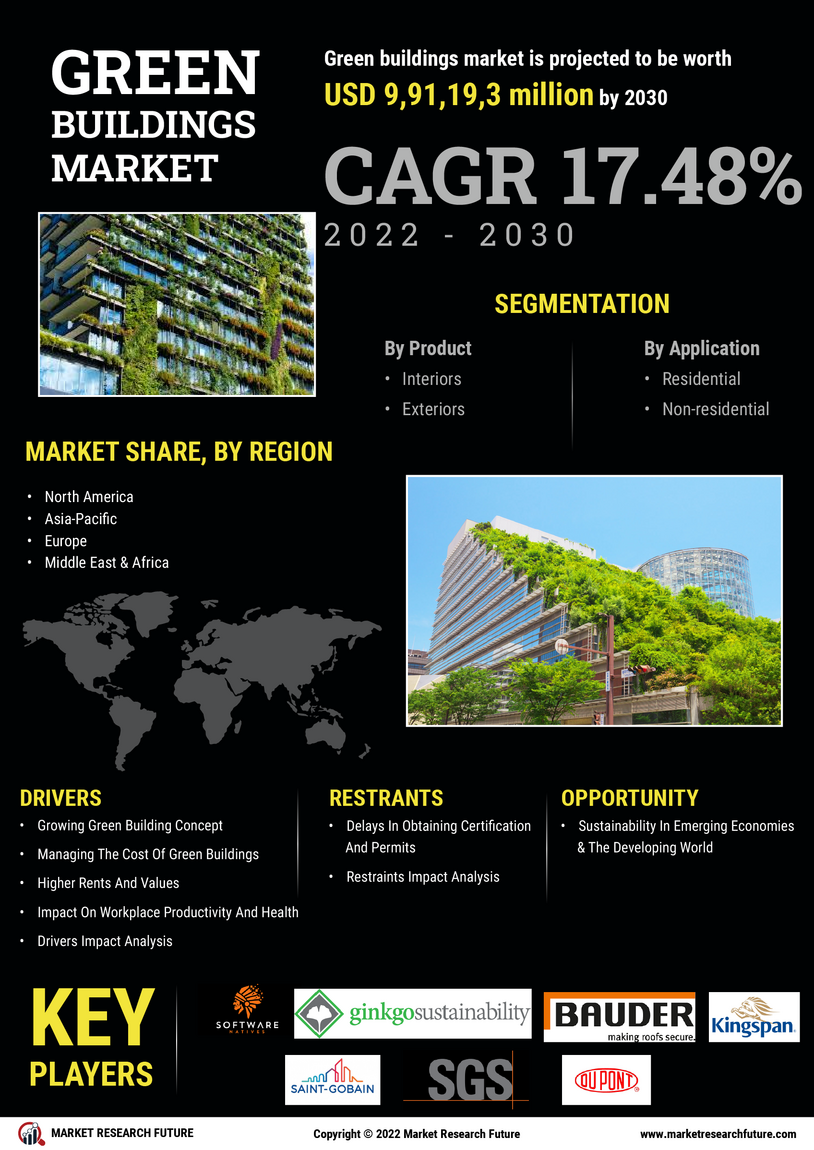
- TABLEAU 1 SYNOPSIS DU MARCHÉ 14
- TABLEAU 2 LISTE DES HYPOTHÈSES 16
- TABLEAU 3 TAILLE DU MARCHÉ MONDIAL DES BÂTIMENTS VERTS, PAR PRODUIT, 2020-2027 (MILLIONS USD) 36
- TABLEAU 4 MARCHÉ MONDIAL DES BÂTIMENTS VERTS, PAR APPLICATION, 2020-2027 (MILLIONS USD) 39
- TABLEAU 5 MARCHÉ MONDIAL DES BÂTIMENTS VERTS, PAR RÉGION, 2020-2027 (MILLIONS USD) 42
- TABLEAU 6 AMÉRIQUE DU NORD : MARCHÉ DES BÂTIMENTS VERTS, PAR PAYS, 2020-2027 (MILLIONS USD) 43
- TABLEAU 7 AMÉRIQUE DU NORD : MARCHÉ DES BÂTIMENTS VERTS, PAR PRODUIT, 2020-2027 (MILLIONS USD) 43
- TABLEAU 8 AMÉRIQUE DU NORD : MARCHÉ DES BÂTIMENTS VERTS, PAR APPLICATION, 2020-2027 (MILLIONS USD) 44
- TABLEAU 9 ÉTATS-UNIS : MARCHÉ DES BÂTIMENTS VERTS, PAR PRODUIT, 2020-2027 (MILLIONS USD) 44
- TABLEAU 10 ÉTATS-UNIS : MARCHÉ DES BÂTIMENTS VERTS, PAR APPLICATION, 2020-2027 (MILLIONS USD) 44
- TABLEAU 11 CANADA : MARCHÉ DES BÂTIMENTS VERTS, PAR PRODUIT, 2020-2027 (MILLIONS USD) 45
- TABLEAU 12 CANADA : MARCHÉ DES BÂTIMENTS VERTS, PAR APPLICATION, 2020-2027 (MILLIONS USD) 45
- TABLEAU 13 MEXIQUE : MARCHÉ DES BÂTIMENTS VERTS, PAR PRODUIT, 2020-2027 (MILLIONS USD) 46
- TABLEAU 14 MEXIQUE : MARCHÉ DES BÂTIMENTS VERTS, PAR APPLICATION, 2020-2027, (MILLIONS USD) 46
- TABLEAU 15 EUROPE : MARCHÉ DES BÂTIMENTS VERTS, PAR PAYS, 2020-2027 (MILLIONS USD) 47
- TABLEAU 16 EUROPE : MARCHÉ DES BÂTIMENTS VERTS, PAR PRODUIT, 2020-2027 (MILLIONS USD) 48
- TABLEAU 17 EUROPE : MARCHÉ DES BÂTIMENTS VERTS, PAR APPLICATION, 2020-2027 (MILLIONS USD) 48
- TABLEAU 18 ALLEMAGNE : MARCHÉ DES BÂTIMENTS VERTS, PAR PRODUIT, 2020-2027 (MILLIONS USD) 48
- TABLEAU 19 ALLEMAGNE : MARCHÉ DES BÂTIMENTS VERTS, PAR APPLICATION, 2020-2027 (MILLIONS USD) 49
- TABLEAU 20 ROYAUME-UNI : MARCHÉ DES BÂTIMENTS VERTS, PAR PRODUIT, 2020-2027 (MILLIONS USD) 49
- TABLEAU 21 ROYAUME-UNI : MARCHÉ DES BÂTIMENTS VERTS, PAR APPLICATION, 2020-2027 (MILLIONS USD) 49
- TABLEAU 22 NORVÈGE : MARCHÉ DES BÂTIMENTS VERTS, PAR PRODUIT, 2020-2027 (MILLIONS USD) 50
- TABLEAU 23 NORVÈGE : MARCHÉ DES BÂTIMENTS VERTS, PAR APPLICATION, 2020-2027 (MILLIONS USD) 50
- TABLEAU 24 POLOGNE : MARCHÉ DES BÂTIMENTS VERTS, PAR PRODUIT, 2020-2027 (MILLIONS USD) 51
- TABLEAU 25 POLOGNE : MARCHÉ DES BÂTIMENTS VERTS, PAR APPLICATION, 2020-2027 (MILLIONS USD) 51
- TABLEAU 26 FRANCE : MARCHÉ DES BÂTIMENTS VERTS, PAR PRODUIT, 2020-2027 (MILLIONS USD) 51
- TABLEAU 27 FRANCE : MARCHÉ DES BÂTIMENTS VERTS, PAR APPLICATION, 2020-2027 (MILLIONS USD) 52
- TABLEAU 28 RESTE DE L'EUROPE : MARCHÉ DES BÂTIMENTS VERTS, PAR PRODUIT, 2020-2027 (MILLIONS USD) 52
- TABLEAU 29 RESTE DE L'EUROPE : MARCHÉ DES BÂTIMENTS VERTS, PAR APPLICATION, 2020-2027 (MILLIONS USD) 52
- TABLEAU 30 ASIE-PACIFIQUE : MARCHÉ DES BÂTIMENTS VERTS, PAR PAYS, 2020-2027 (MILLIONS USD) 53
- TABLEAU 31 ASIE-PACIFIQUE : MARCHÉ DES BÂTIMENTS VERTS, PAR PRODUIT, 2020-2027 (MILLIONS USD) 54
- TABLEAU 32 ASIE-PACIFIQUE : MARCHÉ DES BÂTIMENTS VERTS, PAR APPLICATION, 2020-2027 (MILLIONS USD) 54
- TABLEAU 33 CHINE : MARCHÉ DES BÂTIMENTS VERTS, PAR PRODUIT, 2020-2027 (MILLIONS USD) 55
- TABLEAU 34 CHINE : MARCHÉ DES BÂTIMENTS VERTS, PAR APPLICATION, 2020-2027 (MILLIONS USD) 55
- TABLEAU 35 JAPON : MARCHÉ DES BÂTIMENTS VERTS, PAR PRODUIT, 2020-2027 (MILLIONS USD) 56
- TABLEAU 36 JAPON : MARCHÉ DES BÂTIMENTS VERTS, PAR APPLICATION, 2020-2027 (MILLIONS USD) 56
- TABLEAU 37 INDE : MARCHÉ DES BÂTIMENTS VERTS, PAR PRODUIT, 2020-2027 (MILLIONS USD) 56
- TABLEAU 38 INDE : MARCHÉ DES BÂTIMENTS VERTS, PAR APPLICATION, 2020-2027 (MILLIONS USD) 57
- TABLEAU 39 CORÉE DU SUD : MARCHÉ DES BÂTIMENTS VERTS, PAR PRODUIT, 2020-2027 (MILLIONS USD) 57
- TABLEAU 40 CORÉE DU SUD : MARCHÉ DES BÂTIMENTS VERTS, PAR APPLICATION, 2020-2027 (MILLIONS USD) 57
- TABLEAU 41 AUSTRALIE : MARCHÉ DES BÂTIMENTS VERTS, PAR PRODUIT, 2020-2027 (MILLIONS USD) 58
- TABLEAU 42 AUSTRALIE : MARCHÉ DES BÂTIMENTS VERTS, PAR APPLICATION, 2020-2027 (MILLIONS USD) 58
- TABLEAU 43 SINGAPOUR : MARCHÉ DES BÂTIMENTS VERTS, PAR PRODUIT, 2020-2027 (MILLIONS USD) 59
- TABLEAU 44 SINGAPOUR : MARCHÉ DES BÂTIMENTS VERTS, PAR APPLICATION, 2020-2027 (MILLIONS USD) 59
- TABLEAU 45 HONG KONG : MARCHÉ DES BÂTIMENTS VERTS, PAR PRODUIT, 2020-2027 (MILLIONS USD) 59
- TABLEAU 46 HONG KONG : MARCHÉ DES BÂTIMENTS VERTS, PAR APPLICATION, 2020-2027 (MILLIONS USD) 60
- TABLEAU 47 RESTE DE L'APAC : MARCHÉ DES BÂTIMENTS VERTS, PAR PRODUIT, 2020-2027 (MILLIONS USD) 60
- TABLEAU 48 RESTE DE L'APAC : MARCHÉ DES BÂTIMENTS VERTS, PAR APPLICATION, 2020-2027 (MILLIONS USD) 60
- TABLEAU 49 MOYEN-ORIENT ET AFRIQUE : MARCHÉ DES BÂTIMENTS VERTS, PAR RÉGION, 2020-2027 (MILLIONS USD) 61
- TABLEAU 50 MOYEN-ORIENT ET AFRIQUE : MARCHÉ DES BÂTIMENTS VERTS, PAR PRODUIT, 2020-2027 (MILLIONS USD) 61
- TABLEAU 51 MOYEN-ORIENT ET AFRIQUE : MARCHÉ DES BÂTIMENTS VERTS, PAR APPLICATION, 2020-2027 (MILLIONS USD) 61
- TABLEAU 52 MOYEN-ORIENT : MARCHÉ DES BÂTIMENTS VERTS, PAR PRODUIT, 2020-2027 (MILLIONS USD) 62
- TABLEAU 53 MOYEN-ORIENT : MARCHÉ DES BÂTIMENTS VERTS, PAR APPLICATION, 2020-2027 (MILLIONS USD) 62
- TABLEAU 54 AFRIQUE : MARCHÉ DES BÂTIMENTS VERTS, PAR PRODUIT, 2020-2027 (MILLIONS USD) 63
- TABLEAU 55 AFRIQUE : MARCHÉ DES BÂTIMENTS VERTS, PAR APPLICATION, 2020-2027 (MILLIONS USD) 63
- 14 Liste des Figures
- FIGURE 1 BÂTIMENT VERT MONDIAL : STRUCTURE DU MARCHÉ 17
- FIGURE 2 POINTS CLÉS DU BÂTIMENT VERT 17
- FIGURE 3 CRITÈRES D'ACHAT CLÉS DU MARCHÉ DES BÂTIMENTS VERTS 18
- FIGURE 4 PROCESSUS DE RECHERCHE DE MRFR 20
- FIGURE 5 APPROCHE DE HAUT EN BAS & DE BAS EN HAUT 23
- FIGURE 6 ANALYSE DROC DU MARCHÉ MONDIAL DES BÂTIMENTS VERTS 25
- FIGURE 7 ANALYSE D'IMPACT DES FACTEURS DE CROISSANCE : BÂTIMENT VERT MONDIAL 27
- FIGURE 8 ANALYSE D'IMPACT DES CONTRAINTES : MARCHÉ DES BÂTIMENTS VERTS 27
- FIGURE 9 CHAÎNE D'APPROVISIONNEMENT : BÂTIMENT VERT 30
- FIGURE 10 ANALYSE DES CINQ FORCES DE PORTER DU MARCHÉ MONDIAL DES BÂTIMENTS VERTS 31
- FIGURE 11 PART DE MARCHÉ MONDIALE DES BÂTIMENTS VERTS, PAR PRODUIT, 2020(%) 35
- FIGURE 12 PART DE MARCHÉ MONDIALE DES BÂTIMENTS VERTS, PAR APPLICATION, 2020(%) 38
- FIGURE 13 PART DE MARCHÉ MONDIALE DES BÂTIMENTS VERTS, PAR RÉGION, 2020(%) 41
- FIGURE 14 AMÉRIQUE DU NORD : PART DE MARCHÉ DES BÂTIMENTS VERTS, PAR PAYS, 2020(%) 43
- FIGURE 15 EUROPE : PART DE MARCHÉ DES BÂTIMENTS VERTS, PAR PAYS, 2020(%) 47
- FIGURE 16 ASIE-PACIFIQUE : MARCHÉ DES BÂTIMENTS VERTS, PAR PAYS, 2020(%) 53
- FIGURE 17 ASIE-PACIFIQUE : PART DE MARCHÉ DES BÂTIMENTS VERTS, PAR PRODUIT, 2020(%) 54
-
FIGURE 18 ANALYSE DE PART DE MARCHÉ : 2020(%) 65
- "
Customer Stories

“This is really good guys. Excellent work on a tight deadline. I will continue to use you going forward and recommend you to others. Nice job”

“Thanks. It’s been a pleasure working with you, please use me as reference with any other Intel employees.”

“Thanks for sending the report it gives us a good global view of the Betaïne market.”

“Thank you, this will be very helpful for OQS.”

“We found the report very insightful! we found your research firm very helpful. I'm sending this email to secure our future business.”

“I am very pleased with how market segments have been defined in a relevant way for my purposes (such as "Portable Freezers & refrigerators" and "last-mile"). In general the report is well structured. Thanks very much for your efforts.”

“I have been reading the first document or the study, ,the Global HVAC and FP market report 2021 till 2026. Must say, good info! I have not gone in depth at all parts, but got a good indication of the data inside!”

“We got the report in time, we really thank you for your support in this process. I also thank to all of your team as they did a great job.”
