Request Free Sample ×

Kindly complete the form below to receive a free sample of this Report

* Please use a valid business email

Leading companies partner with us for data-driven Insights

clients tt-cursor
Hero Background

Marché des logiciels de conception d'interface utilisateur graphique

ID: MRFR/ICT/9228-CR
100 Pages
Ankit Gupta
Last Updated: February 17, 2026

Rapport d'étude de marché sur les logiciels de conception d'interface utilisateur graphique : Informations par déploiement (sur le cloud et sur site), par taille d'organisation (PME et grandes entreprises), par secteur (automobile, IT et télécommunications, médias et divertissement, médical et santé, et fabrication), et par région (Amérique du Nord, Europe, Asie-Pacifique, et reste du monde) – Prévisions de marché jusqu'en 2035.

Partager
Download PDF ×

We do not share your information with anyone. However, we may send you emails based on your report interest from time to time. You may contact us at any time to opt-out.

  1. SECTION I : RÉSUMÉ EXÉCUTIF ET POINTS CLÉS\n\n
    1. 1.1 RÉSUMÉ EXÉCUTIF\n \n
      1. 1.1.1 Vue d'ensemble du marché\n \n
      2. 1.1.2 Conclusions clés\n \n
      3. 1.1.3 Segmentation du marché\n \n
      4. 1.1.4 Paysage concurrentiel\n \n
      5. 1.1.5 Défis et opportunités\n \n
      6. 1.1.6 Perspectives futures\n2
  2. SECTION II : DÉLIMITATION, MÉTHODOLOGIE ET STRUCTURE DU MARCHÉ\n
    1. 2.1 INTRODUCTION AU MARCHÉ\n \n
      1. 2.1.1 Définition\n \n
      2. 2.1.2 Portée de l'étude\n \n \n
        1. 2.1.2.1 Objectif de recherche\n \n \n
        2. 2.1.2.2 Hypothèse\n \n \n
        3. 2.1.2.3 Limitations\n
    2. 2.2 MÉTHODOLOGIE DE RECHERCHE\n \n
      1. 2.2.1 Vue d'ensemble\n \n
      2. 2.2.2 Exploration de données\n \n
      3. 2.2.3 Recherche secondaire\n \n
      4. 2.2.4 Recherche primaire\n \n \n
        1. 2.2.4.1 Interviews primaires et processus de collecte d'informations\n \n \n
        2. 2.2.4.2 Répartition des répondants principaux\n \n
      5. 2.2.5 Modèle de prévision\n \n
      6. 2.2.6 Estimation de la taille du marché\n \n \n
        1. 2.2.6.1 Approche ascendante\n \n \n
        2. 2.2.6.2 Approche descendante\n \n
      7. 2.2.7 Triangulation des données\n \n
      8. 2.2.8 Validation\n3
  3. SECTION III : ANALYSE QUALITATIVE\n
    1. 3.1 DYNAMIQUE DU MARCHÉ\n \n
      1. 3.1.1 Vue d'ensemble\n \n
      2. 3.1.2 Facteurs moteurs\n \n
      3. 3.1.3 Contraintes\n \n
      4. 3.1.4 Opportunités\n
    2. 3.2 ANALYSE DES FACTEURS DU MARCHÉ\n \n
      1. 3.2.1 Analyse de la chaîne de valeur\n \n
      2. 3.2.2 Analyse des cinq forces de Porter\n \n \n
        1. 3.2.2.1 Pouvoir de négociation des fournisseurs\n \n \n
        2. 3.2.2.2 Pouvoir de négociation des acheteurs\n \n \n
        3. 3.2.2.3 Menace des nouveaux entrants\n \n \n
        4. 3.2.2.4 Menace des substituts\n \n \n
        5. 3.2.2.5 Intensité de la rivalité\n \n
      3. 3.2.3 Analyse de l'impact du COVID-19\n \n \n
        1. 3.2.3.1 Analyse de l'impact sur le marché\n \n \n
        2. 3.2.3.2 Impact régional\n \n \n
        3. 3.2.3.3 Analyse des opportunités et des menaces\n4
  4. SECTION IV : ANALYSE QUANTITATIVE\n
    1. 4.1 Technologies de l'information et de la communication, PAR Déploiement (milliards USD)\n \n
      1. 4.1.1 Sur le cloud\n \n
      2. 4.1.2 Sur site\n
    2. 4.2 Technologies de l'information et de la communication, PAR Taille d'organisation (milliards USD)\n \n
      1. 4.2.1 PME\n \n
      2. 4.2.2 Grandes entreprises\n
    3. 4.3 Technologies de l'information et de la communication, PAR Secteur (milliards USD)\n \n
      1. 4.3.1 Automobile\n \n
      2. 4.3.2 TI et télécommunications\n \n
      3. 4.3.3 Médias et divertissement\n \n
      4. 4.3.4 Médical et santé\n \n
      5. 4.3.5 Fabrication\n
    4. 4.4 Technologies de l'information et de la communication, PAR Région (milliards USD)\n \n
      1. 4.4.1 Amérique du Nord\n \n \n
        1. 4.4.1.1 États-Unis\n \n \n
        2. 4.4.1.2 Canada\n \n
      2. 4.4.2 Europe\n \n \n
        1. 4.4.2.1 Allemagne\n \n \n
        2. 4.4.2.2 Royaume-Uni\n \n \n
        3. 4.4.2.3 France\n \n \n
        4. 4.4.2.4 Russie\n \n \n
        5. 4.4.2.5 Italie\n \n \n
        6. 4.4.2.6 Espagne\n \n \n
        7. 4.4.2.7 Reste de l'Europe\n \n
      3. 4.4.3 APAC\n \n \n
        1. 4.4.3.1 Chine\n \n \n
        2. 4.4.3.2 Inde\n \n \n
        3. 4.4.3.3 Japon\n \n \n
        4. 4.4.3.4 Corée du Sud\n \n \n
        5. 4.4.3.5 Malaisie\n \n \n
        6. 4.4.3.6 Thaïlande\n \n \n
        7. 4.4.3.7 Indonésie\n \n \n
        8. 4.4.3.8 Reste de l'APAC\n \n
      4. 4.4.4 Amérique du Sud\n \n \n
        1. 4.4.4.1 Brésil\n \n \n
        2. 4.4.4.2 Mexique\n \n \n
        3. 4.4.4.3 Argentine\n \n \n
        4. 4.4.4.4 Reste de l'Amérique du Sud\n \n
      5. 4.4.5 MEA\n \n \n
        1. 4.4.5.1 Pays du CCG\n \n \n
        2. 4.4.5.2 Afrique du Sud\n \n \n
        3. 4.4.5.3 Reste de la MEA\n5
  5. SECTION V : ANALYSE CONCURRENTIELLE\n
    1. 5.1 Paysage concurrentiel\n \n
      1. 5.1.1 Vue d'ensemble\n \n
      2. 5.1.2 Analyse concurrentielle\n \n
      3. 5.1.3 Analyse de la part de marché\n \n
      4. 5.1.4 Stratégie de croissance majeure dans les technologies de l'information et de la communication\n \n
      5. 5.1.5 Évaluation comparative\n \n
      6. 5.1.6 Acteurs principaux en termes de nombre de développements dans les technologies de l'information et de la communication\n \n
      7. 5.1.7 Développements clés et stratégies de croissance\n \n \n
        1. 5.1.7.1 Lancement de nouveaux produits / Déploiement de services\n \n \n
        2. 5.1.7.2 Fusions et acquisitions\n \n \n
        3. 5.1.7.3 Coentreprises\n \n
      8. 5.1.8 Matrice financière des principaux acteurs\n \n \n
        1. 5.1.8.1 Ventes et revenu d'exploitation\n \n \n
        2. 5.1.8.2 Dépenses de R&D des principaux acteurs. 2023\n
    2. 5.2 Profils d'entreprise\n \n
      1. 5.2.1 Adobe (États-Unis)\n \n \n
        1. 5.2.1.1 Vue d'ensemble financière\n \n \n
        2. 5.2.1.2 Produits offerts\n \n \n
        3. 5.2.1.3 Développements clés\n \n \n
        4. 5.2.1.4 Analyse SWOT\n \n \n
        5. 5.2.1.5 Stratégies clés\n \n
      2. 5.2.2 Figma (États-Unis)\n \n \n
        1. 5.2.2.1 Vue d'ensemble financière\n \n \n
        2. 5.2.2.2 Produits offerts\n \n \n
        3. 5.2.2.3 Développements clés\n \n \n
        4. 5.2.2.4 Analyse SWOT\n \n \n
        5. 5.2.2.5 Stratégies clés\n \n
      3. 5.2.3 Sketch (États-Unis)\n \n \n
        1. 5.2.3.1 Vue d'ensemble financière\n \n \n
        2. 5.2.3.2 Produits offerts\n \n \n
        3. 5.2.3.3 Développements clés\n \n \n
        4. 5.2.3.4 Analyse SWOT\n \n \n
        5. 5.2.3.5 Stratégies clés\n \n
      4. 5.2.4 InVision (États-Unis)\n \n \n
        1. 5.2.4.1 Vue d'ensemble financière\n \n \n
        2. 5.2.4.2 Produits offerts\n \n \n
        3. 5.2.4.3 Développements clés\n \n \n
        4. 5.2.4.4 Analyse SWOT\n \n \n
        5. 5.2.4.5 Stratégies clés\n \n
      5. 5.2.5 Axure (États-Unis)\n \n \n
        1. 5.2.5.1 Vue d'ensemble financière\n \n \n
        2. 5.2.5.2 Produits offerts\n \n \n
        3. 5.2.5.3 Développements clés\n \n \n
        4. 5.2.5.4 Analyse SWOT\n \n \n
        5. 5.2.5.5 Stratégies clés\n \n
      6. 5.2.6 Balsamiq (États-Unis)\n \n \n
        1. 5.2.6.1 Vue d'ensemble financière\n \n \n
        2. 5.2.6.2 Produits offerts\n \n \n
        3. 5.2.6.3 Développements clés\n \n \n
        4. 5.2.6.4 Analyse SWOT\n \n \n
        5. 5.2.6.5 Stratégies clés\n \n
      7. 5.2.7 Corel (Canada)\n \n \n
        1. 5.2.7.1 Vue d'ensemble financière\n \n \n
        2. 5.2.7.2 Produits offerts\n \n \n
        3. 5.2.7.3 Développements clés\n \n \n
        4. 5.2.7.4 Analyse SWOT\n \n \n
        5. 5.2.7.5 Stratégies clés\n \n
      8. 5.2.8 Microsoft (États-Unis)\n \n \n
        1. 5.2.8.1 Vue d'ensemble financière\n \n \n
        2. 5.2.8.2 Produits offerts\n \n \n
        3. 5.2.8.3 Développements clés\n \n \n
        4. 5.2.8.4 Analyse SWOT\n \n \n
        5. 5.2.8.5 Stratégies clés\n \n
      9. 5.2.9 Canva (Australie)\n \n \n
        1. 5.2.9.1 Vue d'ensemble financière\n \n \n
        2. 5.2.9.2 Produits offerts\n \n \n
        3. 5.2.9.3 Développements clés\n \n \n
        4. 5.2.9.4 Analyse SWOT\n \n \n
        5. 5.2.9.5 Stratégies clés\n
    3. 5.3 Annexe\n \n
      1. 5.3.1 Références\n \n
      2. 5.3.2 Rapports connexes\n6 LISTE DES FIGURES\n
    4. 6.1 SYNOPSIS DU MARCHÉ\n
    5. 6.2 ANALYSE DU MARCHÉ EN AMÉRIQUE DU NORD\n
    6. 6.3 ANALYSE DU MARCHÉ AUX ÉTATS-UNIS PAR DÉPLOIEMENT\n
    7. 6.4 ANALYSE DU MARCHÉ AUX ÉTATS-UNIS PAR TAILLE D'ORGANISATION\n
    8. 6.5 ANALYSE DU MARCHÉ AUX ÉTATS-UNIS PAR SECTEUR\n
    9. 6.6 ANALYSE DU MARCHÉ AU CANADA PAR DÉPLOIEMENT\n
    10. 6.7 ANALYSE DU MARCHÉ AU CANADA PAR TAILLE D'ORGANISATION\n
    11. 6.8 ANALYSE DU MARCHÉ AU CANADA PAR SECTEUR\n
    12. 6.9 ANALYSE DU MARCHÉ EN EUROPE\n
    13. 6.10 ANALYSE DU MARCHÉ EN ALLEMAGNE PAR DÉPLOIEMENT\n
    14. 6.11 ANALYSE DU MARCHÉ EN ALLEMAGNE PAR TAILLE D'ORGANISATION\n
    15. 6.12 ANALYSE DU MARCHÉ EN ALLEMAGNE PAR SECTEUR\n
    16. 6.13 ANALYSE DU MARCHÉ AU ROYAUME-UNI PAR DÉPLOIEMENT\n
    17. 6.14 ANALYSE DU MARCHÉ AU ROYAUME-UNI PAR TAILLE D'ORGANISATION\n
    18. 6.15 ANALYSE DU MARCHÉ AU ROYAUME-UNI PAR SECTEUR\n
    19. 6.16 ANALYSE DU MARCHÉ EN FRANCE PAR DÉPLOIEMENT\n
    20. 6.17 ANALYSE DU MARCHÉ EN FRANCE PAR TAILLE D'ORGANISATION\n
    21. 6.18 ANALYSE DU MARCHÉ EN FRANCE PAR SECTEUR\n
    22. 6.19 ANALYSE DU MARCHÉ EN RUSSIE PAR DÉPLOIEMENT\n
    23. 6.20 ANALYSE DU MARCHÉ EN RUSSIE PAR TAILLE D'ORGANISATION\n
    24. 6.21 ANALYSE DU MARCHÉ EN RUSSIE PAR SECTEUR\n
    25. 6.22 ANALYSE DU MARCHÉ EN ITALIE PAR DÉPLOIEMENT\n
    26. 6.23 ANALYSE DU MARCHÉ EN ITALIE PAR TAILLE D'ORGANISATION\n
    27. 6.24 ANALYSE DU MARCHÉ EN ITALIE PAR SECTEUR\n
    28. 6.25 ANALYSE DU MARCHÉ EN ESPAGNE PAR DÉPLOIEMENT\n
    29. 6.26 ANALYSE DU MARCHÉ EN ESPAGNE PAR TAILLE D'ORGANISATION\n
    30. 6.27 ANALYSE DU MARCHÉ EN ESPAGNE PAR SECTEUR\n
    31. 6.28 ANALYSE DU MARCHÉ DANS LE RESTE DE L'EUROPE PAR DÉPLOIEMENT\n
    32. 6.29 ANALYSE DU MARCHÉ DANS LE RESTE DE L'EUROPE PAR TAILLE D'ORGANISATION\n
    33. 6.30 ANALYSE DU MARCHÉ DANS LE RESTE DE L'EUROPE PAR SECTEUR\n
    34. 6.31 ANALYSE DU MARCHÉ EN APAC\n
    35. 6.32 ANALYSE DU MARCHÉ EN CHINE PAR DÉPLOIEMENT\n
    36. 6.33 ANALYSE DU MARCHÉ EN CHINE PAR TAILLE D'ORGANISATION\n
    37. 6.34 ANALYSE DU MARCHÉ EN CHINE PAR SECTEUR\n
    38. 6.35 ANALYSE DU MARCHÉ EN INDE PAR DÉPLOIEMENT\n
    39. 6.36 ANALYSE DU MARCHÉ EN INDE PAR TAILLE D'ORGANISATION\n
    40. 6.37 ANALYSE DU MARCHÉ EN INDE PAR SECTEUR\n
    41. 6.38 ANALYSE DU MARCHÉ AU JAPON PAR DÉPLOIEMENT\n
    42. 6.39 ANALYSE DU MARCHÉ AU JAPON PAR TAILLE D'ORGANISATION\n
    43. 6.40 ANALYSE DU MARCHÉ AU JAPON PAR SECTEUR\n
    44. 6.41 ANALYSE DU MARCHÉ EN CORÉE DU SUD PAR DÉPLOIEMENT\n
    45. 6.42 ANALYSE DU MARCHÉ EN CORÉE DU SUD PAR TAILLE D'ORGANISATION\n
    46. 6.43 ANALYSE DU MARCHÉ EN CORÉE DU SUD PAR SECTEUR\n
    47. 6.44 ANALYSE DU MARCHÉ EN MALAYSIE PAR DÉPLOIEMENT\n
    48. 6.45 ANALYSE DU MARCHÉ EN MALAYSIE PAR TAILLE D'ORGANISATION\n
    49. 6.46 ANALYSE DU MARCHÉ EN MALAYSIE PAR SECTEUR\n
    50. 6.47 ANALYSE DU MARCHÉ EN THAÏLANDE PAR DÉPLOIEMENT\n
    51. 6.48 ANALYSE DU MARCHÉ EN THAÏLANDE PAR TAILLE D'ORGANISATION\n
    52. 6.49 ANALYSE DU MARCHÉ EN THAÏLANDE PAR SECTEUR\n
    53. 6.50 ANALYSE DU MARCHÉ EN INDONÉSIE PAR DÉPLOIEMENT\n
    54. 6.51 ANALYSE DU MARCHÉ EN INDONÉSIE PAR TAILLE D'ORGANISATION\n
    55. 6.52 ANALYSE DU MARCHÉ EN INDONÉSIE PAR SECTEUR\n
    56. 6.53 ANALYSE DU MARCHÉ DANS LE RESTE DE L'APAC PAR DÉPLOIEMENT\n
    57. 6.54 ANALYSE DU MARCHÉ DANS LE RESTE DE L'APAC PAR TAILLE D'ORGANISATION\n
    58. 6.55 ANALYSE DU MARCHÉ DANS LE RESTE DE L'APAC PAR SECTEUR\n
    59. 6.56 ANALYSE DU MARCHÉ EN AMÉRIQUE DU SUD\n
    60. 6.57 ANALYSE DU MARCHÉ AU BRÉSIL PAR DÉPLOIEMENT\n
    61. 6.58 ANALYSE DU MARCHÉ AU BRÉSIL PAR TAILLE D'ORGANISATION\n
    62. 6.59 ANALYSE DU MARCHÉ AU BRÉSIL PAR SECTEUR\n
    63. 6.60 ANALYSE DU MARCHÉ AU MEXIQUE PAR DÉPLOIEMENT\n
    64. 6.61 ANALYSE DU MARCHÉ AU MEXIQUE PAR TAILLE D'ORGANISATION\n
    65. 6.62 ANALYSE DU MARCHÉ AU MEXIQUE PAR SECTEUR\n
    66. 6.63 ANALYSE DU MARCHÉ EN ARGENTINE PAR DÉPLOIEMENT\n
    67. 6.64 ANALYSE DU MARCHÉ EN ARGENTINE PAR TAILLE D'ORGANISATION\n
    68. 6.65 ANALYSE DU MARCHÉ EN ARGENTINE PAR SECTEUR\n
    69. 6.66 ANALYSE DU MARCHÉ DANS LE RESTE DE L'AMÉRIQUE DU SUD PAR DÉPLOIEMENT\n
    70. 6.67 ANALYSE DU MARCHÉ DANS LE RESTE DE L'AMÉRIQUE DU SUD PAR TAILLE D'ORGANISATION\n
    71. 6.68 ANALYSE DU MARCHÉ DANS LE RESTE DE L'AMÉRIQUE DU SUD PAR SECTEUR\n
    72. 6.69 ANALYSE DU MARCHÉ EN MEA\n
    73. 6.70 ANALYSE DU MARCHÉ DANS LES PAYS DU CCG PAR DÉPLOIEMENT\n
    74. 6.71 ANALYSE DU MARCHÉ DANS LES PAYS DU CCG PAR TAILLE D'ORGANISATION\n
    75. 6.72 ANALYSE DU MARCHÉ DANS LES PAYS DU CCG PAR SECTEUR\n
    76. 6.73 ANALYSE DU MARCHÉ EN AFRIQUE DU SUD PAR DÉPLOIEMENT\n
    77. 6.74 ANALYSE DU MARCHÉ EN AFRIQUE DU SUD PAR TAILLE D'ORGANISATION\n
    78. 6.75 ANALYSE DU MARCHÉ EN AFRIQUE DU SUD PAR SECTEUR\n
    79. 6.76 ANALYSE DU MARCHÉ DANS LE RESTE DE LA MEA PAR DÉPLOIEMENT\n
    80. 6.77 ANALYSE DU MARCHÉ DANS LE RESTE DE LA MEA PAR TAILLE D'ORGANISATION\n
    81. 6.78 ANALYSE DU MARCHÉ DANS LE RESTE DE LA MEA PAR SECTEUR\n
    82. 6.79 CRITÈRES D'ACHAT CLÉS DES TECHNOLOGIES DE L'INFORMATION ET DE LA COMMUNICATION\n
    83. 6.80 PROCESSUS DE RECHERCHE DE MRFR\n
    84. 6.81 ANALYSE DRO DE TECHNOLOGIES DE L'INFORMATION ET DE LA COMMUNICATION\n
    85. 6.82 ANALYSE D'IMPACT DES FACTEURS MOTRICES : TECHNOLOGIES DE L'INFORMATION ET DE LA COMMUNICATION\n
    86. 6.83 ANALYSE D'IMPACT DES CONTRAINTES : TECHNOLOGIES DE L'INFORMATION ET DE LA COMMUNICATION\n
    87. 6.84 CHAÎNE D'APPROVISIONNEMENT / CHAÎNE DE VALEUR : TECHNOLOGIES DE L'INFORMATION ET DE LA COMMUNICATION\n
    88. 6.85 TECHNOLOGIES DE L'INFORMATION ET DE LA COMMUNICATION, PAR DÉPLOIEMENT, 2024 (% PART)\n \n
    89. 6.86 TECHNOLOGIES DE L'INFORMATION ET DE LA COMMUNICATION, PAR DÉPLOIEMENT, 2024 À 2035 (milliards USD)\n \n
    90. 6.87 TECHNOLOGIES DE L'INFORMATION ET DE LA COMMUNICATION, PAR TAILLE D'ORGANISATION, 2024 (% PART)\n \n
    91. 6.88 TECHNOLOGIES DE L'INFORMATION ET DE LA COMMUNICATION, PAR TAILLE D'ORGANISATION, 2024 À 2035 (milliards USD)\n \n
    92. 6.89 TECHNOLOGIES DE L'INFORMATION ET DE LA COMMUNICATION, PAR SECTEUR, 2024 (% PART)\n \n
    93. 6.90 TECHNOLOGIES DE L'INFORMATION ET DE LA COMMUNICATION, PAR SECTEUR, 2024 À 2035 (milliards USD)\n \n
    94. 6.91 ÉVALUATION DES PRINCIPAUX CONCURRENTS\n7 LISTE DES TABLEAUX\n \n
    95. 7.1 LISTE DES HYPOTHÈSES\n \n
      1. 7.1.1 \n \n
    96. 7.2 ESTIMATIONS DE TAILLE DU MARCHÉ EN AMÉRIQUE DU NORD ; PRÉVISIONS\n \n
      1. 7.2.1 PAR DÉPLOIEMENT, 2025-2035 (milliards USD)\n \n
      2. 7.2.2 PAR TAILLE D'ORGANISATION, 2025-2035 (milliards USD)\n \n
      3. 7.2.3 PAR SECTEUR, 2025-2035 (milliards USD)\n \n
    97. 7.3 ESTIMATIONS DE TAILLE DU MARCHÉ AUX ÉTATS-UNIS ; PRÉVISIONS\n \n
      1. 7.3.1 PAR DÉPLOIEMENT, 2025-2035 (milliards USD)\n \n
      2. 7.3.2 PAR TAILLE D'ORGANISATION, 2025-2035 (milliards USD)\n \n
      3. 7.3.3 PAR SECTEUR, 2025-2035 (milliards USD)\n \n
    98. 7.4 ESTIMATIONS DE TAILLE DU MARCHÉ AU CANADA ; PRÉVISIONS\n \n
      1. 7.4.1 PAR DÉPLOIEMENT, 2025-2035 (milliards USD)\n \n
      2. 7.4.2 PAR TAILLE D'ORGANISATION, 2025-2035 (milliards USD)\n \n
      3. 7.4.3 PAR SECTEUR, 2025-2035 (milliards USD)\n \n
    99. 7.5 ESTIMATIONS DE TAILLE DU MARCHÉ EN EUROPE ; PRÉVISIONS\n \n
      1. 7.5.1 PAR DÉPLOIEMENT, 2025-2035 (milliards USD)\n \n
      2. 7.5.2 PAR TAILLE D'ORGANISATION, 2025-2035 (milliards USD)\n \n
      3. 7.5.3 PAR SECTEUR, 2025-2035 (milliards USD)\n \n
    100. 7.6 ESTIMATIONS DE TAILLE DU MARCHÉ EN ALLEMAGNE ; PRÉVISIONS\n \n
      1. 7.6.1 PAR DÉPLOIEMENT, 2025-2035 (milliards USD)\n \n
      2. 7.6.2 PAR TAILLE D'ORGANISATION, 2025-2035 (milliards USD)\n \n
      3. 7.6.3 PAR SECTEUR, 2025-2035 (milliards USD)\n \n
    101. 7.7 ESTIMATIONS DE TAILLE DU MARCHÉ AU ROYAUME-UNI ; PRÉVISIONS\n \n
      1. 7.7.1 PAR DÉPLOIEMENT, 2025-2035 (milliards USD)\n \n
      2. 7.7.2 PAR TAILLE D'ORGANISATION, 2025-2035 (milliards USD)\n \n
      3. 7.7.3 PAR SECTEUR, 2025-2035 (milliards USD)\n \n
    102. 7.8 ESTIMATIONS DE TAILLE DU MARCHÉ EN FRANCE ; PRÉVISIONS\n \n
      1. 7.8.1 PAR DÉPLOIEMENT, 2025-2035 (milliards USD)\n \n
      2. 7.8.2 PAR TAILLE D'ORGANISATION, 2025-2035 (milliards USD)\n \n
      3. 7.8.3 PAR SECTEUR, 2025-2035 (milliards USD)\n \n
    103. 7.9 ESTIMATIONS DE TAILLE DU MARCHÉ EN RUSSIE ; PRÉVISIONS\n \n
      1. 7.9.1 PAR DÉPLOIEMENT, 2025-2035 (milliards USD)\n \n
      2. 7.9.2 PAR TAILLE D'ORGANISATION, 2025-2035 (milliards USD)\n \n
      3. 7.9.3 PAR SECTEUR, 2025-2035 (milliards USD)\n \n
    104. 7.10 ESTIMATIONS DE TAILLE DU MARCHÉ EN ITALIE ; PRÉVISIONS\n \n
      1. 7.10.1 PAR DÉPLOIEMENT, 2025-2035 (milliards USD)\n \n
      2. 7.10.2 PAR TAILLE D'ORGANISATION, 2025-2035 (milliards USD)\n \n
      3. 7.10.3 PAR SECTEUR, 2025-2035 (milliards USD)\n \n
    105. 7.11 ESTIMATIONS DE TAILLE DU MARCHÉ EN ESPAGNE ; PRÉVISIONS\n \n
      1. 7.11.1 PAR DÉPLOIEMENT, 2025-2035 (milliards USD)\n \n
      2. 7.11.2 PAR TAILLE D'ORGANISATION, 2025-2035 (milliards USD)\n \n
      3. 7.11.3 PAR SECTEUR, 2025-2035 (milliards USD)\n \n
    106. 7.12 ESTIMATIONS DE TAILLE DU MARCHÉ DANS LE RESTE DE L'EUROPE ; PRÉVISIONS\n \n
      1. 7.12.1 PAR DÉPLOIEMENT, 2025-2035 (milliards USD)\n \n
      2. 7.12.2 PAR TAILLE D'ORGANISATION, 2025-2035 (milliards USD)\n \n
      3. 7.12.3 PAR SECTEUR, 2025-2035 (milliards USD)\n \n
    107. 7.13 ESTIMATIONS DE TAILLE DU MARCHÉ EN APAC ; PRÉVISIONS\n \n
      1. 7.13.1 PAR DÉPLOIEMENT, 2025-2035 (milliards USD)\n \n
      2. 7.13.2 PAR TAILLE D'ORGANISATION, 2025-2035 (milliards USD)\n \n
      3. 7.13.3 PAR SECTEUR, 2025-2035 (milliards USD)\n \n
    108. 7.14 ESTIMATIONS DE TAILLE DU MARCHÉ EN CHINE ; PRÉVISIONS\n \n
      1. 7.14.1 PAR DÉPLOIEMENT, 2025-2035 (milliards USD)\n \n
      2. 7.14.2 PAR TAILLE D'ORGANISATION, 2025-2035 (milliards USD)\n \n
      3. 7.14.3 PAR SECTEUR, 2025-2035 (milliards USD)\n \n
    109. 7.15 ESTIMATIONS DE TAILLE DU MARCHÉ EN INDE ; PRÉVISIONS\n \n
      1. 7.15.1 PAR DÉPLOIEMENT, 2025-2035 (milliards USD)\n \n
      2. 7.15.2 PAR TAILLE D'ORGANISATION, 2025-2035 (milliards USD)\n \n
      3. 7.15.3 PAR SECTEUR, 2025-2035 (milliards USD)\n \n
    110. 7.16 ESTIMATIONS DE TAILLE DU MARCHÉ AU JAPON ; PRÉVISIONS\n \n
      1. 7.16.1 PAR DÉPLOIEMENT, 2025-2035 (milliards USD)\n \n
      2. 7.16.2 PAR TAILLE D'ORGANISATION, 2025-2035 (milliards USD)\n \n
      3. 7.16.3 PAR SECTEUR, 2025-2035 (milliards USD)\n \n
    111. 7.17 ESTIMATIONS DE TAILLE DU MARCHÉ EN CORÉE DU SUD ; PRÉVISIONS\n \n
      1. 7.17.1 PAR DÉPLOIEMENT, 2025-2035 (milliards USD)\n \n
      2. 7.17.2 PAR TAILLE D'ORGANISATION, 2025-2035 (milliards USD)\n \n
      3. 7.17.3 PAR SECTEUR, 2025-2035 (milliards USD)\n \n
    112. 7.18 ESTIMATIONS DE TAILLE DU MARCHÉ EN MALAYSIE ; PRÉVISIONS\n \n
      1. 7.18.1 PAR DÉPLOIEMENT, 2025-2035 (milliards USD)\n \n
      2. 7.18.2 PAR TAILLE D'ORGANISATION, 2025-2035 (milliards USD)\n \n
      3. 7.18.3 PAR SECTEUR, 2025-2035 (milliards USD)\n \n
    113. 7.19 ESTIMATIONS DE TAILLE DU MARCHÉ EN THAÏLANDE ; PRÉVISIONS\n \n
      1. 7.19.1 PAR DÉPLOIEMENT, 2025-2035 (milliards USD)\n \n
      2. 7.19.2 PAR TAILLE D'ORGANISATION, 2025-2035 (milliards USD)\n \n
      3. 7.19.3 PAR SECTEUR, 2025-2035 (milliards USD)\n \n
    114. 7.20 ESTIMATIONS DE TAILLE DU MARCHÉ EN INDONÉSIE ; PRÉVISIONS\n \n
      1. 7.20.1 PAR DÉPLOIEMENT, 2025-2035 (milliards USD)\n \n
      2. 7.20.2 PAR TAILLE D'ORGANISATION, 2025-2035 (milliards USD)\n \n
      3. 7.20.3 PAR SECTEUR, 2025-2035 (milliards USD)\n \n
    115. 7.21 ESTIMATIONS DE TAILLE DU MARCHÉ DANS LE RESTE DE L'APAC ; PRÉVISIONS\n \n
      1. 7.21.1 PAR DÉPLOIEMENT, 2025-2035 (milliards USD)\n \n
      2. 7.21.2 PAR TAILLE D'ORGANISATION, 2025-2035 (milliards USD)\n \n
      3. 7.21.3 PAR SECTEUR, 2025-2035 (milliards USD)\n \n
    116. 7.22 ESTIMATIONS DE TAILLE DU MARCHÉ EN AMÉRIQUE DU SUD ; PRÉVISIONS\n \n
      1. 7.22.1 PAR DÉPLOIEMENT, 2025-2035 (milliards USD)\n \n
      2. 7.22.2 PAR TAILLE D'ORGANISATION, 2025-2035 (milliards USD)\n \n
      3. 7.22.3 PAR SECTEUR, 2025-2035 (milliards USD)\n \n
    117. 7.23 ESTIMATIONS DE TAILLE DU MARCHÉ AU BRÉSIL ; PRÉVISIONS\n \n
      1. 7.23.1 PAR DÉPLOIEMENT, 2025-2035 (milliards USD)\n \n
      2. 7.23.2 PAR TAILLE D'ORGANISATION, 2025-2035 (milliards USD)\n \n
      3. 7.23.3 PAR SECTEUR, 2025-2035 (milliards USD)\n \n
    118. 7.24 ESTIMATIONS DE TAILLE DU MARCHÉ AU MEXIQUE ; PRÉVISIONS\n \n
      1. 7.24.1 PAR DÉPLOIEMENT, 2025-2035 (milliards USD)\n \n
      2. 7.24.2 PAR TAILLE D'ORGANISATION, 2025-2035 (milliards USD)\n \n
      3. 7.24.3 PAR SECTEUR, 2025-2035 (milliards USD)\n \n
    119. 7.25 ESTIMATIONS DE TAILLE DU MARCHÉ EN ARGENTINE ; PRÉVISIONS\n \n
      1. 7.25.1 PAR DÉPLOIEMENT, 2025-2035 (milliards USD)\n \n
      2. 7.25.2 PAR TAILLE D'ORGANISATION, 2025-2035 (milliards USD)\n \n
      3. 7.25.3 PAR SECTEUR, 2025-2035 (milliards USD)\n \n
    120. 7.26 ESTIMATIONS DE TAILLE DU MARCHÉ DANS LE RESTE DE L'AMÉRIQUE DU SUD ; PRÉVISIONS\n \n
      1. 7.26.1 PAR DÉPLOIEMENT, 2025-2035 (milliards USD)\n \n
      2. 7.26.2 PAR TAILLE D'ORGANISATION, 2025-2035 (milliards USD)\n \n
      3. 7.26.3 PAR SECTEUR, 2025-2035 (milliards USD)\n \n
    121. 7.27 ESTIMATIONS DE TAILLE DU MARCHÉ EN MEA ; PRÉVISIONS\n \n
      1. 7.27.1 PAR DÉPLOIEMENT, 2025-2035 (milliards USD)\n \n
      2. 7.27.2 PAR TAILLE D'ORGANISATION, 2025-2035 (milliards USD)\n \n
      3. 7.27.3 PAR SECTEUR, 2025-2035 (milliards USD)\n \n
    122. 7.28 ESTIMATIONS DE TAILLE DU MARCHÉ DANS LES PAYS DU CCG ; PRÉVISIONS\n \n
      1. 7.28.1 PAR DÉPLOIEMENT, 2025-2035 (milliards USD)\n \n
      2. 7.28.2 PAR TAILLE D'ORGANISATION, 2025-2035 (milliards USD)\n \n
      3. 7.28.3 PAR SECTEUR, 2025-2035 (milliards USD)\n \n
    123. 7.29 ESTIMATIONS DE TAILLE DU MARCHÉ EN AFRIQUE DU SUD ; PRÉVISIONS\n \n
      1. 7.29.1 PAR DÉPLOIEMENT, 2025-2035 (milliards USD)\n \n
      2. 7.29.2 PAR TAILLE D'ORGANISATION, 2025-2035 (milliards USD)\n \n
      3. 7.29.3 PAR SECTEUR, 2025-2035 (milliards USD)\n \n
    124. 7.30 ESTIMATIONS DE TAILLE DU MARCHÉ DANS LE RESTE DE LA MEA ; PRÉVISIONS\n \n
      1. 7.30.1 PAR DÉPLOIEMENT, 2025-2035 (milliards USD)\n \n
      2. 7.30.2 PAR TAILLE D'ORGANISATION, 2025-2035 (milliards USD)\n \n
      3. 7.30.3 PAR SECTEUR, 2025-2035 (milliards USD)\n \n
    125. 7.31 LANCEMENT DE PRODUIT / DÉVELOPPEMENT DE PRODUIT / APPROBATION\n \n
      1. 7.31.1 \n \n
    126. 7.32 ACQUISITION / PARTENARIAT\n \n

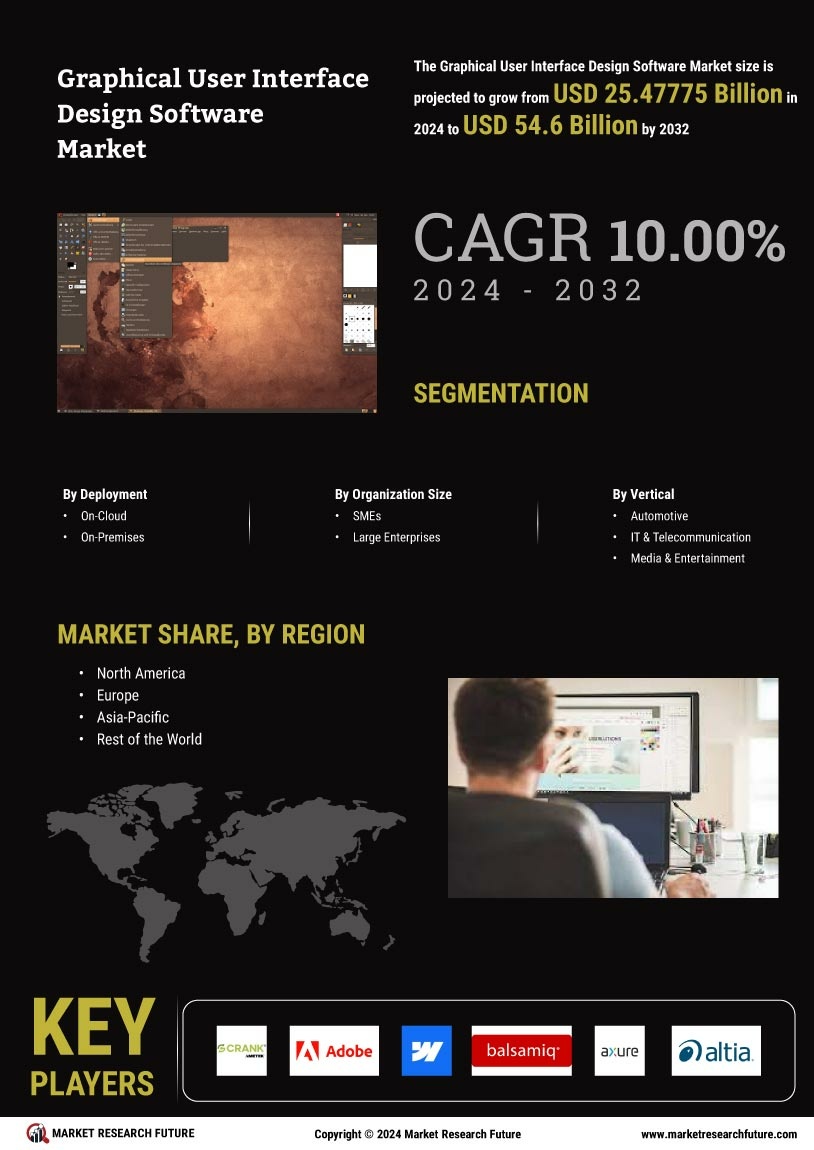
Segmentation du marché des logiciels de conception d'interface utilisateur graphique

Perspectives de déploiement des logiciels de conception d'interface utilisateur graphique (milliards USD, 2018-2032)

  • Sur le cloud

  • Sur site

Perspectives de taille d'organisation des logiciels de conception d'interface utilisateur graphique (milliards USD, 2018-2032)

  • PME

  • Grandes entreprises

Perspectives sectorielles des logiciels de conception d'interface utilisateur graphique (milliards USD, 2018-2032)

  • Automobile

  • IT & Télécommunications

  • Médias & Divertissement

  • Médical & Santé

  • Fabrication

Perspectives régionales des logiciels de conception d'interface utilisateur graphique (milliards USD, 2018-2032)

  • Perspectives de l'Amérique du Nord (milliards USD, 2018-2032)

    • Logiciels de conception d'interface utilisateur graphique en Amérique du Nord par déploiement

      • Sur le cloud

      • Sur site

    • Logiciels de conception d'interface utilisateur graphique en Amérique du Nord par taille d'organisation

      • PME

      • Grandes entreprises

    • Logiciels de conception d'interface utilisateur graphique en Amérique du Nord par secteur

      • Automobile

      • IT & Télécommunications

      • Médias & Divertissement

      • Médical & Santé

      • Fabrication

    • Perspectives des États-Unis (milliards USD, 2018-2032)

    • Logiciels de conception d'interface utilisateur graphique aux États-Unis par déploiement

      • Sur le cloud

      • Sur site

    • Logiciels de conception d'interface utilisateur graphique aux États-Unis par taille d'organisation

      • PME

      • Grandes entreprises

    • Logiciels de conception d'interface utilisateur graphique aux États-Unis par secteur

      • Automobile

      • IT & Télécommunications

      • Médias & Divertissement

      • Médical & Santé

      • Fabrication

    • Perspectives du CANADA (milliards USD, 2018-2032)

    • Logiciels de conception d'interface utilisateur graphique au CANADA par déploiement

      • Sur le cloud

      • Sur site

    • Logiciels de conception d'interface utilisateur graphique au CANADA par taille d'organisation

      • PME

      • Grandes entreprises

    • Logiciels de conception d'interface utilisateur graphique au CANADA par secteur

      • Automobile

      • IT & Télécommunications

      • Médias & Divertissement

      • Médical & Santé

      • Fabrication

  • Perspectives de l'Europe (milliards USD, 2018-2032)

    • Logiciels de conception d'interface utilisateur graphique en Europe par déploiement

      • Sur le cloud

      • Sur site

    • Logiciels de conception d'interface utilisateur graphique en Europe par taille d'organisation

      • PME

      • Grandes entreprises

    • Logiciels de conception d'interface utilisateur graphique en Europe par secteur

      • Automobile

      • IT & Télécommunication

      • Médias & Divertissement

      • Médical & Santé

      • Fabrication

    • Perspectives de l'Allemagne (milliards USD, 2018-2032)

    • Logiciels de conception d'interface utilisateur graphique en Allemagne par déploiement

      • Sur le cloud

      • Sur site

    • Logiciels de conception d'interface utilisateur graphique en Allemagne par taille d'organisation

      • PME

      • Grandes entreprises

    • Logiciels de conception d'interface utilisateur graphique en Allemagne par secteur

      • Automobile

      • IT & Télécommunication

      • Médias & Divertissement

      • Médical & Santé

      • Fabrication

    • Perspectives de la France (milliards USD, 2018-2032)

    • Logiciels de conception d'interface utilisateur graphique en France par déploiement

      • Sur le cloud

      • Sur site

    • Logiciels de conception d'interface utilisateur graphique en France par taille d'organisation

      • PME

      • Grandes entreprises

    • Logiciels de conception d'interface utilisateur graphique en France par secteur

      • Automobile

      • IT & Télécommunication

      • Médias & Divertissement

      • Médical & Santé

      • Fabrication

    • Perspectives du Royaume-Uni (milliards USD, 2018-2032)

    • Logiciels de conception d'interface utilisateur graphique au Royaume-Uni par déploiement

      • Sur le cloud

      • Sur site

    • Logiciels de conception d'interface utilisateur graphique au Royaume-Uni par taille d'organisation

      • PME

      • Grandes entreprises

    • Logiciels de conception d'interface utilisateur graphique au Royaume-Uni par secteur

      • Automobile

      • IT & Télécommunication

      • Médias & Divertissement

      • Médical & Santé

      • Fabrication

    • Perspectives de l'ITALIE (milliards USD, 2018-2032)

    • Logiciels de conception d'interface utilisateur graphique en ITALIE par déploiement

      • Sur le cloud

      • Sur site

    • Logiciels de conception d'interface utilisateur graphique en ITALIE par taille d'organisation

      • PME

      • Grandes entreprises

    • Logiciels de conception d'interface utilisateur graphique en ITALIE par secteur

      • Automobile

      • IT & Télécommunication

      • Médias & Divertissement

      • Médical & Santé

      • Fabrication

    • Perspectives de l'ESPAGNE (milliards USD, 2018-2032)

    • Logiciels de conception d'interface utilisateur graphique en ESPAGNE par déploiement

      • Sur le cloud

      • Sur site

    • Logiciels de conception d'interface utilisateur graphique en ESPAGNE par taille d'organisation

      • PME

      • Grandes entreprises

    • Logiciels de conception d'interface utilisateur graphique en ESPAGNE par secteur

      • Automobile

      • IT & Télécommunication

      • Médias & Divertissement

      • Médical & Santé

      • Fabrication

    • Perspectives du reste de l'Europe (milliards USD, 2018-2032)

    • Logiciels de conception d'interface utilisateur graphique dans le reste de l'Europe par déploiement

      • Sur le cloud

      • Sur site

    • Logiciels de conception d'interface utilisateur graphique dans le reste de l'Europe par taille d'organisation

      • PME

      • Grandes entreprises

    • Logiciels de conception d'interface utilisateur graphique dans le reste de l'Europe par secteur

      • Automobile

      • IT & Télécommunication

      • Médias & Divertissement

      • Médical & Santé

      • Fabrication

  • Perspectives de la région Asie-Pacifique (milliards USD, 2018-2032)

    • Logiciels de conception d'interface utilisateur graphique en Asie-Pacifique par déploiement

      • Sur le cloud

      • Sur site

    • Logiciels de conception d'interface utilisateur graphique en Asie-Pacifique par taille d'organisation

      • PME

      • Grandes entreprises

    • Logiciels de conception d'interface utilisateur graphique en Asie-Pacifique par secteur

      • Automobile

      • IT & Télécommunication

      • Médias & Divertissement

      • Médical & Santé

      • Fabrication

    • Perspectives de la Chine (milliards USD, 2018-2032)

    • Logiciels de conception d'interface utilisateur graphique en Chine par déploiement

      • Sur le cloud

      • Sur site

    • Logiciels de conception d'interface utilisateur graphique en Chine par taille d'organisation

      • PME

      • Grandes entreprises

    • Logiciels de conception d'interface utilisateur graphique en Chine par secteur

      • Automobile

      • IT & Télécommunication

      • Médias & Divertissement

      • Médical & Santé

      • Fabrication

    • Perspectives du Japon (milliards USD, 2018-2032)

    • Logiciels de conception d'interface utilisateur graphique au Japon par déploiement

      • Sur le cloud

      • Sur site

    • Logiciels de conception d'interface utilisateur graphique au Japon par taille d'organisation

      • PME

      • Grandes entreprises

    • Logiciels de conception d'interface utilisateur graphique au Japon par secteur

      • Automobile

      • IT & Télécommunication

      • Médias & Divertissement

      • Médical & Santé

      • Fabrication

    • Perspectives de l'Inde (milliards USD, 2018-2032)

    • Logiciels de conception d'interface utilisateur graphique en Inde par déploiement

      • Sur le cloud

      • Sur site

    • Logiciels de conception d'interface utilisateur graphique en Inde par taille d'organisation

      • PME

      • Grandes entreprises

    • Logiciels de conception d'interface utilisateur graphique en Inde par secteur

      • Automobile

      • IT & Télécommunication

      • Médias & Divertissement

      • Médical & Santé

      • Fabrication

    • Perspectives de l'Australie (milliards USD, 2018-2032)

    • Logiciels de conception d'interface utilisateur graphique en Australie par déploiement

      • Sur le cloud

      • Sur site

    • Logiciels de conception d'interface utilisateur graphique en Australie par taille d'organisation

      • PME

      • Grandes entreprises

    • Logiciels de conception d'interface utilisateur graphique en Australie par secteur

      • Automobile

      • IT & Télécommunication

      • Médias & Divertissement

      • Médical & Santé

      • Fabrication

    • Perspectives du reste de la région Asie-Pacifique (milliards USD, 2018-2032)

    • Logiciels de conception d'interface utilisateur graphique dans le reste de la région Asie-Pacifique par déploiement

      • Sur le cloud

      • Sur site

    • Logiciels de conception d'interface utilisateur graphique dans le reste de la région Asie-Pacifique par taille d'organisation

      • PME

      • Grandes entreprises

    • Logiciels de conception d'interface utilisateur graphique dans le reste de la région Asie-Pacifique par secteur

      • Automobile

      • IT & Télécommunication

      • Médias & Divertissement

      • Médical & Santé

      • Fabrication

  • Perspectives du reste du monde (milliards USD, 2018-2032)

    • Logiciels de conception d'interface utilisateur graphique dans le reste du monde par déploiement

      • Sur le cloud

      • Sur site

    • Logiciels de conception d'interface utilisateur graphique dans le reste du monde par taille d'organisation

      • PME

      • Grandes entreprises

    • Logiciels de conception d'interface utilisateur graphique dans le reste du monde par secteur

      • Automobile

      • IT & Télécommunication

      • Médias & Divertissement

      • Médical & Santé

      • Fabrication

    • Perspectives du Moyen-Orient (milliards USD, 2018-2032)

    • Logiciels de conception d'interface utilisateur graphique au Moyen-Orient par déploiement

      • Sur le cloud

      • Sur site

    • Logiciels de conception d'interface utilisateur graphique au Moyen-Orient par taille d'organisation

      • PME

      • Grandes entreprises

    • Logiciels de conception d'interface utilisateur graphique au Moyen-Orient par secteur

      • Automobile

      • IT & Télécommunication

      • Médias & Divertissement

      • Médical & Santé

      • Fabrication

    • Perspectives de l'Afrique (milliards USD, 2018-2032)

    • Logiciels de conception d'interface utilisateur graphique en Afrique par déploiement

      • Sur le cloud

      • Sur site

    • Logiciels de conception d'interface utilisateur graphique en Afrique par taille d'organisation

      • PME

      • Grandes entreprises

    • Logiciels de conception d'interface utilisateur graphique en Afrique par secteur

      • Automobile

      • IT & Télécommunication

      • Médias & Divertissement

      • Médical & Santé

      • Fabrication

    • Perspectives de l'Amérique Latine (milliards USD, 2018-2032)

    • Logiciels de conception d'interface utilisateur graphique en Amérique Latine par déploiement

      • Sur le cloud

      • Sur site

    • Logiciels de conception d'interface utilisateur graphique en Amérique Latine par taille d'organisation

      • PME

      • Grandes entreprises

    • Logiciels de conception d'interface utilisateur graphique en Amérique Latine par secteur

      • Automobile

      • IT & Télécommunication

      • Médias & Divertissement

      • Médical & Santé

      • Fabrication

Compare Licence

×
Features License Type
Single User Multiuser License Enterprise User
Price $4,950 $5,950 $7,250
Maximum User Access Limit 1 User Upto 10 Users Unrestricted Access Throughout the Organization
Free Customization
Direct Access to Analyst
Deliverable Format
Platform Access
Discount on Next Purchase 10% 15% 15%
Printable Versions