Request Free Sample ×

Kindly complete the form below to receive a free sample of this Report

* Please use a valid business email

Leading companies partner with us for data-driven Insights

clients tt-cursor
Hero Background

Marché des tableaux de distribution

ID: MRFR/EnP/2306-HCR
188 Pages
Priya Nagrale
Last Updated: April 06, 2026

Rapport d'étude de marché sur les tableaux de distribution Informations par type de tension (basse tension et moyenne tension), par utilisateur final (services de transmission et de distribution, industrie manufacturière et de transformation, et secteur commercial et résidentiel), et par région (Amérique du Nord, Europe, Asie-Pacifique, et reste du monde) – Prévisions de marché jusqu'en 2035

Partager
Download PDF ×

We do not share your information with anyone. However, we may send you emails based on your report interest from time to time. You may contact us at any time to opt-out.

Distribution Boards Market Infographic
Purchase Options
  1. 1 SECTION I : RÉSUMÉ EXÉCUTIF ET POINTS CLÉS
    1. 1.1 RÉSUMÉ EXÉCUTIF
      1. 1.1.1 Vue d'ensemble du marché
      2. 1.1.2 Conclusions clés
      3. 1.1.3 Segmentation du marché
      4. 1.1.4 Paysage concurrentiel
      5. 1.1.5 Défis et opportunités
      6. 1.1.6 Perspectives d'avenir
  2. 2 SECTION II : DÉLIMITATION, MÉTHODOLOGIE ET STRUCTURE DU MARCHÉ
    1. 2.1 INTRODUCTION AU MARCHÉ
      1. 2.1.1 Définition
      2. 2.1.2 Portée de l'étude
        1. 2.1.2.1 Objectif de recherche
        2. 2.1.2.2 Hypothèse
        3. 2.1.2.3 Limitations
    2. 2.2 MÉTHODOLOGIE DE RECHERCHE
      1. 2.2.1 Vue d'ensemble
      2. 2.2.2 Exploration des données
      3. 2.2.3 Recherche secondaire
      4. 2.2.4 Recherche primaire
        1. 2.2.4.1 Interviews primaires et processus de collecte d'informations
        2. 2.2.4.2 Répartition des répondants principaux
      5. 2.2.5 Modèle de prévision
      6. 2.2.6 Estimation de la taille du marché
        1. 2.2.6.1 Approche ascendante
        2. 2.2.6.2 Approche descendante
      7. 2.2.7 Triangulation des données
      8. 2.2.8 Validation
  3. 3 SECTION III : ANALYSE QUALITATIVE
    1. 3.1 DYNAMIQUE DU MARCHÉ
      1. 3.1.1 Vue d'ensemble
      2. 3.1.2 Facteurs moteurs
      3. 3.1.3 Contraintes
      4. 3.1.4 Opportunités
    2. 3.2 ANALYSE DES FACTEURS DU MARCHÉ
      1. 3.2.1 Analyse de la chaîne de valeur
      2. 3.2.2 Analyse des cinq forces de Porter
        1. 3.2.2.1 Pouvoir de négociation des fournisseurs
        2. 3.2.2.2 Pouvoir de négociation des acheteurs
        3. 3.2.2.3 Menace des nouveaux entrants
        4. 3.2.2.4 Menace des substituts
        5. 3.2.2.5 Intensité de la rivalité
      3. 3.2.3 Analyse d'impact du COVID-19
        1. 3.2.3.1 Analyse d'impact sur le marché
        2. 3.2.3.2 Impact régional
        3. 3.2.3.3 Analyse des opportunités et des menaces
  4. 4 SECTION IV : ANALYSE QUANTITATIVE
    1. 4.1 Énergie et puissance, PAR TYPE DE VOLTAGE (milliards USD)
      1. 4.1.1 Basse tension
      2. 4.1.2 Moyenne tension
    2. 4.2 Énergie et puissance, PAR UTILISATEUR FINAL (milliards USD)
      1. 4.2.1 Utilitaires de transmission et de distribution
      2. 4.2.2 Industrie de fabrication et de transformation
      3. 4.2.3 Secteur commercial et résidentiel
    3. 4.3 Énergie et puissance, PAR RÉGION (milliards USD)
      1. 4.3.1 Amérique du Nord
        1. 4.3.1.1 États-Unis
        2. 4.3.1.2 Canada
      2. 4.3.2 Europe
        1. 4.3.2.1 Allemagne
        2. 4.3.2.2 Royaume-Uni
        3. 4.3.2.3 France
        4. 4.3.2.4 Russie
        5. 4.3.2.5 Italie
        6. 4.3.2.6 Espagne
        7. 4.3.2.7 Reste de l'Europe
      3. 4.3.3 APAC
        1. 4.3.3.1 Chine
        2. 4.3.3.2 Inde
        3. 4.3.3.3 Japon
        4. 4.3.3.4 Corée du Sud
        5. 4.3.3.5 Malaisie
        6. 4.3.3.6 Thaïlande
        7. 4.3.3.7 Indonésie
        8. 4.3.3.8 Reste de l'APAC
      4. 4.3.4 Amérique du Sud
        1. 4.3.4.1 Brésil
        2. 4.3.4.2 Mexique
        3. 4.3.4.3 Argentine
        4. 4.3.4.4 Reste de l'Amérique du Sud
      5. 4.3.5 MEA
        1. 4.3.5.1 Pays du CCG
        2. 4.3.5.2 Afrique du Sud
        3. 4.3.5.3 Reste de la MEA
  5. 5 SECTION V : ANALYSE CONCURRENTIELLE
    1. 5.1 Paysage concurrentiel
      1. 5.1.1 Vue d'ensemble
      2. 5.1.2 Analyse concurrentielle
      3. 5.1.3 Analyse de part de marché
      4. 5.1.4 Stratégie de croissance majeure dans l'énergie et la puissance
      5. 5.1.5 Évaluation comparative concurrentielle
      6. 5.1.6 Acteurs principaux en termes de nombre de développements dans l'énergie et la puissance
      7. 5.1.7 Développements clés et stratégies de croissance
        1. 5.1.7.1 Lancement de nouveaux produits / Déploiement de services
        2. 5.1.7.2 Fusions et acquisitions
        3. 5.1.7.3 Coentreprises
      8. 5.1.8 Matrice financière des principaux acteurs
        1. 5.1.8.1 Ventes et revenu d'exploitation
        2. 5.1.8.2 Dépenses de R&D des principaux acteurs. 2023
    2. 5.2 Profils d'entreprise
      1. 5.2.1 Schneider Electric (FR)
        1. 5.2.1.1 Vue d'ensemble financière
        2. 5.2.1.2 Produits offerts
        3. 5.2.1.3 Développements clés
        4. 5.2.1.4 Analyse SWOT
        5. 5.2.1.5 Stratégies clés
      2. 5.2.2 Siemens (DE)
        1. 5.2.2.1 Vue d'ensemble financière
        2. 5.2.2.2 Produits offerts
        3. 5.2.2.3 Développements clés
        4. 5.2.2.4 Analyse SWOT
        5. 5.2.2.5 Stratégies clés
      3. 5.2.3 Eaton (US)
        1. 5.2.3.1 Vue d'ensemble financière
        2. 5.2.3.2 Produits offerts
        3. 5.2.3.3 Développements clés
        4. 5.2.3.4 Analyse SWOT
        5. 5.2.3.5 Stratégies clés
      4. 5.2.4 ABB (CH)
        1. 5.2.4.1 Vue d'ensemble financière
        2. 5.2.4.2 Produits offerts
        3. 5.2.4.3 Développements clés
        4. 5.2.4.4 Analyse SWOT
        5. 5.2.4.5 Stratégies clés
      5. 5.2.5 Legrand (FR)
        1. 5.2.5.1 Vue d'ensemble financière
        2. 5.2.5.2 Produits offerts
        3. 5.2.5.3 Développements clés
        4. 5.2.5.4 Analyse SWOT
        5. 5.2.5.5 Stratégies clés
      6. 5.2.6 General Electric (US)
        1. 5.2.6.1 Vue d'ensemble financière
        2. 5.2.6.2 Produits offerts
        3. 5.2.6.3 Développements clés
        4. 5.2.6.4 Analyse SWOT
        5. 5.2.6.5 Stratégies clés
      7. 5.2.7 Mitsubishi Electric (JP)
        1. 5.2.7.1 Vue d'ensemble financière
        2. 5.2.7.2 Produits offerts
        3. 5.2.7.3 Développements clés
        4. 5.2.7.4 Analyse SWOT
        5. 5.2.7.5 Stratégies clés
      8. 5.2.8 Honeywell (US)
        1. 5.2.8.1 Vue d'ensemble financière
        2. 5.2.8.2 Produits offerts
        3. 5.2.8.3 Développements clés
        4. 5.2.8.4 Analyse SWOT
        5. 5.2.8.5 Stratégies clés
      9. 5.2.9 Rockwell Automation (US)
        1. 5.2.9.1 Vue d'ensemble financière
        2. 5.2.9.2 Produits offerts
        3. 5.2.9.3 Développements clés
        4. 5.2.9.4 Analyse SWOT
        5. 5.2.9.5 Stratégies clés
    3. 5.3 Annexe
      1. 5.3.1 Références
      2. 5.3.2 Rapports connexes
  6. 6 LISTE DES FIGURES
    1. 6.1 SYNOPSIS DU MARCHÉ
    2. 6.2 ANALYSE DU MARCHÉ EN AMÉRIQUE DU NORD
    3. 6.3 ANALYSE DU MARCHÉ AUX ÉTATS-UNIS PAR TYPE DE VOLTAGE
    4. 6.4 ANALYSE DU MARCHÉ AUX ÉTATS-UNIS PAR UTILISATEUR FINAL
    5. 6.5 ANALYSE DU MARCHÉ AU CANADA PAR TYPE DE VOLTAGE
    6. 6.6 ANALYSE DU MARCHÉ AU CANADA PAR UTILISATEUR FINAL
    7. 6.7 ANALYSE DU MARCHÉ EN EUROPE
    8. 6.8 ANALYSE DU MARCHÉ EN ALLEMAGNE PAR TYPE DE VOLTAGE
    9. 6.9 ANALYSE DU MARCHÉ EN ALLEMAGNE PAR UTILISATEUR FINAL
    10. 6.10 ANALYSE DU MARCHÉ AU ROYAUME-UNI PAR TYPE DE VOLTAGE
    11. 6.11 ANALYSE DU MARCHÉ AU ROYAUME-UNI PAR UTILISATEUR FINAL
    12. 6.12 ANALYSE DU MARCHÉ EN FRANCE PAR TYPE DE VOLTAGE
    13. 6.13 ANALYSE DU MARCHÉ EN FRANCE PAR UTILISATEUR FINAL
    14. 6.14 ANALYSE DU MARCHÉ EN RUSSIE PAR TYPE DE VOLTAGE
    15. 6.15 ANALYSE DU MARCHÉ EN RUSSIE PAR UTILISATEUR FINAL
    16. 6.16 ANALYSE DU MARCHÉ EN ITALIE PAR TYPE DE VOLTAGE
    17. 6.17 ANALYSE DU MARCHÉ EN ITALIE PAR UTILISATEUR FINAL
    18. 6.18 ANALYSE DU MARCHÉ EN ESPAGNE PAR TYPE DE VOLTAGE
    19. 6.19 ANALYSE DU MARCHÉ EN ESPAGNE PAR UTILISATEUR FINAL
    20. 6.20 ANALYSE DU MARCHÉ DANS LE RESTE DE L'EUROPE PAR TYPE DE VOLTAGE
    21. 6.21 ANALYSE DU MARCHÉ DANS LE RESTE DE L'EUROPE PAR UTILISATEUR FINAL
    22. 6.22 ANALYSE DU MARCHÉ EN APAC
    23. 6.23 ANALYSE DU MARCHÉ EN CHINE PAR TYPE DE VOLTAGE
    24. 6.24 ANALYSE DU MARCHÉ EN CHINE PAR UTILISATEUR FINAL
    25. 6.25 ANALYSE DU MARCHÉ EN INDE PAR TYPE DE VOLTAGE
    26. 6.26 ANALYSE DU MARCHÉ EN INDE PAR UTILISATEUR FINAL
    27. 6.27 ANALYSE DU MARCHÉ AU JAPON PAR TYPE DE VOLTAGE
    28. 6.28 ANALYSE DU MARCHÉ AU JAPON PAR UTILISATEUR FINAL
    29. 6.29 ANALYSE DU MARCHÉ EN CORÉE DU SUD PAR TYPE DE VOLTAGE
    30. 6.30 ANALYSE DU MARCHÉ EN CORÉE DU SUD PAR UTILISATEUR FINAL
    31. 6.31 ANALYSE DU MARCHÉ EN MALAYSIE PAR TYPE DE VOLTAGE
    32. 6.32 ANALYSE DU MARCHÉ EN MALAYSIE PAR UTILISATEUR FINAL
    33. 6.33 ANALYSE DU MARCHÉ EN THAÏLANDE PAR TYPE DE VOLTAGE
    34. 6.34 ANALYSE DU MARCHÉ EN THAÏLANDE PAR UTILISATEUR FINAL
    35. 6.35 ANALYSE DU MARCHÉ EN INDONÉSIE PAR TYPE DE VOLTAGE
    36. 6.36 ANALYSE DU MARCHÉ EN INDONÉSIE PAR UTILISATEUR FINAL
    37. 6.37 ANALYSE DU MARCHÉ DANS LE RESTE DE L'APAC PAR TYPE DE VOLTAGE
    38. 6.38 ANALYSE DU MARCHÉ DANS LE RESTE DE L'APAC PAR UTILISATEUR FINAL
    39. 6.39 ANALYSE DU MARCHÉ EN AMÉRIQUE DU SUD
    40. 6.40 ANALYSE DU MARCHÉ AU BRÉSIL PAR TYPE DE VOLTAGE
    41. 6.41 ANALYSE DU MARCHÉ AU BRÉSIL PAR UTILISATEUR FINAL
    42. 6.42 ANALYSE DU MARCHÉ AU MEXIQUE PAR TYPE DE VOLTAGE
    43. 6.43 ANALYSE DU MARCHÉ AU MEXIQUE PAR UTILISATEUR FINAL
    44. 6.44 ANALYSE DU MARCHÉ EN ARGENTINE PAR TYPE DE VOLTAGE
    45. 6.45 ANALYSE DU MARCHÉ EN ARGENTINE PAR UTILISATEUR FINAL
    46. 6.46 ANALYSE DU MARCHÉ DANS LE RESTE DE L'AMÉRIQUE DU SUD PAR TYPE DE VOLTAGE
    47. 6.47 ANALYSE DU MARCHÉ DANS LE RESTE DE L'AMÉRIQUE DU SUD PAR UTILISATEUR FINAL
    48. 6.48 ANALYSE DU MARCHÉ EN MEA
    49. 6.49 ANALYSE DU MARCHÉ DANS LES PAYS DU CCG PAR TYPE DE VOLTAGE
    50. 6.50 ANALYSE DU MARCHÉ DANS LES PAYS DU CCG PAR UTILISATEUR FINAL
    51. 6.51 ANALYSE DU MARCHÉ EN AFRIQUE DU SUD PAR TYPE DE VOLTAGE
    52. 6.52 ANALYSE DU MARCHÉ EN AFRIQUE DU SUD PAR UTILISATEUR FINAL
    53. 6.53 ANALYSE DU MARCHÉ DANS LE RESTE DE LA MEA PAR TYPE DE VOLTAGE
    54. 6.54 ANALYSE DU MARCHÉ DANS LE RESTE DE LA MEA PAR UTILISATEUR FINAL
    55. 6.55 CRITÈRES D'ACHAT CLÉS DE L'ÉNERGIE ET DE LA PUISSANCE
    56. 6.56 PROCESSUS DE RECHERCHE DE MRFR
    57. 6.57 ANALYSE DRO DE L'ÉNERGIE ET DE LA PUISSANCE
    58. 6.58 ANALYSE D'IMPACT DES FACTEURS : ÉNERGIE ET PUISSANCE
    59. 6.59 ANALYSE D'IMPACT DES CONTRAINTES : ÉNERGIE ET PUISSANCE
    60. 6.60 CHAÎNE D'APPROVISIONNEMENT / CHAÎNE DE VALEUR : ÉNERGIE ET PUISSANCE
    61. 6.61 ÉNERGIE ET PUISSANCE, PAR TYPE DE VOLTAGE, 2024 (% PART)
    62. 6.62 ÉNERGIE ET PUISSANCE, PAR TYPE DE VOLTAGE, 2024 À 2035 (milliards USD)
    63. 6.63 ÉNERGIE ET PUISSANCE, PAR UTILISATEUR FINAL, 2024 (% PART)
    64. 6.64 ÉNERGIE ET PUISSANCE, PAR UTILISATEUR FINAL, 2024 À 2035 (milliards USD)
    65. 6.65 ÉVALUATION COMPARATIVE DES PRINCIPAUX CONCURRENTS
  7. 7 LISTE DES TABLEAUX
    1. 7.1 LISTE DES HYPOTHÈSES
  8. 7.1.1
    1. 7.2 ESTIMATIONS DE TAILLE DU MARCHÉ EN AMÉRIQUE DU NORD ; PRÉVISION
      1. 7.2.1 PAR TYPE DE VOLTAGE, 2025-2035 (milliards USD)
      2. 7.2.2 PAR UTILISATEUR FINAL, 2025-2035 (milliards USD)
    2. 7.3 ESTIMATIONS DE TAILLE DU MARCHÉ AUX ÉTATS-UNIS ; PRÉVISION
      1. 7.3.1 PAR TYPE DE VOLTAGE, 2025-2035 (milliards USD)
      2. 7.3.2 PAR UTILISATEUR FINAL, 2025-2035 (milliards USD)
    3. 7.4 ESTIMATIONS DE TAILLE DU MARCHÉ AU CANADA ; PRÉVISION
      1. 7.4.1 PAR TYPE DE VOLTAGE, 2025-2035 (milliards USD)
      2. 7.4.2 PAR UTILISATEUR FINAL, 2025-2035 (milliards USD)
    4. 7.5 ESTIMATIONS DE TAILLE DU MARCHÉ EN EUROPE ; PRÉVISION
      1. 7.5.1 PAR TYPE DE VOLTAGE, 2025-2035 (milliards USD)
      2. 7.5.2 PAR UTILISATEUR FINAL, 2025-2035 (milliards USD)
    5. 7.6 ESTIMATIONS DE TAILLE DU MARCHÉ EN ALLEMAGNE ; PRÉVISION
      1. 7.6.1 PAR TYPE DE VOLTAGE, 2025-2035 (milliards USD)
      2. 7.6.2 PAR UTILISATEUR FINAL, 2025-2035 (milliards USD)
    6. 7.7 ESTIMATIONS DE TAILLE DU MARCHÉ AU ROYAUME-UNI ; PRÉVISION
      1. 7.7.1 PAR TYPE DE VOLTAGE, 2025-2035 (milliards USD)
      2. 7.7.2 PAR UTILISATEUR FINAL, 2025-2035 (milliards USD)
    7. 7.8 ESTIMATIONS DE TAILLE DU MARCHÉ EN FRANCE ; PRÉVISION
      1. 7.8.1 PAR TYPE DE VOLTAGE, 2025-2035 (milliards USD)
      2. 7.8.2 PAR UTILISATEUR FINAL, 2025-2035 (milliards USD)
    8. 7.9 ESTIMATIONS DE TAILLE DU MARCHÉ EN RUSSIE ; PRÉVISION
      1. 7.9.1 PAR TYPE DE VOLTAGE, 2025-2035 (milliards USD)
      2. 7.9.2 PAR UTILISATEUR FINAL, 2025-2035 (milliards USD)
    9. 7.10 ESTIMATIONS DE TAILLE DU MARCHÉ EN ITALIE ; PRÉVISION
      1. 7.10.1 PAR TYPE DE VOLTAGE, 2025-2035 (milliards USD)
      2. 7.10.2 PAR UTILISATEUR FINAL, 2025-2035 (milliards USD)
    10. 7.11 ESTIMATIONS DE TAILLE DU MARCHÉ EN ESPAGNE ; PRÉVISION
      1. 7.11.1 PAR TYPE DE VOLTAGE, 2025-2035 (milliards USD)
      2. 7.11.2 PAR UTILISATEUR FINAL, 2025-2035 (milliards USD)
    11. 7.12 ESTIMATIONS DE TAILLE DU MARCHÉ DANS LE RESTE DE L'EUROPE ; PRÉVISION
      1. 7.12.1 PAR TYPE DE VOLTAGE, 2025-2035 (milliards USD)
      2. 7.12.2 PAR UTILISATEUR FINAL, 2025-2035 (milliards USD)
    12. 7.13 ESTIMATIONS DE TAILLE DU MARCHÉ EN APAC ; PRÉVISION
      1. 7.13.1 PAR TYPE DE VOLTAGE, 2025-2035 (milliards USD)
      2. 7.13.2 PAR UTILISATEUR FINAL, 2025-2035 (milliards USD)
    13. 7.14 ESTIMATIONS DE TAILLE DU MARCHÉ EN CHINE ; PRÉVISION
      1. 7.14.1 PAR TYPE DE VOLTAGE, 2025-2035 (milliards USD)
      2. 7.14.2 PAR UTILISATEUR FINAL, 2025-2035 (milliards USD)
    14. 7.15 ESTIMATIONS DE TAILLE DU MARCHÉ EN INDE ; PRÉVISION
      1. 7.15.1 PAR TYPE DE VOLTAGE, 2025-2035 (milliards USD)
      2. 7.15.2 PAR UTILISATEUR FINAL, 2025-2035 (milliards USD)
    15. 7.16 ESTIMATIONS DE TAILLE DU MARCHÉ AU JAPON ; PRÉVISION
      1. 7.16.1 PAR TYPE DE VOLTAGE, 2025-2035 (milliards USD)
      2. 7.16.2 PAR UTILISATEUR FINAL, 2025-2035 (milliards USD)
    16. 7.17 ESTIMATIONS DE TAILLE DU MARCHÉ EN CORÉE DU SUD ; PRÉVISION
      1. 7.17.1 PAR TYPE DE VOLTAGE, 2025-2035 (milliards USD)
      2. 7.17.2 PAR UTILISATEUR FINAL, 2025-2035 (milliards USD)
    17. 7.18 ESTIMATIONS DE TAILLE DU MARCHÉ EN MALAYSIE ; PRÉVISION
      1. 7.18.1 PAR TYPE DE VOLTAGE, 2025-2035 (milliards USD)
      2. 7.18.2 PAR UTILISATEUR FINAL, 2025-2035 (milliards USD)
    18. 7.19 ESTIMATIONS DE TAILLE DU MARCHÉ EN THAÏLANDE ; PRÉVISION
      1. 7.19.1 PAR TYPE DE VOLTAGE, 2025-2035 (milliards USD)
      2. 7.19.2 PAR UTILISATEUR FINAL, 2025-2035 (milliards USD)
    19. 7.20 ESTIMATIONS DE TAILLE DU MARCHÉ EN INDONÉSIE ; PRÉVISION
      1. 7.20.1 PAR TYPE DE VOLTAGE, 2025-2035 (milliards USD)
      2. 7.20.2 PAR UTILISATEUR FINAL, 2025-2035 (milliards USD)
    20. 7.21 ESTIMATIONS DE TAILLE DU MARCHÉ DANS LE RESTE DE L'APAC ; PRÉVISION
      1. 7.21.1 PAR TYPE DE VOLTAGE, 2025-2035 (milliards USD)
      2. 7.21.2 PAR UTILISATEUR FINAL, 2025-2035 (milliards USD)
    21. 7.22 ESTIMATIONS DE TAILLE DU MARCHÉ EN AMÉRIQUE DU SUD ; PRÉVISION
      1. 7.22.1 PAR TYPE DE VOLTAGE, 2025-2035 (milliards USD)
      2. 7.22.2 PAR UTILISATEUR FINAL, 2025-2035 (milliards USD)
    22. 7.23 ESTIMATIONS DE TAILLE DU MARCHÉ AU BRÉSIL ; PRÉVISION
      1. 7.23.1 PAR TYPE DE VOLTAGE, 2025-2035 (milliards USD)
      2. 7.23.2 PAR UTILISATEUR FINAL, 2025-2035 (milliards USD)
    23. 7.24 ESTIMATIONS DE TAILLE DU MARCHÉ AU MEXIQUE ; PRÉVISION
      1. 7.24.1 PAR TYPE DE VOLTAGE, 2025-2035 (milliards USD)
      2. 7.24.2 PAR UTILISATEUR FINAL, 2025-2035 (milliards USD)
    24. 7.25 ESTIMATIONS DE TAILLE DU MARCHÉ EN ARGENTINE ; PRÉVISION
      1. 7.25.1 PAR TYPE DE VOLTAGE, 2025-2035 (milliards USD)
      2. 7.25.2 PAR UTILISATEUR FINAL, 2025-2035 (milliards USD)
    25. 7.26 ESTIMATIONS DE TAILLE DU MARCHÉ DANS LE RESTE DE L'AMÉRIQUE DU SUD ; PRÉVISION
      1. 7.26.1 PAR TYPE DE VOLTAGE, 2025-2035 (milliards USD)
      2. 7.26.2 PAR UTILISATEUR FINAL, 2025-2035 (milliards USD)
    26. 7.27 ESTIMATIONS DE TAILLE DU MARCHÉ EN MEA ; PRÉVISION
      1. 7.27.1 PAR TYPE DE VOLTAGE, 2025-2035 (milliards USD)
      2. 7.27.2 PAR UTILISATEUR FINAL, 2025-2035 (milliards USD)
    27. 7.28 ESTIMATIONS DE TAILLE DU MARCHÉ DANS LES PAYS DU CCG ; PRÉVISION
      1. 7.28.1 PAR TYPE DE VOLTAGE, 2025-2035 (milliards USD)
      2. 7.28.2 PAR UTILISATEUR FINAL, 2025-2035 (milliards USD)
    28. 7.29 ESTIMATIONS DE TAILLE DU MARCHÉ EN AFRIQUE DU SUD ; PRÉVISION
      1. 7.29.1 PAR TYPE DE VOLTAGE, 2025-2035 (milliards USD)
      2. 7.29.2 PAR UTILISATEUR FINAL, 2025-2035 (milliards USD)
    29. 7.30 ESTIMATIONS DE TAILLE DU MARCHÉ DANS LE RESTE DE LA MEA ; PRÉVISION
      1. 7.30.1 PAR TYPE DE VOLTAGE, 2025-2035 (milliards USD)
      2. 7.30.2 PAR UTILISATEUR FINAL, 2025-2035 (milliards USD)
    30. 7.31 LANCEMENT DE PRODUIT / DÉVELOPPEMENT DE PRODUIT / APPROBATION
  9. 7.31.1
    1. 7.32 ACQUISITION / PARTENARIAT
  10. 7.32.1

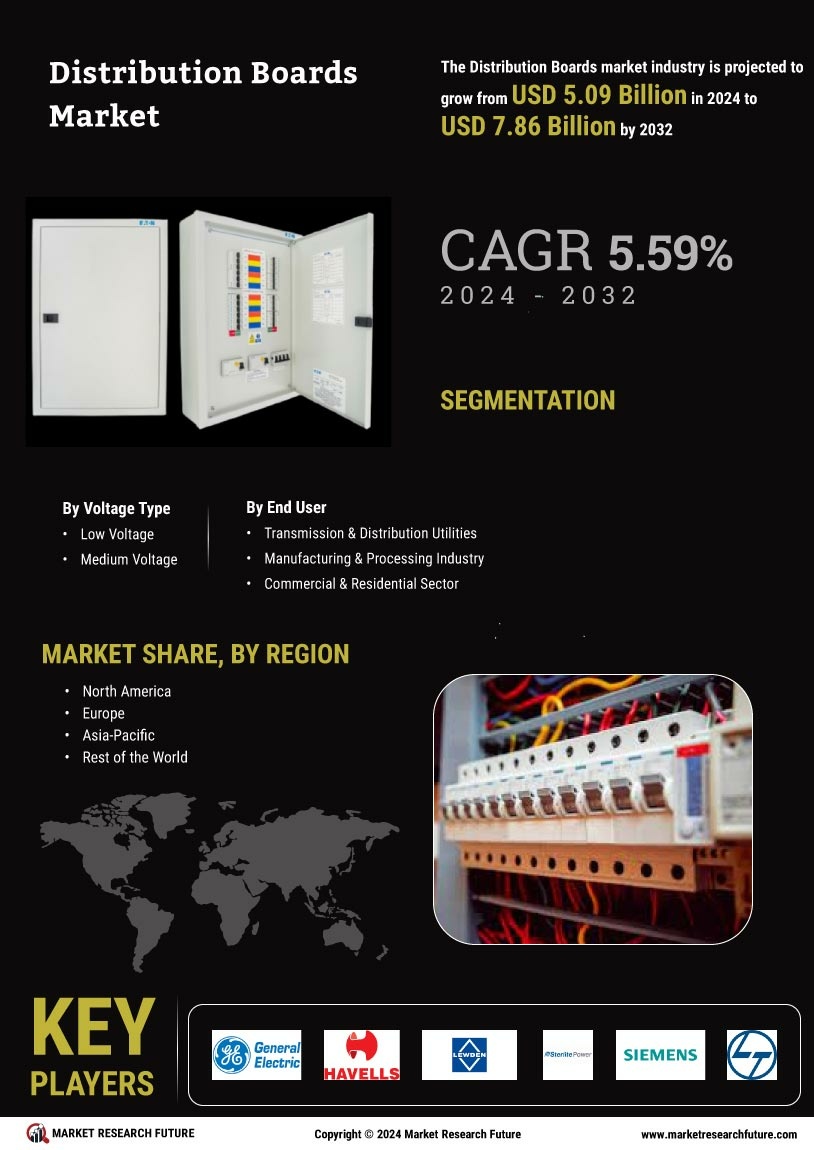
Tableaux de distribution Segmentation du marché

Perspectives par type de tension des tableaux de distribution (milliards USD, 2018-2032)

  • Basse tension

  • Moyenne tension

Perspectives par utilisateur final des tableaux de distribution (milliards USD, 2018-2032)

  • Utilités de transmission et de distribution

  • Industrie manufacturière et de transformation

  • Secteur commercial et résidentiel

Perspectives régionales des tableaux de distribution (milliards USD, 2018-2032)

  • Perspectives de l'Amérique du Nord (milliards USD, 2018-2032)

    • Tableaux de distribution de l'Amérique du Nord par type de tension

      • Basse tension

      • Moyenne tension

    • Tableaux de distribution de l'Amérique du Nord par utilisateur final

      • Utilités de transmission et de distribution

      • Industrie manufacturière et de transformation

      • Secteur commercial et résidentiel

    • Perspectives des États-Unis (milliards USD, 2018-2032)

    • Tableaux de distribution des États-Unis par type de tension

      • Basse tension

      • Moyenne tension

    • Tableaux de distribution des États-Unis par utilisateur final

      • Utilités de transmission et de distribution

      • Industrie manufacturière et de transformation

      • Secteur commercial et résidentiel

    • Perspectives du CANADA (milliards USD, 2018-2032)

    • Tableaux de distribution du CANADA par type de tension

      • Basse tension

      • Moyenne tension

    • Tableaux de distribution du CANADA par utilisateur final

      • Utilités de transmission et de distribution

      • Industrie manufacturière et de transformation

      • Secteur commercial et résidentiel

  • Perspectives de l'Europe (milliards USD, 2018-2032)

    • Tableaux de distribution de l'Europe par type de tension

      • Basse tension

      • Moyenne tension

    • Tableaux de distribution de l'Europe par utilisateur final

      • Utilités de transmission et de distribution

      • Industrie manufacturière et de transformation

      • Secteur commercial et résidentiel

    • Perspectives de l'Allemagne (milliards USD, 2018-2032)

    • Tableaux de distribution de l'Allemagne par type de tension

      • Basse tension

      • Moyenne tension

    • Tableaux de distribution de l'Allemagne par utilisateur final

      • Utilités de transmission et de distribution

      • Industrie manufacturière et de transformation

      • Secteur commercial et résidentiel

    • Perspectives de la France (milliards USD, 2018-2032)

    • Tableaux de distribution de la France par type de tension

      • Basse tension

      • Moyenne tension

    • Tableaux de distribution de la France par utilisateur final

      • Utilités de transmission et de distribution

      • Industrie manufacturière et de transformation

      • Secteur commercial et résidentiel

    • Perspectives du Royaume-Uni (milliards USD, 2018-2032)

    • Tableaux de distribution du Royaume-Uni par type de tension

      • Basse tension

      • Moyenne tension

    • Tableaux de distribution du Royaume-Uni par utilisateur final

      • Utilités de transmission et de distribution

      • Industrie manufacturière et de transformation

      • Secteur commercial et résidentiel

    • Perspectives de l'ITALIE (milliards USD, 2018-2032)

    • Tableaux de distribution de l'ITALIE par type de tension

      • Basse tension

      • Moyenne tension

    • Tableaux de distribution de l'ITALIE par utilisateur final

      • Utilités de transmission et de distribution

      • Industrie manufacturière et de transformation

      • Secteur commercial et résidentiel

    • Perspectives de l'ESPAGNE (milliards USD, 2018-2032)

    • Tableaux de distribution de l'Espagne par type de tension

      • Basse tension

      • Moyenne tension

    • Tableaux de distribution de l'Espagne par utilisateur final

      • Utilités de transmission et de distribution

      • Industrie manufacturière et de transformation

      • Secteur commercial et résidentiel

    • Perspectives du reste de l'Europe (milliards USD, 2018-2032)

    • Tableaux de distribution du reste de l'Europe par type de tension

      • Basse tension

      • Moyenne tension

    • Tableaux de distribution du RESTE DE L'EUROPE par utilisateur final

      • Utilités de transmission et de distribution

      • Industrie manufacturière et de transformation

      • Secteur commercial et résidentiel

  • Perspectives de la région Asie-Pacifique (milliards USD, 2018-2032)

    • Tableaux de distribution de la région Asie-Pacifique par type de tension

      • Basse tension

      • Moyenne tension

    • Tableaux de distribution de la région Asie-Pacifique par utilisateur final

      • Utilités de transmission et de distribution

      • Industrie manufacturière et de transformation

      • Secteur commercial et résidentiel

    • Perspectives de la Chine (milliards USD, 2018-2032)

    • Tableaux de distribution de la Chine par type de tension

      • Basse tension

      • Moyenne tension

    • Tableaux de distribution de la Chine par utilisateur final

      • Utilités de transmission et de distribution

      • Industrie manufacturière et de transformation

      • Secteur commercial et résidentiel

    • Perspectives du Japon (milliards USD, 2018-2032)

    • Tableaux de distribution du Japon par type de tension

      • Basse tension

      • Moyenne tension

    • Tableaux de distribution du Japon par utilisateur final

      • Utilités de transmission et de distribution

      • Industrie manufacturière et de transformation

      • Secteur commercial et résidentiel

    • Perspectives de l'Inde (milliards USD, 2018-2032)

    • Tableaux de distribution de l'Inde par type de tension

      • Basse tension

      • Moyenne tension

    • Tableaux de distribution de l'Inde par utilisateur final

      • Utilités de transmission et de distribution

      • Industrie manufacturière et de transformation

      • Secteur commercial et résidentiel

    • Perspectives de l'Australie (milliards USD, 2018-2032)

    • Tableaux de distribution de l'Australie par type de tension

      • Basse tension

      • Moyenne tension

    • Tableaux de distribution de l'Australie par utilisateur final

      • Utilités de transmission et de distribution

      • Industrie manufacturière et de transformation

      • Secteur commercial et résidentiel

    • Perspectives du reste de la région Asie-Pacifique (milliards USD, 2018-2032)

    • Tableaux de distribution du reste de la région Asie-Pacifique par type de tension

      • Basse tension

      • Moyenne tension

    • Tableaux de distribution du reste de la région Asie-Pacifique par utilisateur final

      • Utilités de transmission et de distribution

      • Industrie manufacturière et de transformation

      • Secteur commercial et résidentiel

  • Perspectives du reste du monde (milliards USD, 2018-2032)

    • Tableaux de distribution du reste du monde par type de tension

      • Basse tension

      • Moyenne tension

    • Tableaux de distribution du reste du monde par utilisateur final

      • Utilités de transmission et de distribution

      • Industrie manufacturière et de transformation

      • Secteur commercial et résidentiel

    • Perspectives du Moyen-Orient (milliards USD, 2018-2032)

    • Tableaux de distribution du Moyen-Orient par type de tension

      • Basse tension

      • Moyenne tension

    • Tableaux de distribution du Moyen-Orient par utilisateur final

      • Utilités de transmission et de distribution

      • Industrie manufacturière et de transformation

      • Secteur commercial et résidentiel

    • Perspectives de l'Afrique (milliards USD, 2018-2032)

    • Tableaux de distribution de l'Afrique par type de tension

      • Basse tension

      • Moyenne tension

    • Tableaux de distribution de l'Afrique par utilisateur final

      • Utilités de transmission et de distribution

      • Industrie manufacturière et de transformation

      • Secteur commercial et résidentiel

    • Perspectives de l'Amérique latine (milliards USD, 2018-2032)

    • Tableaux de distribution de l'Amérique latine par type de tension

      • Basse tension

      • Moyenne tension

    • Tableaux de distribution de l'Amérique latine par utilisateur final

      • Utilités de transmission et de distribution

      • Industrie manufacturière et de transformation

      • Secteur commercial et résidentiel

Compare Licence

×
Features License Type
Single User Multiuser License Enterprise User
Price $4,950 $5,950 $7,250
Maximum User Access Limit 1 User Upto 10 Users Unrestricted Access Throughout the Organization
Free Customization
Direct Access to Analyst
Deliverable Format
Platform Access
Discount on Next Purchase 10% 15% 15%
Printable Versions