Request Free Sample ×

Kindly complete the form below to receive a free sample of this Report

* Please use a valid business email

Leading companies partner with us for data-driven Insights

clients tt-cursor
Hero Background

Marché de l'infodivertissement des sièges arrière automobiles

ID: MRFR/AT/7255-CR
164 Pages
Triveni Bhoyar
Last Updated: April 15, 2026

Rapport de recherche sur le marché de l'infodivertissement des sièges arrière automobiles Informations par système d'exploitation (Qnx, Linux, Microsoft, et autres), type de technologie (lecteur multimédia et systèmes de navigation), utilisateur final (OEM et marché secondaire), type (système de moniteur de tête, système de plafond et système plug and play), et par région (Amérique du Nord, Europe, Asie-Pacifique, Moyen-Orient et Afrique, et Amérique du Sud) – Prévisions du marché jusqu'en 2035

Partager
Download PDF ×

We do not share your information with anyone. However, we may send you emails based on your report interest from time to time. You may contact us at any time to opt-out.

Automotive Rear Seat Infotainment Market Infographic
Purchase Options
  1. SECTION I : RÉSUMÉ EXÉCUTIF ET POINTS CLÉS\n\n
    1. 1.1 RÉSUMÉ EXÉCUTIF\n \n
      1. 1.1.1 Vue d'ensemble du marché\n \n
      2. 1.1.2 Conclusions clés\n \n
      3. 1.1.3 Segmentation du marché\n \n
      4. 1.1.4 Paysage concurrentiel\n \n
      5. 1.1.5 Défis et opportunités\n \n
      6. 1.1.6 Perspectives futures\n2
  2. SECTION II : DÉLIMITATION, MÉTHODOLOGIE ET STRUCTURE DU MARCHÉ\n
    1. 2.1 INTRODUCTION AU MARCHÉ\n \n
      1. 2.1.1 Définition\n \n
      2. 2.1.2 Portée de l'étude\n \n \n
        1. 2.1.2.1 Objectif de recherche\n \n \n
        2. 2.1.2.2 Hypothèse\n \n \n
        3. 2.1.2.3 Limitations\n
    2. 2.2 MÉTHODOLOGIE DE RECHERCHE\n \n
      1. 2.2.1 Vue d'ensemble\n \n
      2. 2.2.2 Extraction de données\n \n
      3. 2.2.3 Recherche secondaire\n \n
      4. 2.2.4 Recherche primaire\n \n \n
        1. 2.2.4.1 Interviews primaires et processus de collecte d'informations\n \n \n
        2. 2.2.4.2 Répartition des répondants principaux\n \n
      5. 2.2.5 Modèle de prévision\n \n
      6. 2.2.6 Estimation de la taille du marché\n \n \n
        1. 2.2.6.1 Approche ascendante\n \n \n
        2. 2.2.6.2 Approche descendante\n \n
      7. 2.2.7 Triangulation des données\n \n
      8. 2.2.8 Validation\n3
  3. SECTION III : ANALYSE QUALITATIVE\n
    1. 3.1 DYNAMIQUE DU MARCHÉ\n \n
      1. 3.1.1 Vue d'ensemble\n \n
      2. 3.1.2 Facteurs moteurs\n \n
      3. 3.1.3 Contraintes\n \n
      4. 3.1.4 Opportunités\n
    2. 3.2 ANALYSE DES FACTEURS DU MARCHÉ\n \n
      1. 3.2.1 Analyse de la chaîne de valeur\n \n
      2. 3.2.2 Analyse des cinq forces de Porter\n \n \n
        1. 3.2.2.1 Pouvoir de négociation des fournisseurs\n \n \n
        2. 3.2.2.2 Pouvoir de négociation des acheteurs\n \n \n
        3. 3.2.2.3 Menace des nouveaux entrants\n \n \n
        4. 3.2.2.4 Menace des substituts\n \n \n
        5. 3.2.2.5 Intensité de la rivalité\n \n
      3. 3.2.3 Analyse de l'impact du COVID-19\n \n \n
        1. 3.2.3.1 Analyse de l'impact sur le marché\n \n \n
        2. 3.2.3.2 Impact régional\n \n \n
        3. 3.2.3.3 Analyse des opportunités et des menaces\n4
  4. SECTION IV : ANALYSE QUANTITATIVE\n
    1. 4.1 Automobile, PAR Système d'exploitation (millions USD)\n \n
      1. 4.1.1 Qnx\n \n
      2. 4.1.2 Linux\n \n
      3. 4.1.3 Microsoft\n \n
      4. 4.1.4 Autres\n
    2. 4.2 Automobile, PAR Type de technologie (millions USD)\n \n
      1. 4.2.1 Lecteur multimédia\n \n
      2. 4.2.2 Systèmes de navigation\n
    3. 4.3 Automobile, PAR Utilisateur final (millions USD)\n \n
      1. 4.3.1 OEM\n \n
      2. 4.3.2 Marché secondaire\n
    4. 4.4 Automobile, PAR Type (millions USD)\n \n
      1. 4.4.1 Système de moniteur de tête\n \n
      2. 4.4.2 Système de plafond\n \n
      3. 4.4.3 Système Plug and Play\n
    5. 4.5 Automobile, PAR Région (millions USD)\n \n
      1. 4.5.1 Amérique du Nord\n \n \n
        1. 4.5.1.1 États-Unis\n \n \n
        2. 4.5.1.2 Canada\n \n
      2. 4.5.2 Europe\n \n \n
        1. 4.5.2.1 Allemagne\n \n \n
        2. 4.5.2.2 Royaume-Uni\n \n \n
        3. 4.5.2.3 France\n \n \n
        4. 4.5.2.4 Russie\n \n \n
        5. 4.5.2.5 Italie\n \n \n
        6. 4.5.2.6 Espagne\n \n \n
        7. 4.5.2.7 Reste de l'Europe\n \n
      3. 4.5.3 APAC\n \n \n
        1. 4.5.3.1 Chine\n \n \n
        2. 4.5.3.2 Inde\n \n \n
        3. 4.5.3.3 Japon\n \n \n
        4. 4.5.3.4 Corée du Sud\n \n \n
        5. 4.5.3.5 Malaisie\n \n \n
        6. 4.5.3.6 Thaïlande\n \n \n
        7. 4.5.3.7 Indonésie\n \n \n
        8. 4.5.3.8 Reste de l'APAC\n \n
      4. 4.5.4 Amérique du Sud\n \n \n
        1. 4.5.4.1 Brésil\n \n \n
        2. 4.5.4.2 Mexique\n \n \n
        3. 4.5.4.3 Argentine\n \n \n
        4. 4.5.4.4 Reste de l'Amérique du Sud\n \n
      5. 4.5.5 MEA\n \n \n
        1. 4.5.5.1 Pays du CCG\n \n \n
        2. 4.5.5.2 Afrique du Sud\n \n \n
        3. 4.5.5.3 Reste de la MEA\n5
  5. SECTION V : ANALYSE CONCURRENTIELLE\n
    1. 5.1 Paysage concurrentiel\n \n
      1. 5.1.1 Vue d'ensemble\n \n
      2. 5.1.2 Analyse concurrentielle\n \n
      3. 5.1.3 Analyse de la part de marché\n \n
      4. 5.1.4 Stratégie de croissance majeure dans l'automobile\n \n
      5. 5.1.5 Évaluation comparative\n \n
      6. 5.1.6 Acteurs principaux en termes de nombre de développements dans l'automobile\n \n
      7. 5.1.7 Développements clés et stratégies de croissance\n \n \n
        1. 5.1.7.1 Lancement de nouveaux produits/Déploiement de services\n \n \n
        2. 5.1.7.2 Fusions & acquisitions\n \n \n
        3. 5.1.7.3 Coentreprises\n \n
      8. 5.1.8 Matrice financière des principaux acteurs\n \n \n
        1. 5.1.8.1 Ventes et revenu d'exploitation\n \n \n
        2. 5.1.8.2 Dépenses de R&D des principaux acteurs. 2023\n
    2. 5.2 Profils d'entreprise\n \n
      1. 5.2.1 Bosch (DE)\n \n \n
        1. 5.2.1.1 Vue d'ensemble financière\n \n \n
        2. 5.2.1.2 Produits offerts\n \n \n
        3. 5.2.1.3 Développements clés\n \n \n
        4. 5.2.1.4 Analyse SWOT\n \n \n
        5. 5.2.1.5 Stratégies clés\n \n
      2. 5.2.2 Continental (DE)\n \n \n
        1. 5.2.2.1 Vue d'ensemble financière\n \n \n
        2. 5.2.2.2 Produits offerts\n \n \n
        3. 5.2.2.3 Développements clés\n \n \n
        4. 5.2.2.4 Analyse SWOT\n \n \n
        5. 5.2.2.5 Stratégies clés\n \n
      3. 5.2.3 Denso (JP)\n \n \n
        1. 5.2.3.1 Vue d'ensemble financière\n \n \n
        2. 5.2.3.2 Produits offerts\n \n \n
        3. 5.2.3.3 Développements clés\n \n \n
        4. 5.2.3.4 Analyse SWOT\n \n \n
        5. 5.2.3.5 Stratégies clés\n \n
      4. 5.2.4 Harman (US)\n \n \n
        1. 5.2.4.1 Vue d'ensemble financière\n \n \n
        2. 5.2.4.2 Produits offerts\n \n \n
        3. 5.2.4.3 Développements clés\n \n \n
        4. 5.2.4.4 Analyse SWOT\n \n \n
        5. 5.2.4.5 Stratégies clés\n \n
      5. 5.2.5 Pioneer (JP)\n \n \n
        1. 5.2.5.1 Vue d'ensemble financière\n \n \n
        2. 5.2.5.2 Produits offerts\n \n \n
        3. 5.2.5.3 Développements clés\n \n \n
        4. 5.2.5.4 Analyse SWOT\n \n \n
        5. 5.2.5.5 Stratégies clés\n \n
      6. 5.2.6 Panasonic (JP)\n \n \n
        1. 5.2.6.1 Vue d'ensemble financière\n \n \n
        2. 5.2.6.2 Produits offerts\n \n \n
        3. 5.2.6.3 Développements clés\n \n \n
        4. 5.2.6.4 Analyse SWOT\n \n \n
        5. 5.2.6.5 Stratégies clés\n \n
      7. 5.2.7 Sony (JP)\n \n \n
        1. 5.2.7.1 Vue d'ensemble financière\n \n \n
        2. 5.2.7.2 Produits offerts\n \n \n
        3. 5.2.7.3 Développements clés\n \n \n
        4. 5.2.7.4 Analyse SWOT\n \n \n
        5. 5.2.7.5 Stratégies clés\n \n
      8. 5.2.8 LG Electronics (KR)\n \n \n
        1. 5.2.8.1 Vue d'ensemble financière\n \n \n
        2. 5.2.8.2 Produits offerts\n \n \n
        3. 5.2.8.3 Développements clés\n \n \n
        4. 5.2.8.4 Analyse SWOT\n \n \n
        5. 5.2.8.5 Stratégies clés\n \n
      9. 5.2.9 Alpine Electronics (JP)\n \n \n
        1. 5.2.9.1 Vue d'ensemble financière\n \n \n
        2. 5.2.9.2 Produits offerts\n \n \n
        3. 5.2.9.3 Développements clés\n \n \n
        4. 5.2.9.4 Analyse SWOT\n \n \n
        5. 5.2.9.5 Stratégies clés\n
    3. 5.3 Annexe\n \n
      1. 5.3.1 Références\n \n
      2. 5.3.2 Rapports connexes\n6 LISTE DES FIGURES\n
    4. 6.1 SYNOPSIS DU MARCHÉ\n
    5. 6.2 ANALYSE DU MARCHÉ EN AMÉRIQUE DU NORD\n
    6. 6.3 ANALYSE DU MARCHÉ AUX ÉTATS-UNIS PAR SYSTÈME D'EXPLOITATION\n
    7. 6.4 ANALYSE DU MARCHÉ AUX ÉTATS-UNIS PAR TYPE DE TECHNOLOGIE\n
    8. 6.5 ANALYSE DU MARCHÉ AUX ÉTATS-UNIS PAR UTILISATEUR FINAL\n
    9. 6.6 ANALYSE DU MARCHÉ AUX ÉTATS-UNIS PAR TYPE\n
    10. 6.7 ANALYSE DU MARCHÉ AU CANADA PAR SYSTÈME D'EXPLOITATION\n
    11. 6.8 ANALYSE DU MARCHÉ AU CANADA PAR TYPE DE TECHNOLOGIE\n
    12. 6.9 ANALYSE DU MARCHÉ AU CANADA PAR UTILISATEUR FINAL\n
    13. 6.10 ANALYSE DU MARCHÉ AU CANADA PAR TYPE\n
    14. 6.11 ANALYSE DU MARCHÉ EN EUROPE\n
    15. 6.12 ANALYSE DU MARCHÉ EN ALLEMAGNE PAR SYSTÈME D'EXPLOITATION\n
    16. 6.13 ANALYSE DU MARCHÉ EN ALLEMAGNE PAR TYPE DE TECHNOLOGIE\n
    17. 6.14 ANALYSE DU MARCHÉ EN ALLEMAGNE PAR UTILISATEUR FINAL\n
    18. 6.15 ANALYSE DU MARCHÉ EN ALLEMAGNE PAR TYPE\n
    19. 6.16 ANALYSE DU MARCHÉ AU ROYAUME-UNI PAR SYSTÈME D'EXPLOITATION\n
    20. 6.17 ANALYSE DU MARCHÉ AU ROYAUME-UNI PAR TYPE DE TECHNOLOGIE\n
    21. 6.18 ANALYSE DU MARCHÉ AU ROYAUME-UNI PAR UTILISATEUR FINAL\n
    22. 6.19 ANALYSE DU MARCHÉ AU ROYAUME-UNI PAR TYPE\n
    23. 6.20 ANALYSE DU MARCHÉ EN FRANCE PAR SYSTÈME D'EXPLOITATION\n
    24. 6.21 ANALYSE DU MARCHÉ EN FRANCE PAR TYPE DE TECHNOLOGIE\n
    25. 6.22 ANALYSE DU MARCHÉ EN FRANCE PAR UTILISATEUR FINAL\n
    26. 6.23 ANALYSE DU MARCHÉ EN FRANCE PAR TYPE\n
    27. 6.24 ANALYSE DU MARCHÉ EN RUSSIE PAR SYSTÈME D'EXPLOITATION\n
    28. 6.25 ANALYSE DU MARCHÉ EN RUSSIE PAR TYPE DE TECHNOLOGIE\n
    29. 6.26 ANALYSE DU MARCHÉ EN RUSSIE PAR UTILISATEUR FINAL\n
    30. 6.27 ANALYSE DU MARCHÉ EN RUSSIE PAR TYPE\n
    31. 6.28 ANALYSE DU MARCHÉ EN ITALIE PAR SYSTÈME D'EXPLOITATION\n
    32. 6.29 ANALYSE DU MARCHÉ EN ITALIE PAR TYPE DE TECHNOLOGIE\n
    33. 6.30 ANALYSE DU MARCHÉ EN ITALIE PAR UTILISATEUR FINAL\n
    34. 6.31 ANALYSE DU MARCHÉ EN ITALIE PAR TYPE\n
    35. 6.32 ANALYSE DU MARCHÉ EN ESPAGNE PAR SYSTÈME D'EXPLOITATION\n
    36. 6.33 ANALYSE DU MARCHÉ EN ESPAGNE PAR TYPE DE TECHNOLOGIE\n
    37. 6.34 ANALYSE DU MARCHÉ EN ESPAGNE PAR UTILISATEUR FINAL\n
    38. 6.35 ANALYSE DU MARCHÉ EN ESPAGNE PAR TYPE\n
    39. 6.36 ANALYSE DU MARCHÉ DANS LE RESTE DE L'EUROPE PAR SYSTÈME D'EXPLOITATION\n
    40. 6.37 ANALYSE DU MARCHÉ DANS LE RESTE DE L'EUROPE PAR TYPE DE TECHNOLOGIE\n
    41. 6.38 ANALYSE DU MARCHÉ DANS LE RESTE DE L'EUROPE PAR UTILISATEUR FINAL\n
    42. 6.39 ANALYSE DU MARCHÉ DANS LE RESTE DE L'EUROPE PAR TYPE\n
    43. 6.40 ANALYSE DU MARCHÉ EN APAC\n
    44. 6.41 ANALYSE DU MARCHÉ EN CHINE PAR SYSTÈME D'EXPLOITATION\n
    45. 6.42 ANALYSE DU MARCHÉ EN CHINE PAR TYPE DE TECHNOLOGIE\n
    46. 6.43 ANALYSE DU MARCHÉ EN CHINE PAR UTILISATEUR FINAL\n
    47. 6.44 ANALYSE DU MARCHÉ EN CHINE PAR TYPE\n
    48. 6.45 ANALYSE DU MARCHÉ EN INDE PAR SYSTÈME D'EXPLOITATION\n
    49. 6.46 ANALYSE DU MARCHÉ EN INDE PAR TYPE DE TECHNOLOGIE\n
    50. 6.47 ANALYSE DU MARCHÉ EN INDE PAR UTILISATEUR FINAL\n
    51. 6.48 ANALYSE DU MARCHÉ EN INDE PAR TYPE\n
    52. 6.49 ANALYSE DU MARCHÉ AU JAPON PAR SYSTÈME D'EXPLOITATION\n
    53. 6.50 ANALYSE DU MARCHÉ AU JAPON PAR TYPE DE TECHNOLOGIE\n
    54. 6.51 ANALYSE DU MARCHÉ AU JAPON PAR UTILISATEUR FINAL\n
    55. 6.52 ANALYSE DU MARCHÉ AU JAPON PAR TYPE\n
    56. 6.53 ANALYSE DU MARCHÉ EN CORÉE DU SUD PAR SYSTÈME D'EXPLOITATION\n
    57. 6.54 ANALYSE DU MARCHÉ EN CORÉE DU SUD PAR TYPE DE TECHNOLOGIE\n
    58. 6.55 ANALYSE DU MARCHÉ EN CORÉE DU SUD PAR UTILISATEUR FINAL\n
    59. 6.56 ANALYSE DU MARCHÉ EN CORÉE DU SUD PAR TYPE\n
    60. 6.57 ANALYSE DU MARCHÉ EN MALAYSIE PAR SYSTÈME D'EXPLOITATION\n
    61. 6.58 ANALYSE DU MARCHÉ EN MALAYSIE PAR TYPE DE TECHNOLOGIE\n
    62. 6.59 ANALYSE DU MARCHÉ EN MALAYSIE PAR UTILISATEUR FINAL\n
    63. 6.60 ANALYSE DU MARCHÉ EN MALAYSIE PAR TYPE\n
    64. 6.61 ANALYSE DU MARCHÉ EN THAÏLANDE PAR SYSTÈME D'EXPLOITATION\n
    65. 6.62 ANALYSE DU MARCHÉ EN THAÏLANDE PAR TYPE DE TECHNOLOGIE\n
    66. 6.63 ANALYSE DU MARCHÉ EN THAÏLANDE PAR UTILISATEUR FINAL\n
    67. 6.64 ANALYSE DU MARCHÉ EN THAÏLANDE PAR TYPE\n
    68. 6.65 ANALYSE DU MARCHÉ EN INDONÉSIE PAR SYSTÈME D'EXPLOITATION\n
    69. 6.66 ANALYSE DU MARCHÉ EN INDONÉSIE PAR TYPE DE TECHNOLOGIE\n
    70. 6.67 ANALYSE DU MARCHÉ EN INDONÉSIE PAR UTILISATEUR FINAL\n
    71. 6.68 ANALYSE DU MARCHÉ EN INDONÉSIE PAR TYPE\n
    72. 6.69 ANALYSE DU MARCHÉ DANS LE RESTE DE L'APAC PAR SYSTÈME D'EXPLOITATION\n
    73. 6.70 ANALYSE DU MARCHÉ DANS LE RESTE DE L'APAC PAR TYPE DE TECHNOLOGIE\n
    74. 6.71 ANALYSE DU MARCHÉ DANS LE RESTE DE L'APAC PAR UTILISATEUR FINAL\n
    75. 6.72 ANALYSE DU MARCHÉ DANS LE RESTE DE L'APAC PAR TYPE\n
    76. 6.73 ANALYSE DU MARCHÉ EN AMÉRIQUE DU SUD\n
    77. 6.74 ANALYSE DU MARCHÉ AU BRÉSIL PAR SYSTÈME D'EXPLOITATION\n
    78. 6.75 ANALYSE DU MARCHÉ AU BRÉSIL PAR TYPE DE TECHNOLOGIE\n
    79. 6.76 ANALYSE DU MARCHÉ AU BRÉSIL PAR UTILISATEUR FINAL\n
    80. 6.77 ANALYSE DU MARCHÉ AU BRÉSIL PAR TYPE\n
    81. 6.78 ANALYSE DU MARCHÉ AU MEXIQUE PAR SYSTÈME D'EXPLOITATION\n
    82. 6.79 ANALYSE DU MARCHÉ AU MEXIQUE PAR TYPE DE TECHNOLOGIE\n
    83. 6.80 ANALYSE DU MARCHÉ AU MEXIQUE PAR UTILISATEUR FINAL\n
    84. 6.81 ANALYSE DU MARCHÉ AU MEXIQUE PAR TYPE\n
    85. 6.82 ANALYSE DU MARCHÉ EN ARGENTINE PAR SYSTÈME D'EXPLOITATION\n
    86. 6.83 ANALYSE DU MARCHÉ EN ARGENTINE PAR TYPE DE TECHNOLOGIE\n
    87. 6.84 ANALYSE DU MARCHÉ EN ARGENTINE PAR UTILISATEUR FINAL\n
    88. 6.85 ANALYSE DU MARCHÉ EN ARGENTINE PAR TYPE\n
    89. 6.86 ANALYSE DU MARCHÉ DANS LE RESTE DE L'AMÉRIQUE DU SUD PAR SYSTÈME D'EXPLOITATION\n
    90. 6.87 ANALYSE DU MARCHÉ DANS LE RESTE DE L'AMÉRIQUE DU SUD PAR TYPE DE TECHNOLOGIE\n
    91. 6.88 ANALYSE DU MARCHÉ DANS LE RESTE DE L'AMÉRIQUE DU SUD PAR UTILISATEUR FINAL\n
    92. 6.89 ANALYSE DU MARCHÉ DANS LE RESTE DE L'AMÉRIQUE DU SUD PAR TYPE\n
    93. 6.90 ANALYSE DU MARCHÉ EN MEA\n
    94. 6.91 ANALYSE DU MARCHÉ DANS LES PAYS DU CCG PAR SYSTÈME D'EXPLOITATION\n
    95. 6.92 ANALYSE DU MARCHÉ DANS LES PAYS DU CCG PAR TYPE DE TECHNOLOGIE\n
    96. 6.93 ANALYSE DU MARCHÉ DANS LES PAYS DU CCG PAR UTILISATEUR FINAL\n
    97. 6.94 ANALYSE DU MARCHÉ DANS LES PAYS DU CCG PAR TYPE\n
    98. 6.95 ANALYSE DU MARCHÉ EN AFRIQUE DU SUD PAR SYSTÈME D'EXPLOITATION\n
    99. 6.96 ANALYSE DU MARCHÉ EN AFRIQUE DU SUD PAR TYPE DE TECHNOLOGIE\n
    100. 6.97 ANALYSE DU MARCHÉ EN AFRIQUE DU SUD PAR UTILISATEUR FINAL\n
    101. 6.98 ANALYSE DU MARCHÉ EN AFRIQUE DU SUD PAR TYPE\n
    102. 6.99 ANALYSE DU MARCHÉ DANS LE RESTE DE LA MEA PAR SYSTÈME D'EXPLOITATION\n
    103. 6.100 ANALYSE DU MARCHÉ DANS LE RESTE DE LA MEA PAR TYPE DE TECHNOLOGIE\n
    104. 6.101 ANALYSE DU MARCHÉ DANS LE RESTE DE LA MEA PAR UTILISATEUR FINAL\n
    105. 6.102 ANALYSE DU MARCHÉ DANS LE RESTE DE LA MEA PAR TYPE\n
    106. 6.103 CRITÈRES D'ACHAT CLÉS DE L'AUTOMOBILE\n
    107. 6.104 PROCESSUS DE RECHERCHE DE MRFR\n
    108. 6.105 ANALYSE DRO DE L'AUTOMOBILE\n
    109. 6.106 ANALYSE D'IMPACT DES FACTEURS MOTRICES : AUTOMOBILE\n
    110. 6.107 ANALYSE D'IMPACT DES CONTRAINTES : AUTOMOBILE\n
    111. 6.108 CHAÎNE D'APPROVISIONNEMENT / VALEUR : AUTOMOBILE\n
    112. 6.109 AUTOMOBILE, PAR SYSTÈME D'EXPLOITATION, 2024 (% PART)\n\n
    113. 6.110 AUTOMOBILE, PAR SYSTÈME D'EXPLOITATION, 2024 À 2035 (millions USD)\n\n
    114. 6.111 AUTOMOBILE, PAR TYPE DE TECHNOLOGIE, 2024 (% PART)\n\n
    115. 6.112 AUTOMOBILE, PAR TYPE DE TECHNOLOGIE, 2024 À 2035 (millions USD)\n\n
    116. 6.113 AUTOMOBILE, PAR UTILISATEUR FINAL, 2024 (% PART)\n\n
    117. 6.114 AUTOMOBILE, PAR UTILISATEUR FINAL, 2024 À 2035 (millions USD)\n\n
    118. 6.115 AUTOMOBILE, PAR TYPE, 2024 (% PART)\n\n
    119. 6.116 AUTOMOBILE, PAR TYPE, 2024 À 2035 (millions USD)\n\n
    120. 6.117 ÉVALUATION DES PRINCIPAUX CONCURRENTS\n7 LISTE DES TABLEAUX\n\n
    121. 7.1 LISTE DES HYPOTHÈSES\n \n
      1. 7.1.1 \n \n
    122. 7.2 ESTIMATIONS DE TAILLE DU MARCHÉ EN AMÉRIQUE DU NORD ; PRÉVISION\n \n
      1. 7.2.1 PAR SYSTÈME D'EXPLOITATION, 2025-2035 (millions USD)\n \n
      2. 7.2.2 PAR TYPE DE TECHNOLOGIE, 2025-2035 (millions USD)\n \n
      3. 7.2.3 PAR UTILISATEUR FINAL, 2025-2035 (millions USD)\n \n
      4. 7.2.4 PAR TYPE, 2025-2035 (millions USD)\n \n
    123. 7.3 ESTIMATIONS DE TAILLE DU MARCHÉ AUX ÉTATS-UNIS ; PRÉVISION\n \n
      1. 7.3.1 PAR SYSTÈME D'EXPLOITATION, 2025-2035 (millions USD)\n \n
      2. 7.3.2 PAR TYPE DE TECHNOLOGIE, 2025-2035 (millions USD)\n \n
      3. 7.3.3 PAR UTILISATEUR FINAL, 2025-2035 (millions USD)\n \n
      4. 7.3.4 PAR TYPE, 2025-2035 (millions USD)\n \n
    124. 7.4 ESTIMATIONS DE TAILLE DU MARCHÉ AU CANADA ; PRÉVISION\n \n
      1. 7.4.1 PAR SYSTÈME D'EXPLOITATION, 2025-2035 (millions USD)\n \n
      2. 7.4.2 PAR TYPE DE TECHNOLOGIE, 2025-2035 (millions USD)\n \n
      3. 7.4.3 PAR UTILISATEUR FINAL, 2025-2035 (millions USD)\n \n
      4. 7.4.4 PAR TYPE, 2025-2035 (millions USD)\n \n
    125. 7.5 ESTIMATIONS DE TAILLE DU MARCHÉ EN EUROPE ; PRÉVISION\n \n
      1. 7.5.1 PAR SYSTÈME D'EXPLOITATION, 2025-2035 (millions USD)\n \n
      2. 7.5.2 PAR TYPE DE TECHNOLOGIE, 2025-2035 (millions USD)\n \n
      3. 7.5.3 PAR UTILISATEUR FINAL, 2025-2035 (millions USD)\n \n
      4. 7.5.4 PAR TYPE, 2025-2035 (millions USD)\n \n
    126. 7.6 ESTIMATIONS DE TAILLE DU MARCHÉ EN ALLEMAGNE ; PRÉVISION\n \n
      1. 7.6.1 PAR SYSTÈME D'EXPLOITATION, 2025-2035 (millions USD)\n \n
      2. 7.6.2 PAR TYPE DE TECHNOLOGIE, 2025-2035 (millions USD)\n \n
      3. 7.6.3 PAR UTILISATEUR FINAL, 2025-2035 (millions USD)\n \n
      4. 7.6.4 PAR TYPE, 2025-2035 (millions USD)\n \n
    127. 7.7 ESTIMATIONS DE TAILLE DU MARCHÉ AU ROYAUME-UNI ; PRÉVISION\n \n
      1. 7.7.1 PAR SYSTÈME D'EXPLOITATION, 2025-2035 (millions USD)\n \n
      2. 7.7.2 PAR TYPE DE TECHNOLOGIE, 2025-2035 (millions USD)\n \n
      3. 7.7.3 PAR UTILISATEUR FINAL, 2025-2035 (millions USD)\n \n
      4. 7.7.4 PAR TYPE, 2025-2035 (millions USD)\n \n
    128. 7.8 ESTIMATIONS DE TAILLE DU MARCHÉ EN FRANCE ; PRÉVISION\n \n
      1. 7.8.1 PAR SYSTÈME D'EXPLOITATION, 2025-2035 (millions USD)\n \n
      2. 7.8.2 PAR TYPE DE TECHNOLOGIE, 2025-2035 (millions USD)\n \n
      3. 7.8.3 PAR UTILISATEUR FINAL, 2025-2035 (millions USD)\n \n
      4. 7.8.4 PAR TYPE, 2025-2035 (millions USD)\n \n
    129. 7.9 ESTIMATIONS DE TAILLE DU MARCHÉ EN RUSSIE ; PRÉVISION\n \n
      1. 7.9.1 PAR SYSTÈME D'EXPLOITATION, 2025-2035 (millions USD)\n \n
      2. 7.9.2 PAR TYPE DE TECHNOLOGIE, 2025-2035 (millions USD)\n \n
      3. 7.9.3 PAR UTILISATEUR FINAL, 2025-2035 (millions USD)\n \n
      4. 7.9.4 PAR TYPE, 2025-2035 (millions USD)\n \n
    130. 7.10 ESTIMATIONS DE TAILLE DU MARCHÉ EN ITALIE ; PRÉVISION\n \n
      1. 7.10.1 PAR SYSTÈME D'EXPLOITATION, 2025-2035 (millions USD)\n \n
      2. 7.10.2 PAR TYPE DE TECHNOLOGIE, 2025-2035 (millions USD)\n \n
      3. 7.10.3 PAR UTILISATEUR FINAL, 2025-2035 (millions USD)\n \n
      4. 7.10.4 PAR TYPE, 2025-2035 (millions USD)\n \n
    131. 7.11 ESTIMATIONS DE TAILLE DU MARCHÉ EN ESPAGNE ; PRÉVISION\n \n
      1. 7.11.1 PAR SYSTÈME D'EXPLOITATION, 2025-2035 (millions USD)\n \n
      2. 7.11.2 PAR TYPE DE TECHNOLOGIE, 2025-2035 (millions USD)\n \n
      3. 7.11.3 PAR UTILISATEUR FINAL, 2025-2035 (millions USD)\n \n
      4. 7.11.4 PAR TYPE, 2025-2035 (millions USD)\n \n
    132. 7.12 ESTIMATIONS DE TAILLE DU MARCHÉ DANS LE RESTE DE L'EUROPE ; PRÉVISION\n \n
      1. 7.12.1 PAR SYSTÈME D'EXPLOITATION, 2025-2035 (millions USD)\n \n
      2. 7.12.2 PAR TYPE DE TECHNOLOGIE, 2025-2035 (millions USD)\n \n
      3. 7.12.3 PAR UTILISATEUR FINAL, 2025-2035 (millions USD)\n \n
      4. 7.12.4 PAR TYPE, 2025-2035 (millions USD)\n \n
    133. 7.13 ESTIMATIONS DE TAILLE DU MARCHÉ EN APAC ; PRÉVISION\n \n
      1. 7.13.1 PAR SYSTÈME D'EXPLOITATION, 2025-2035 (millions USD)\n \n
      2. 7.13.2 PAR TYPE DE TECHNOLOGIE, 2025-2035 (millions USD)\n \n
      3. 7.13.3 PAR UTILISATEUR FINAL, 2025-2035 (millions USD)\n \n
      4. 7.13.4 PAR TYPE, 2025-2035 (millions USD)\n \n
    134. 7.14 ESTIMATIONS DE TAILLE DU MARCHÉ EN CHINE ; PRÉVISION\n \n
      1. 7.14.1 PAR SYSTÈME D'EXPLOITATION, 2025-2035 (millions USD)\n \n
      2. 7.14.2 PAR TYPE DE TECHNOLOGIE, 2025-2035 (millions USD)\n \n
      3. 7.14.3 PAR UTILISATEUR FINAL, 2025-2035 (millions USD)\n \n
      4. 7.14.4 PAR TYPE, 2025-2035 (millions USD)\n \n
    135. 7.15 ESTIMATIONS DE TAILLE DU MARCHÉ EN INDE ; PRÉVISION\n \n
      1. 7.15.1 PAR SYSTÈME D'EXPLOITATION, 2025-2035 (millions USD)\n \n
      2. 7.15.2 PAR TYPE DE TECHNOLOGIE, 2025-2035 (millions USD)\n \n
      3. 7.15.3 PAR UTILISATEUR FINAL, 2025-2035 (millions USD)\n \n
      4. 7.15.4 PAR TYPE, 2025-2035 (millions USD)\n \n
    136. 7.16 ESTIMATIONS DE TAILLE DU MARCHÉ AU JAPON ; PRÉVISION\n \n
      1. 7.16.1 PAR SYSTÈME D'EXPLOITATION, 2025-2035 (millions USD)\n \n
      2. 7.16.2 PAR TYPE DE TECHNOLOGIE, 2025-2035 (millions USD)\n \n
      3. 7.16.3 PAR UTILISATEUR FINAL, 2025-2035 (millions USD)\n \n
      4. 7.16.4 PAR TYPE, 2025-2035 (millions USD)\n \n
    137. 7.17 ESTIMATIONS DE TAILLE DU MARCHÉ EN CORÉE DU SUD ; PRÉVISION\n \n
      1. 7.17.1 PAR SYSTÈME D'EXPLOITATION, 2025-2035 (millions USD)\n \n
      2. 7.17.2 PAR TYPE DE TECHNOLOGIE, 2025-2035 (millions USD)\n \n
      3. 7.17.3 PAR UTILISATEUR FINAL, 2025-2035 (millions USD)\n \n
      4. 7.17.4 PAR TYPE, 2025-2035 (millions USD)\n \n
    138. 7.18 ESTIMATIONS DE TAILLE DU MARCHÉ EN MALAYSIE ; PRÉVISION\n \n
      1. 7.18.1 PAR SYSTÈME D'EXPLOITATION, 2025-2035 (millions USD)\n \n
      2. 7.18.2 PAR TYPE DE TECHNOLOGIE, 2025-2035 (millions USD)\n \n
      3. 7.18.3 PAR UTILISATEUR FINAL, 2025-2035 (millions USD)\n \n
      4. 7.18.4 PAR TYPE, 2025-2035 (millions USD)\n \n
    139. 7.19 ESTIMATIONS DE TAILLE DU MARCHÉ EN THAÏLANDE ; PRÉVISION\n \n
      1. 7.19.1 PAR SYSTÈME D'EXPLOITATION, 2025-2035 (millions USD)\n \n
      2. 7.19.2 PAR TYPE DE TECHNOLOGIE, 2025-2035 (millions USD)\n \n
      3. 7.19.3 PAR UTILISATEUR FINAL, 2025-2035 (millions USD)\n \n
      4. 7.19.4 PAR TYPE, 2025-2035 (millions USD)\n \n
    140. 7.20 ESTIMATIONS DE TAILLE DU MARCHÉ EN INDONÉSIE ; PRÉVISION\n \n
      1. 7.20.1 PAR SYSTÈME D'EXPLOITATION, 2025-2035 (millions USD)\n \n
      2. 7.20.2 PAR TYPE DE TECHNOLOGIE, 2025-2035 (millions USD)\n \n
      3. 7.20.3 PAR UTILISATEUR FINAL, 2025-2035 (millions USD)\n \n
      4. 7.20.4 PAR TYPE, 2025-2035 (millions USD)\n \n
    141. 7.21 ESTIMATIONS DE TAILLE DU MARCHÉ DANS LE RESTE DE L'APAC ; PRÉVISION\n \n
      1. 7.21.1 PAR SYSTÈME D'EXPLOITATION, 2025-2035 (millions USD)\n \n
      2. 7.21.2 PAR TYPE DE TECHNOLOGIE, 2025-2035 (millions USD)\n \n
      3. 7.21.3 PAR UTILISATEUR FINAL, 2025-2035 (millions USD)\n \n
      4. 7.21.4 PAR TYPE, 2025-2035 (millions USD)\n \n
    142. 7.22 ESTIMATIONS DE TAILLE DU MARCHÉ EN AMÉRIQUE DU SUD ; PRÉVISION\n \n
      1. 7.22.1 PAR SYSTÈME D'EXPLOITATION, 2025-2035 (millions USD)\n \n
      2. 7.22.2 PAR TYPE DE TECHNOLOGIE, 2025-2035 (millions USD)\n \n
      3. 7.22.3 PAR UTILISATEUR FINAL, 2025-2035 (millions USD)\n \n
      4. 7.22.4 PAR TYPE, 2025-2035 (millions USD)\n \n
    143. 7.23 ESTIMATIONS DE TAILLE DU MARCHÉ AU BRÉSIL ; PRÉVISION\n \n
      1. 7.23.1 PAR SYSTÈME D'EXPLOITATION, 2025-2035 (millions USD)\n \n
      2. 7.23.2 PAR TYPE DE TECHNOLOGIE, 2025-2035 (millions USD)\n \n
      3. 7.23.3 PAR UTILISATEUR FINAL, 2025-2035 (millions USD)\n \n
      4. 7.23.4 PAR TYPE, 2025-2035 (millions USD)\n \n
    144. 7.24 ESTIMATIONS DE TAILLE DU MARCHÉ AU MEXIQUE ; PRÉVISION\n \n
      1. 7.24.1 PAR SYSTÈME D'EXPLOITATION, 2025-2035 (millions USD)\n \n
      2. 7.24.2 PAR TYPE DE TECHNOLOGIE, 2025-2035 (millions USD)\n \n
      3. 7.24.3 PAR UTILISATEUR FINAL, 2025-2035 (millions USD)\n \n
      4. 7.24.4 PAR TYPE, 2025-2035 (millions USD)\n \n
    145. 7.25 ESTIMATIONS DE TAILLE DU MARCHÉ EN ARGENTINE ; PRÉVISION\n \n
      1. 7.25.1 PAR SYSTÈME D'EXPLOITATION, 2025-2035 (millions USD)\n \n
      2. 7.25.2 PAR TYPE DE TECHNOLOGIE, 2025-2035 (millions USD)\n \n
      3. 7.25.3 PAR UTILISATEUR FINAL, 2025-2035 (millions USD)\n \n
      4. 7.25.4 PAR TYPE, 2025-2035 (millions USD)\n \n
    146. 7.26 ESTIMATIONS DE TAILLE DU MARCHÉ DANS LE RESTE DE L'AMÉRIQUE DU SUD ; PRÉVISION\n \n
      1. 7.26.1 PAR SYSTÈME D'EXPLOITATION, 2025-2035 (millions USD)\n \n
      2. 7.26.2 PAR TYPE DE TECHNOLOGIE, 2025-2035 (millions USD)\n \n
      3. 7.26.3 PAR UTILISATEUR FINAL, 2025-2035 (millions USD)\n \n
      4. 7.26.4 PAR TYPE, 2025-2035 (millions USD)\n \n
    147. 7.27 ESTIMATIONS DE TAILLE DU MARCHÉ EN MEA ; PRÉVISION\n \n
      1. 7.27.1 PAR SYSTÈME D'EXPLOITATION, 2025-2035 (millions USD)\n \n
      2. 7.27.2 PAR TYPE DE TECHNOLOGIE, 2025-2035 (millions USD)\n \n
      3. 7.27.3 PAR UTILISATEUR FINAL, 2025-2035 (millions USD)\n \n
      4. 7.27.4 PAR TYPE, 2025-2035 (millions USD)\n \n
    148. 7.28 ESTIMATIONS DE TAILLE DU MARCHÉ DANS LES PAYS DU CCG ; PRÉVISION\n \n
      1. 7.28.1 PAR SYSTÈME D'EXPLOITATION, 2025-2035 (millions USD)\n \n
      2. 7.28.2 PAR TYPE DE TECHNOLOGIE, 2025-2035 (millions USD)\n \n
      3. 7.28.3 PAR UTILISATEUR FINAL, 2025-2035 (millions USD)\n \n
      4. 7.28.4 PAR TYPE, 2025-2035 (millions USD)\n \n
    149. 7.29 ESTIMATIONS DE TAILLE DU MARCHÉ EN AFRIQUE DU SUD ; PRÉVISION\n \n
      1. 7.29.1 PAR SYSTÈME D'EXPLOITATION, 2025-2035 (millions USD)\n \n
      2. 7.29.2 PAR TYPE DE TECHNOLOGIE, 2025-2035 (millions USD)\n \n
      3. 7.29.3 PAR UTILISATEUR FINAL, 2025-2035 (millions USD)\n \n
      4. 7.29.4 PAR TYPE, 2025-2035 (millions USD)\n \n
    150. 7.30 ESTIMATIONS DE TAILLE DU MARCHÉ DANS LE RESTE DE LA MEA ; PRÉVISION\n \n
      1. 7.30.1 PAR SYSTÈME D'EXPLOITATION, 2025-2035 (millions USD)\n \n
      2. 7.30.2 PAR TYPE DE TECHNOLOGIE, 2025-2035 (millions USD)\n \n
      3. 7.30.3 PAR UTILISATEUR FINAL, 2025-2035 (millions USD)\n \n
      4. 7.30.4 PAR TYPE, 2025-2035 (millions USD)\n \n
    151. 7.31 LANCEMENT DE PRODUIT/DÉVELOPPEMENT DE PRODUIT/APPROBATION\n \n
      1. 7.31.1 \n \n
    152. 7.32 ACQUISITION/PARTENARIAT\n \n

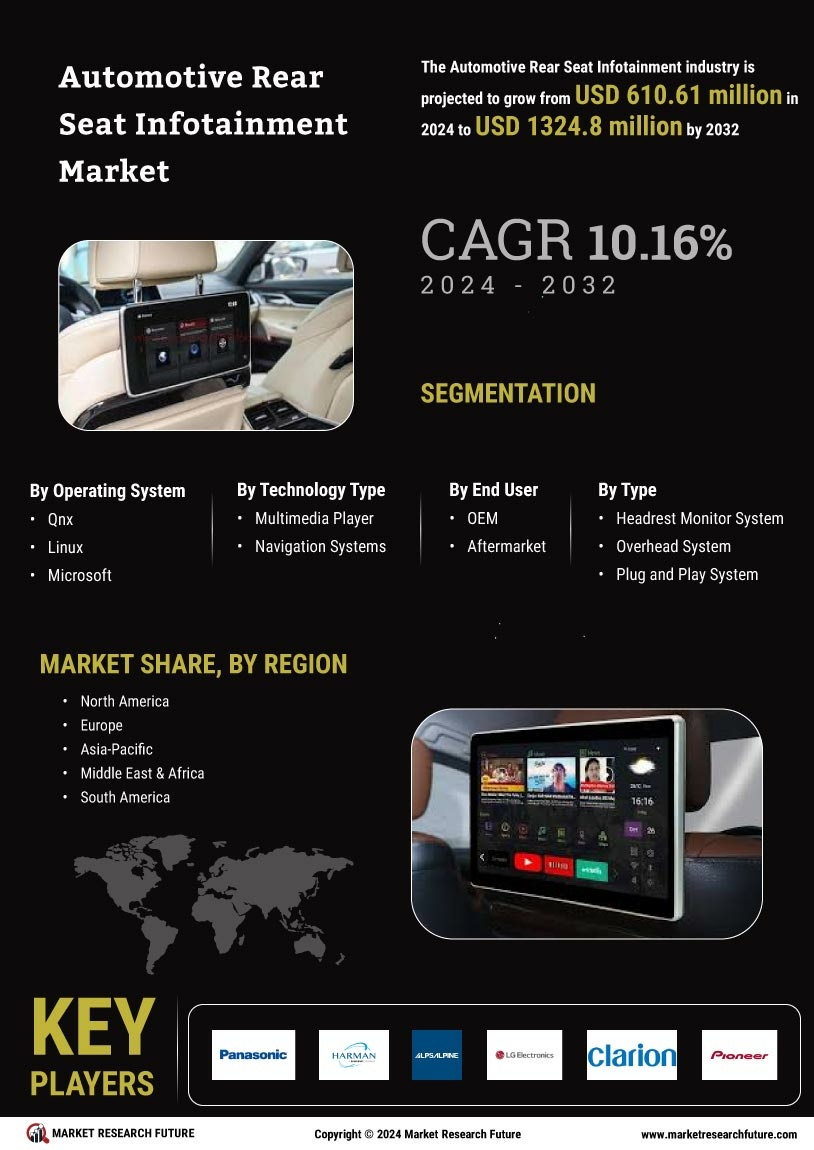
Segmentation du marché de l'infodivertissement arrière automobile

  • Infodivertissement arrière automobile mondial, par perspective du système d'exploitation (millions USD, 2018-2032)
    • Qnx
    • Linux
    • Microsoft
    • Autres
  • Infodivertissement arrière automobile mondial, par type de technologie (millions USD, 2018-2032)
    • Lecteur multimédia
    • Systèmes de navigation
  • Infodivertissement arrière automobile mondial, par perspective de l'utilisateur final (millions USD, 2018-2032)
    • OEM
    • Après-vente
  • Infodivertissement arrière automobile mondial, par type (millions USD, 2018-2032)
    • Système de moniteur de tête
    • Système de plafond
    • Système plug and play

Perspectives régionales de l'infodivertissement arrière automobile mondial (millions USD, 2018-2032)

  • Perspectives de l'Amérique du Nord (millions USD, 2018-2032)
  • Infodivertissement arrière automobile en Amérique du Nord, par perspective du système d'exploitation (millions USD, 2018-2032)
    • Qnx
    • Linux
    • Microsoft
    • Autres
  • Infodivertissement arrière automobile en Amérique du Nord, par type de technologie (millions USD, 2018-2032)
    • Lecteur multimédia
    • Systèmes de navigation
  • Infodivertissement arrière automobile en Amérique du Nord, par perspective de l'utilisateur final (millions USD, 2018-2032)
    • OEM
    • Après-vente
  • Infodivertissement arrière automobile en Amérique du Nord, par type (millions USD, 2018-2032)
    • Système de moniteur de tête
    • Système de plafond
    • Système plug and play


  • Perspectives des États-Unis (millions USD, 2018-2032)
  • Infodivertissement arrière automobile aux États-Unis, par perspective du système d'exploitation (millions USD, 2018-2032)
    • Qnx
    • Linux
    • Microsoft
    • Autres
  • Infodivertissement arrière automobile aux États-Unis, par type de technologie (millions USD, 2018-2032)
    • Lecteur multimédia
    • Systèmes de navigation
  • Infodivertissement arrière automobile aux États-Unis, par perspective de l'utilisateur final (millions USD, 2018-2032)
    • OEM
    • Après-vente
  • Infodivertissement arrière automobile aux États-Unis, par type (millions USD, 2018-2032)
    • Système de moniteur de tête
    • Système de plafond
    • Système plug and play
  • Perspectives du Canada (millions USD, 2018-2032)
  • Infodivertissement arrière automobile au Canada, par perspective du système d'exploitation (millions USD, 2018-2032)
    • Qnx
    • Linux
    • Microsoft
    • Autres
  • Infodivertissement arrière automobile au Canada, par type de technologie (millions USD, 2018-2032)
    • Lecteur multimédia
    • Systèmes de navigation
  • Infodivertissement arrière automobile au Canada, par perspective de l'utilisateur final (millions USD, 2018-2032)
    • OEM
    • Après-vente
  • Infodivertissement arrière automobile au Canada, par type (millions USD, 2018-2032)
    • Système de moniteur de tête
    • Système de plafond
    • Système plug and play
  • Perspectives du Mexique (millions USD, 2018-2032)
  • Infodivertissement arrière automobile au Mexique, par perspective du système d'exploitation (millions USD, 2018-2032)
    • Qnx
    • Linux
    • Microsoft
    • Autres
  • Infodivertissement arrière automobile au Mexique, par type de technologie (millions USD, 2018-2032)
    • Lecteur multimédia
    • Systèmes de navigation
  • Infodivertissement arrière automobile au Mexique, par perspective de l'utilisateur final (millions USD, 2018-2032)
    • OEM
    • Après-vente
  • Infodivertissement arrière automobile au Mexique, par type (millions USD, 2018-2032)
    • Système de moniteur de tête
    • Système de plafond
    • Système plug and play
  • Perspectives de l'Europe (millions USD, 2018-2032)
  • Infodivertissement arrière automobile en Europe, par perspective du système d'exploitation (millions USD, 2018-2032)
    • Qnx
    • Linux
    • Microsoft
    • Autres
  • Infodivertissement arrière automobile en Europe, par type de technologie (millions USD, 2018-2032)
    • Lecteur multimédia
    • Systèmes de navigation
  • Infodivertissement arrière automobile en Europe, par perspective de l'utilisateur final (millions USD, 2018-2032)
    • OEM
    • Après-vente
  • Infodivertissement arrière automobile en Europe, par type (millions USD, 2018-2032)
    • Système de moniteur de tête
    • Système de plafond
    • Système plug and play


  • Perspectives de l'Allemagne (millions USD, 2018-2032)
  • Infodivertissement arrière automobile en Allemagne, par perspective du système d'exploitation (millions USD, 2018-2032)
    • Qnx
    • Linux
    • Microsoft
    • Autres
  • Infodivertissement arrière automobile en Allemagne, par type de technologie (millions USD, 2018-2032)
    • Lecteur multimédia
    • Systèmes de navigation
  • Infodivertissement arrière automobile en Allemagne, par perspective de l'utilisateur final (millions USD, 2018-2032)
    • OEM
    • Après-vente
  • Infodivertissement arrière automobile en Allemagne, par type (millions USD, 2018-2032)
    • Système de moniteur de tête
    • Système de plafond
    • Système plug and play


  • Perspectives de la France (millions USD, 2018-2032)
  • Infodivertissement arrière automobile en France, par perspective du système d'exploitation (millions USD, 2018-2032)
    • Qnx
    • Linux
    • Microsoft
    • Autres
  • Infodivertissement arrière automobile en France, par type de technologie (millions USD, 2018-2032)
    • Lecteur multimédia
    • Systèmes de navigation
  • Infodivertissement arrière automobile en France, par perspective de l'utilisateur final (millions USD, 2018-2032)
    • OEM
    • Après-vente
  • Infodivertissement arrière automobile en France, par type (millions USD, 2018-2032)
    • Système de moniteur de tête
    • Système de plafond
    • Système plug and play


  • Perspectives du Royaume-Uni (millions USD, 2018-2032)
  • Infodivertissement arrière automobile au Royaume-Uni, par perspective du système d'exploitation (millions USD, 2018-2032)
    • Qnx
    • Linux
    • Microsoft
    • Autres
  • Infodivertissement arrière automobile au Royaume-Uni, par type de technologie (millions USD, 2018-2032)
    • Lecteur multimédia
    • Systèmes de navigation
  • Infodivertissement arrière automobile au Royaume-Uni, par perspective de l'utilisateur final (millions USD, 2018-2032)
    • OEM
    • Après-vente
  • Infodivertissement arrière automobile au Royaume-Uni, par type (millions USD, 2018-2032)
    • Système de moniteur de tête
    • Système de plafond
    • Système plug and play


  • Perspectives du reste de l'Europe (millions USD, 2018-2032)
  • Infodivertissement arrière automobile dans le reste de l'Europe, par perspective du système d'exploitation (millions USD, 2018-2032)
    • Qnx
    • Linux
    • Microsoft
    • Autres
  • Infodivertissement arrière automobile dans le reste de l'Europe, par type de technologie (millions USD, 2018-2032)
    • Lecteur multimédia
    • Systèmes de navigation
  • Infodivertissement arrière automobile dans le reste de l'Europe, par perspective de l'utilisateur final (millions USD, 2018-2032)
    • OEM
    • Après-vente
  • Infodivertissement arrière automobile dans le reste de l'Europe, par type (millions USD, 2018-2032)
    • Système de moniteur de tête
    • Système de plafond
    • Système plug and play


  • Perspectives de la région Asie-Pacifique (millions USD, 2018-2032)
  • Infodivertissement arrière automobile dans la région Asie-Pacifique, par perspective du système d'exploitation (millions USD, 2018-2032)
    • Qnx
    • Linux
    • Microsoft
    • Autres
  • Infodivertissement arrière automobile dans la région Asie-Pacifique, par type de technologie (millions USD, 2018-2032)
    • Lecteur multimédia
    • Systèmes de navigation
  • Infodivertissement arrière automobile dans la région Asie-Pacifique, par perspective de l'utilisateur final (millions USD, 2018-2032)
    • OEM
    • Après-vente
  • Infodivertissement arrière automobile dans la région Asie-Pacifique, par type (millions USD, 2018-2032)
    • Système de moniteur de tête
    • Système de plafond
    • Système plug and play


  • Perspectives de la Chine (millions USD, 2018-2032)
  • Infodivertissement arrière automobile en Chine, par perspective du système d'exploitation (millions USD, 2018-2032)
    • Qnx
    • Linux
    • Microsoft
    • Autres
  • Infodivertissement arrière automobile en Chine, par type de technologie (millions USD, 2018-2032)
    • Lecteur multimédia
    • Systèmes de navigation
  • Infodivertissement arrière automobile en Chine, par perspective de l'utilisateur final (millions USD, 2018-2032)
    • OEM
    • Après-vente
  • Infodivertissement arrière automobile en Chine, par type (millions USD, 2018-2032)
    • Système de moniteur de tête
    • Système de plafond
    • Système plug and play


  • Perspectives de l'Inde (millions USD, 2018-2032)
  • Infodivertissement arrière automobile en Inde, par perspective du système d'exploitation (millions USD, 2018-2032)
    • Qnx
    • Linux
    • Microsoft
    • Autres
  • Infodivertissement arrière automobile en Inde, par type de technologie (millions USD, 2018-2032)
    • Lecteur multimédia
    • Systèmes de navigation
  • Infodivertissement arrière automobile en Inde, par perspective de l'utilisateur final (millions USD, 2018-2032)
    • OEM
    • Après-vente
  • Infodivertissement arrière automobile en Inde, par type (millions USD, 2018-2032)
    • Système de moniteur de tête
    • Système de plafond
    • Système plug and play


  • Perspectives du Japon (millions USD, 2018-2032)
  • Infodivertissement arrière automobile au Japon, par perspective du système d'exploitation (millions USD, 2018-2032)
    • Qnx
    • Linux
    • Microsoft
    • Autres
  • Infodivertissement arrière automobile au Japon, par type de technologie (millions USD, 2018-2032)
    • Lecteur multimédia
    • Systèmes de navigation
  • Infodivertissement arrière automobile au Japon, par perspective de l'utilisateur final (millions USD, 2018-2032)
    • OEM
    • Après-vente
  • Infodivertissement arrière automobile au Japon, par type (millions USD, 2018-2032)
    • Système de moniteur de tête
    • Système de plafond
    • Système plug and play


  • Perspectives du reste de la région Asie-Pacifique (millions USD, 2018-2032)
  • Infodivertissement arrière automobile dans le reste de la région Asie-Pacifique, par perspective du système d'exploitation (millions USD, 2018-2032)
    • Qnx
    • Linux
    • Microsoft
    • Autres
  • Infodivertissement arrière automobile dans le reste de la région Asie-Pacifique, par type de technologie (millions USD, 2018-2032)
    • Lecteur multimédia
    • Systèmes de navigation
  • Infodivertissement arrière automobile dans le reste de la région Asie-Pacifique, par perspective de l'utilisateur final (millions USD, 2018-2032)
    • OEM
    • Après-vente
  • Infodivertissement arrière automobile dans le reste de la région Asie-Pacifique, par type (millions USD, 2018-2032)
    • Système de moniteur de tête
    • Système de plafond
    • Système plug and play
  • Perspectives du Moyen-Orient et de l'Afrique (millions USD, 2018-2032)
  • Infodivertissement arrière automobile au Moyen-Orient et en Afrique, par perspective du système d'exploitation (millions USD, 2018-2032)
    • Qnx
    • Linux
    • Microsoft
    • Autres
  • Infodivertissement arrière automobile au Moyen-Orient et en Afrique, par type de technologie (millions USD, 2018-2032)
    • Lecteur multimédia
    • Systèmes de navigation
  • Infodivertissement arrière automobile au Moyen-Orient et en Afrique, par perspective de l'utilisateur final (millions USD, 2018-2032)
    • OEM
    • Après-vente
  • Infodivertissement arrière automobile au Moyen-Orient et en Afrique, par type (millions USD, 2018-2032)
    • Système de moniteur de tête
    • Système de plafond
    • Système plug and play


  • Perspectives des pays du CCG (millions USD, 2018-2032)
  • Infodivertissement arrière automobile dans les pays du CCG, par perspective du système d'exploitation (millions USD, 2018-2032)
    • Qnx
    • Linux
    • Microsoft
    • Autres
  • Infodivertissement arrière automobile dans les pays du CCG, par type de technologie (millions USD, 2018-2032)
    • Lecteur multimédia
    • Systèmes de navigation
  • Infodivertissement arrière automobile dans les pays du CCG, par perspective de l'utilisateur final (millions USD, 2018-2032)
    • OEM
    • Après-vente
  • Infodivertissement arrière automobile dans les pays du CCG, par type (millions USD, 2018-2032)
    • Système de moniteur de tête
    • Système de plafond
    • Système plug and play


  • Perspectives de l'Afrique du Sud (millions USD, 2018-2032)
  • Infodivertissement arrière automobile en Afrique du Sud, par perspective du système d'exploitation (millions USD, 2018-2032)
    • Qnx
    • Linux
    • Microsoft
    • Autres
  • Infodivertissement arrière automobile en Afrique du Sud, par type de technologie (millions USD, 2018-2032)
    • Lecteur multimédia
    • Systèmes de navigation
  • Infodivertissement arrière automobile en Afrique du Sud, par perspective de l'utilisateur final (millions USD, 2018-2032)
    • OEM
    • Après-vente
  • Infodivertissement arrière automobile en Afrique du Sud, par type (millions USD, 2018-2032)
    • Système de moniteur de tête
    • Système de plafond
    • Système plug and play


  • Perspectives du reste du Moyen-Orient et de l'Afrique (millions USD, 2018-2032)
  • Infodivertissement arrière automobile dans le reste du Moyen-Orient et de l'Afrique, par perspective du système d'exploitation (millions USD, 2018-2032)
    • Qnx
    • Linux
    • Microsoft
    • Autres
  • Infodivertissement arrière automobile dans le reste du Moyen-Orient et de l'Afrique, par type de technologie (millions USD, 2018-2032)
    • Lecteur multimédia
    • Systèmes de navigation
  • Infodivertissement arrière automobile dans le reste du Moyen-Orient et de l'Afrique, par perspective de l'utilisateur final (millions USD, 2018-2032)
    • OEM
    • Après-vente
  • Infodivertissement arrière automobile dans le reste du Moyen-Orient et de l'Afrique, par type (millions USD, 2018-2032)
    • Système de moniteur de tête
    • Système de plafond
    • Système plug and play
  • Perspectives de l'Amérique du Sud (millions USD, 2018-2032)
  • Infodivertissement arrière automobile en Amérique du Sud, par perspective du système d'exploitation (millions USD, 2018-2032)
    • Qnx
    • Linux
    • Microsoft
    • Autres
  • Infodivertissement arrière automobile en Amérique du Sud, par type de technologie (millions USD, 2018-2032)
    • Lecteur multimédia
    • Systèmes de navigation
  • Infodivertissement arrière automobile en Amérique du Sud, par perspective de l'utilisateur final (millions USD, 2018-2032)
    • OEM
    • Après-vente
  • Infodivertissement arrière automobile en Amérique du Sud, par type (millions USD, 2018-2032)
    • Système de moniteur de tête
    • Système de plafond
    • Système plug and play
    • Perspectives du Chili (millions USD, 2018-2032)
    • Infodivertissement arrière automobile au Chili, par perspective du système d'exploitation (millions USD, 2018-2032)
      • Qnx
      • Linux
      • Microsoft
      • Autres
    • Infodivertissement arrière automobile au Chili, par type de technologie (millions USD, 2018-2032)
      • Lecteur multimédia
      • Systèmes de navigation
    • Infodivertissement arrière automobile au Chili, par perspective de l'utilisateur final (millions USD, 2018-2032)
      • OEM
      • Après-vente
    • Infodivertissement arrière automobile au Chili, par type (millions USD, 2018-2032)
      • Système de moniteur de tête
      • Système de plafond
      • Système plug and play


  • Perspectives du Brésil (millions USD, 2018-2032)
  • Infodivertissement arrière automobile au Brésil, par perspective du système d'exploitation (millions USD, 2018-2032)
    • Qnx
    • Linux
    • Microsoft
    • Autres
  • Infodivertissement arrière automobile au Brésil, par type de technologie (millions USD, 2018-2032)
    • Lecteur multimédia
    • Systèmes de navigation
  • Infodivertissement arrière automobile au Brésil, par perspective de l'utilisateur final (millions USD, 2018-2032)
    • OEM
    • Après-vente
  • Infodivertissement arrière automobile au Brésil, par type (millions USD, 2018-2032)
    • Système de moniteur de tête
    • Système de plafond
    • Système plug and play


  • Perspectives du reste de l'Amérique du Sud (millions USD, 2018-2032)
  • Infodivertissement arrière automobile dans le reste de l'Amérique du Sud, par perspective du système d'exploitation (millions USD, 2018-2032)
    • Qnx
    • Linux
    • Microsoft
    • Autres
  • Infodivertissement arrière automobile dans le reste de l'Amérique du Sud, par type de technologie (millions USD, 2018-2032)
    • Lecteur multimédia
    • Systèmes de navigation
  • Infodivertissement arrière automobile dans le reste de l'Amérique du Sud, par perspective de l'utilisateur final (millions USD, 2018-2032)
    • OEM
    • Après-vente
  • Infodivertissement arrière automobile dans le reste de l'Amérique du Sud, par type (millions USD, 2018-2032)
    • Système de moniteur de tête
    • Système de plafond
    • Système plug and play

Compare Licence

×
Features License Type
Single User Multiuser License Enterprise User
Price $4,950 $5,950 $7,250
Maximum User Access Limit 1 User Upto 10 Users Unrestricted Access Throughout the Organization
Free Customization
Direct Access to Analyst
Deliverable Format
Platform Access
Discount on Next Purchase 10% 15% 15%
Printable Versions