Request Free Sample ×

Kindly complete the form below to receive a free sample of this Report

* Please use a valid business email

Leading companies partner with us for data-driven Insights

clients tt-cursor
Hero Background

Marché de l'infodivertissement automobile

ID: MRFR/AT/2676-CR
134 Pages
Shubham Munde
Last Updated: April 06, 2026

Rapport de recherche sur le marché de l'infodivertissement automobile Informations par système d'exploitation (QNX, Linux, Microsoft, et autres), et par région (Amérique du Nord, Europe, Asie-Pacifique, et reste du monde) – Prévisions du marché jusqu'en 2035

Partager
Download PDF ×

We do not share your information with anyone. However, we may send you emails based on your report interest from time to time. You may contact us at any time to opt-out.

Automotive Infotainment Market Infographic
Purchase Options
  1. SECTION I : RÉSUMÉ EXÉCUTIF ET POINTS CLÉS
    1. 1.1 RÉSUMÉ EXÉCUTIF
      1. 1.1.1 Aperçu du marché
      2. 1.1.2 Conclusions clés
      3. 1.1.3 Segmentation du marché
      4. 1.1.4 Paysage concurrentiel
      5. 1.1.5 Défis et opportunités
      6. 1.1.6 Perspectives futures 2
  2. SECTION II : DÉLIMITATION, MÉTHODOLOGIE ET STRUCTURE DU MARCHÉ
    1. 2.1 INTRODUCTION AU MARCHÉ
      1. 2.1.1 Définition
      2. 2.1.2 Portée de l'étude
        1. 2.1.2.1 Objectif de recherche
        2. 2.1.2.2 Hypothèse
        3. 2.1.2.3 Limitations
    2. 2.2 MÉTHODOLOGIE DE RECHERCHE
      1. 2.2.1 Aperçu
      2. 2.2.2 Exploration de données
      3. 2.2.3 Recherche secondaire
      4. 2.2.4 Recherche primaire
        1. 2.2.4.1 Interviews primaires et processus de collecte d'informations
        2. 2.2.4.2 Répartition des répondants principaux
      5. 2.2.5 Modèle de prévision
      6. 2.2.6 Estimation de la taille du marché
        1. 2.2.6.1 Approche ascendante
        2. 2.2.6.2 Approche descendante
      7. 2.2.7 Triangulation des données
      8. 2.2.8 Validation 3
  3. SECTION III : ANALYSE QUALITATIVE
    1. 3.1 DYNAMIQUE DU MARCHÉ
      1. 3.1.1 Aperçu
      2. 3.1.2 Facteurs moteurs
      3. 3.1.3 Contraintes
      4. 3.1.4 Opportunités
    2. 3.2 ANALYSE DES FACTEURS DU MARCHÉ
      1. 3.2.1 Analyse de la chaîne de valeur
      2. 3.2.2 Analyse des cinq forces de Porter
        1. 3.2.2.1 Pouvoir de négociation des fournisseurs
        2. 3.2.2.2 Pouvoir de négociation des acheteurs
        3. 3.2.2.3 Menace des nouveaux entrants
        4. 3.2.2.4 Menace des substituts
        5. 3.2.2.5 Intensité de la rivalité
      3. 3.2.3 Analyse de l'impact du COVID-19
        1. 3.2.3.1 Analyse de l'impact sur le marché
        2. 3.2.3.2 Impact régional
        3. 3.2.3.3 Analyse des opportunités et des menaces 4
  4. SECTION IV : ANALYSE QUANTITATIVE
    1. 4.1 Automobile, PAR Système d'exploitation (milliards USD)
      1. 4.1.1 QNX
      2. 4.1.2 Linux
      3. 4.1.3 Microsoft
      4. 4.1.4 Autres
    2. 4.2 Automobile, PAR Région (milliards USD)
      1. 4.2.1 Amérique du Nord
        1. 4.2.1.1 États-Unis
        2. 4.2.1.2 Canada
      2. 4.2.2 Europe
        1. 4.2.2.1 Allemagne
        2. 4.2.2.2 Royaume-Uni
        3. 4.2.2.3 France
        4. 4.2.2.4 Russie
        5. 4.2.2.5 Italie
        6. 4.2.2.6 Espagne
        7. 4.2.2.7 Reste de l'Europe
      3. 4.2.3 APAC
        1. 4.2.3.1 Chine
        2. 4.2.3.2 Inde
        3. 4.2.3.3 Japon
        4. 4.2.3.4 Corée du Sud
        5. 4.2.3.5 Malaisie
        6. 4.2.3.6 Thaïlande
        7. 4.2.3.7 Indonésie
        8. 4.2.3.8 Reste de l'APAC
      4. 4.2.4 Amérique du Sud
        1. 4.2.4.1 Brésil
        2. 4.2.4.2 Mexique
        3. 4.2.4.3 Argentine
        4. 4.2.4.4 Reste de l'Amérique du Sud
      5. 4.2.5 MEA
        1. 4.2.5.1 Pays du CCG
        2. 4.2.5.2 Afrique du Sud
        3. 4.2.5.3 Reste de la MEA 5
  5. SECTION V : ANALYSE CONCURRENTIELLE
    1. 5.1 Paysage concurrentiel
      1. 5.1.1 Aperçu
      2. 5.1.2 Analyse concurrentielle
      3. 5.1.3 Analyse de la part de marché
      4. 5.1.4 Stratégie de croissance majeure dans l'automobile
      5. 5.1.5 Évaluation comparative
      6. 5.1.6 Acteurs principaux en termes de nombre de développements dans l'automobile
      7. 5.1.7 Développements clés et stratégies de croissance
        1. 5.1.7.1 Lancement de nouveaux produits/Déploiement de services
        2. 5.1.7.2 Fusions et acquisitions
        3. 5.1.7.3 Coentreprises
      8. 5.1.8 Matrice financière des principaux acteurs
        1. 5.1.8.1 Ventes et revenu d'exploitation
        2. 5.1.8.2 Dépenses de R&D des principaux acteurs. 2023
    2. 5.2 Profils d'entreprise
      1. 5.2.1 Robert Bosch GmbH (DE)
        1. 5.2.1.1 Aperçu financier
        2. 5.2.1.2 Produits offerts
        3. 5.2.1.3 Développements clés
        4. 5.2.1.4 Analyse SWOT
        5. 5.2.1.5 Stratégies clés
      2. 5.2.2 Denso Corporation (JP)
        1. 5.2.2.1 Aperçu financier
        2. 5.2.2.2 Produits offerts
        3. 5.2.2.3 Développements clés
        4. 5.2.2.4 Analyse SWOT
        5. 5.2.2.5 Stratégies clés
      3. 5.2.3 Continental AG (DE)
        1. 5.2.3.1 Aperçu financier
        2. 5.2.3.2 Produits offerts
        3. 5.2.3.3 Développements clés
        4. 5.2.3.4 Analyse SWOT
        5. 5.2.3.5 Stratégies clés
      4. 5.2.4 Harman International (US)
        1. 5.2.4.1 Aperçu financier
        2. 5.2.4.2 Produits offerts
        3. 5.2.4.3 Développements clés
        4. 5.2.4.4 Analyse SWOT
        5. 5.2.4.5 Stratégies clés
      5. 5.2.5 Pioneer Corporation (JP)
        1. 5.2.5.1 Aperçu financier
        2. 5.2.5.2 Produits offerts
        3. 5.2.5.3 Développements clés
        4. 5.2.5.4 Analyse SWOT
        5. 5.2.5.5 Stratégies clés
      6. 5.2.6 Panasonic Corporation (JP)
        1. 5.2.6.1 Aperçu financier
        2. 5.2.6.2 Produits offerts
        3. 5.2.6.3 Développements clés
        4. 5.2.6.4 Analyse SWOT
        5. 5.2.6.5 Stratégies clés
      7. 5.2.7 NXP Semiconductors (NL)
        1. 5.2.7.1 Aperçu financier
        2. 5.2.7.2 Produits offerts
        3. 5.2.7.3 Développements clés
        4. 5.2.7.4 Analyse SWOT
        5. 5.2.7.5 Stratégies clés
      8. 5.2.8 Visteon Corporation (US)
        1. 5.2.8.1 Aperçu financier
        2. 5.2.8.2 Produits offerts
        3. 5.2.8.3 Développements clés
        4. 5.2.8.4 Analyse SWOT
        5. 5.2.8.5 Stratégies clés
      9. 5.2.9 LG Electronics (KR)
        1. 5.2.9.1 Aperçu financier
        2. 5.2.9.2 Produits offerts
        3. 5.2.9.3 Développements clés
        4. 5.2.9.4 Analyse SWOT
        5. 5.2.9.5 Stratégies clés
      10. 5.2.10 Alpine Electronics (JP)
        1. 5.2.10.1 Aperçu financier
        2. 5.2.10.2 Produits offerts
        3. 5.2.10.3 Développements clés
        4. 5.2.10.4 Analyse SWOT
        5. 5.2.10.5 Stratégies clés
    3. 5.3 Annexe
      1. 5.3.1 Références
      2. 5.3.2 Rapports connexes 6 LISTE DES FIGURES
    4. 6.1 SYNOPSIS DU MARCHÉ
    5. 6.2 ANALYSE DU MARCHÉ EN AMÉRIQUE DU NORD
    6. 6.3 ANALYSE DU MARCHÉ AUX ÉTATS-UNIS PAR SYSTÈME D'EXPLOITATION
    7. 6.4 ANALYSE DU MARCHÉ AU CANADA PAR SYSTÈME D'EXPLOITATION
    8. 6.5 ANALYSE DU MARCHÉ EN EUROPE
    9. 6.6 ANALYSE DU MARCHÉ EN ALLEMAGNE PAR SYSTÈME D'EXPLOITATION
    10. 6.7 ANALYSE DU MARCHÉ AU ROYAUME-UNI PAR SYSTÈME D'EXPLOITATION
    11. 6.8 ANALYSE DU MARCHÉ EN FRANCE PAR SYSTÈME D'EXPLOITATION
    12. 6.9 ANALYSE DU MARCHÉ EN RUSSIE PAR SYSTÈME D'EXPLOITATION
    13. 6.10 ANALYSE DU MARCHÉ EN ITALIE PAR SYSTÈME D'EXPLOITATION
    14. 6.11 ANALYSE DU MARCHÉ EN ESPAGNE PAR SYSTÈME D'EXPLOITATION
    15. 6.12 ANALYSE DU MARCHÉ DANS LE RESTE DE L'EUROPE PAR SYSTÈME D'EXPLOITATION
    16. 6.13 ANALYSE DU MARCHÉ EN APAC
    17. 6.14 ANALYSE DU MARCHÉ EN CHINE PAR SYSTÈME D'EXPLOITATION
    18. 6.15 ANALYSE DU MARCHÉ EN INDE PAR SYSTÈME D'EXPLOITATION
    19. 6.16 ANALYSE DU MARCHÉ AU JAPON PAR SYSTÈME D'EXPLOITATION
    20. 6.17 ANALYSE DU MARCHÉ EN CORÉE DU SUD PAR SYSTÈME D'EXPLOITATION
    21. 6.18 ANALYSE DU MARCHÉ EN MALAYSIE PAR SYSTÈME D'EXPLOITATION
    22. 6.19 ANALYSE DU MARCHÉ EN THAÏLANDE PAR SYSTÈME D'EXPLOITATION
    23. 6.20 ANALYSE DU MARCHÉ EN INDONÉSIE PAR SYSTÈME D'EXPLOITATION
    24. 6.21 ANALYSE DU MARCHÉ DANS LE RESTE DE L'APAC PAR SYSTÈME D'EXPLOITATION
    25. 6.22 ANALYSE DU MARCHÉ EN AMÉRIQUE DU SUD
    26. 6.23 ANALYSE DU MARCHÉ AU BRÉSIL PAR SYSTÈME D'EXPLOITATION
    27. 6.24 ANALYSE DU MARCHÉ AU MEXIQUE PAR SYSTÈME D'EXPLOITATION
    28. 6.25 ANALYSE DU MARCHÉ EN ARGENTINE PAR SYSTÈME D'EXPLOITATION
    29. 6.26 ANALYSE DU MARCHÉ DANS LE RESTE DE L'AMÉRIQUE DU SUD PAR SYSTÈME D'EXPLOITATION
    30. 6.27 ANALYSE DU MARCHÉ EN MEA
    31. 6.28 ANALYSE DU MARCHÉ DANS LES PAYS DU CCG PAR SYSTÈME D'EXPLOITATION
    32. 6.29 ANALYSE DU MARCHÉ EN AFRIQUE DU SUD PAR SYSTÈME D'EXPLOITATION
    33. 6.30 ANALYSE DU MARCHÉ DANS LE RESTE DE LA MEA PAR SYSTÈME D'EXPLOITATION
    34. 6.31 CRITÈRES D'ACHAT CLÉS DE L'AUTOMOBILE
    35. 6.32 PROCESSUS DE RECHERCHE DE MRFR
    36. 6.33 ANALYSE DRO DE L'AUTOMOBILE
    37. 6.34 ANALYSE D'IMPACT DES FACTEURS MOTRICES : AUTOMOBILE
    38. 6.35 ANALYSE D'IMPACT DES CONTRAINTES : AUTOMOBILE
    39. 6.36 CHAÎNE D'APPROVISIONNEMENT / VALEUR : AUTOMOBILE
    40. 6.37 AUTOMOBILE, PAR SYSTÈME D'EXPLOITATION, 2024 (% PART)
    41. 6.38 AUTOMOBILE, PAR SYSTÈME D'EXPLOITATION, 2024 À 2035 (milliards USD)
    42. 6.39 ÉVALUATION COMPARATIVE DES PRINCIPAUX CONCURRENTS 7 LISTE DES TABLEAUX
    43. 7.1 LISTE DES HYPOTHÈSES
    44. 7.2 ESTIMATIONS DE LA TAILLE DU MARCHÉ EN AMÉRIQUE DU NORD ; PRÉVISION
      1. 7.2.1 PAR SYSTÈME D'EXPLOITATION, 2025-2035 (milliards USD)
    45. 7.3 ESTIMATIONS DE LA TAILLE DU MARCHÉ AUX ÉTATS-UNIS ; PRÉVISION
      1. 7.3.1 PAR SYSTÈME D'EXPLOITATION, 2025-2035 (milliards USD)
    46. 7.4 ESTIMATIONS DE LA TAILLE DU MARCHÉ AU CANADA ; PRÉVISION
      1. 7.4.1 PAR SYSTÈME D'EXPLOITATION, 2025-2035 (milliards USD)
    47. 7.5 ESTIMATIONS DE LA TAILLE DU MARCHÉ EN EUROPE ; PRÉVISION
      1. 7.5.1 PAR SYSTÈME D'EXPLOITATION, 2025-2035 (milliards USD)
    48. 7.6 ESTIMATIONS DE LA TAILLE DU MARCHÉ EN ALLEMAGNE ; PRÉVISION
      1. 7.6.1 PAR SYSTÈME D'EXPLOITATION, 2025-2035 (milliards USD)
    49. 7.7 ESTIMATIONS DE LA TAILLE DU MARCHÉ AU ROYAUME-UNI ; PRÉVISION
      1. 7.7.1 PAR SYSTÈME D'EXPLOITATION, 2025-2035 (milliards USD)
    50. 7.8 ESTIMATIONS DE LA TAILLE DU MARCHÉ EN FRANCE ; PRÉVISION
      1. 7.8.1 PAR SYSTÈME D'EXPLOITATION, 2025-2035 (milliards USD)
    51. 7.9 ESTIMATIONS DE LA TAILLE DU MARCHÉ EN RUSSIE ; PRÉVISION
      1. 7.9.1 PAR SYSTÈME D'EXPLOITATION, 2025-2035 (milliards USD)
    52. 7.10 ESTIMATIONS DE LA TAILLE DU MARCHÉ EN ITALIE ; PRÉVISION
      1. 7.10.1 PAR SYSTÈME D'EXPLOITATION, 2025-2035 (milliards USD)
    53. 7.11 ESTIMATIONS DE LA TAILLE DU MARCHÉ EN ESPAGNE ; PRÉVISION
      1. 7.11.1 PAR SYSTÈME D'EXPLOITATION, 2025-2035 (milliards USD)
    54. 7.12 ESTIMATIONS DE LA TAILLE DU MARCHÉ DANS LE RESTE DE L'EUROPE ; PRÉVISION
      1. 7.12.1 PAR SYSTÈME D'EXPLOITATION, 2025-2035 (milliards USD)
    55. 7.13 ESTIMATIONS DE LA TAILLE DU MARCHÉ EN APAC ; PRÉVISION
      1. 7.13.1 PAR SYSTÈME D'EXPLOITATION, 2025-2035 (milliards USD)
    56. 7.14 ESTIMATIONS DE LA TAILLE DU MARCHÉ EN CHINE ; PRÉVISION
      1. 7.14.1 PAR SYSTÈME D'EXPLOITATION, 2025-2035 (milliards USD)
    57. 7.15 ESTIMATIONS DE LA TAILLE DU MARCHÉ EN INDE ; PRÉVISION
      1. 7.15.1 PAR SYSTÈME D'EXPLOITATION, 2025-2035 (milliards USD)
    58. 7.16 ESTIMATIONS DE LA TAILLE DU MARCHÉ AU JAPON ; PRÉVISION
      1. 7.16.1 PAR SYSTÈME D'EXPLOITATION, 2025-2035 (milliards USD)
    59. 7.17 ESTIMATIONS DE LA TAILLE DU MARCHÉ EN CORÉE DU SUD ; PRÉVISION
      1. 7.17.1 PAR SYSTÈME D'EXPLOITATION, 2025-2035 (milliards USD)
    60. 7.18 ESTIMATIONS DE LA TAILLE DU MARCHÉ EN MALAYSIE ; PRÉVISION
      1. 7.18.1 PAR SYSTÈME D'EXPLOITATION, 2025-2035 (milliards USD)
    61. 7.19 ESTIMATIONS DE LA TAILLE DU MARCHÉ EN THAÏLANDE ; PRÉVISION
      1. 7.19.1 PAR SYSTÈME D'EXPLOITATION, 2025-2035 (milliards USD)
    62. 7.20 ESTIMATIONS DE LA TAILLE DU MARCHÉ EN INDONÉSIE ; PRÉVISION
      1. 7.20.1 PAR SYSTÈME D'EXPLOITATION, 2025-2035 (milliards USD)
    63. 7.21 ESTIMATIONS DE LA TAILLE DU MARCHÉ DANS LE RESTE DE L'APAC ; PRÉVISION
      1. 7.21.1 PAR SYSTÈME D'EXPLOITATION, 2025-2035 (milliards USD)
    64. 7.22 ESTIMATIONS DE LA TAILLE DU MARCHÉ EN AMÉRIQUE DU SUD ; PRÉVISION
      1. 7.22.1 PAR SYSTÈME D'EXPLOITATION, 2025-2035 (milliards USD)
    65. 7.23 ESTIMATIONS DE LA TAILLE DU MARCHÉ AU BRÉSIL ; PRÉVISION
      1. 7.23.1 PAR SYSTÈME D'EXPLOITATION, 2025-2035 (milliards USD)
    66. 7.24 ESTIMATIONS DE LA TAILLE DU MARCHÉ AU MEXIQUE ; PRÉVISION
      1. 7.24.1 PAR SYSTÈME D'EXPLOITATION, 2025-2035 (milliards USD)
    67. 7.25 ESTIMATIONS DE LA TAILLE DU MARCHÉ EN ARGENTINE ; PRÉVISION
      1. 7.25.1 PAR SYSTÈME D'EXPLOITATION, 2025-2035 (milliards USD)
    68. 7.26 ESTIMATIONS DE LA TAILLE DU MARCHÉ DANS LE RESTE DE L'AMÉRIQUE DU SUD ; PRÉVISION
      1. 7.26.1 PAR SYSTÈME D'EXPLOITATION, 2025-2035 (milliards USD)
    69. 7.27 ESTIMATIONS DE LA TAILLE DU MARCHÉ EN MEA ; PRÉVISION
      1. 7.27.1 PAR SYSTÈME D'EXPLOITATION, 2025-2035 (milliards USD)
    70. 7.28 ESTIMATIONS DE LA TAILLE DU MARCHÉ DANS LES PAYS DU CCG ; PRÉVISION
      1. 7.28.1 PAR SYSTÈME D'EXPLOITATION, 2025-2035 (milliards USD)
    71. 7.29 ESTIMATIONS DE LA TAILLE DU MARCHÉ EN AFRIQUE DU SUD ; PRÉVISION
      1. 7.29.1 PAR SYSTÈME D'EXPLOITATION, 2025-2035 (milliards USD)
    72. 7.30 ESTIMATIONS DE LA TAILLE DU MARCHÉ DANS LE RESTE DE LA MEA ; PRÉVISION
      1. 7.30.1 PAR SYSTÈME D'EXPLOITATION, 2025-2035 (milliards USD)
    73. 7.31 LANCEMENT DE PRODUIT/DÉVELOPPEMENT DE PRODUIT/APPROBATION
    74. 7.32 ACQUISITION/PARTENARIAT

Segmentation du marché de l'infodivertissement automobile

Perspectives du système d'exploitation de l'infodivertissement automobile (milliards USD, 2018-2030)

QNX

Linux

Microsoft

Autres

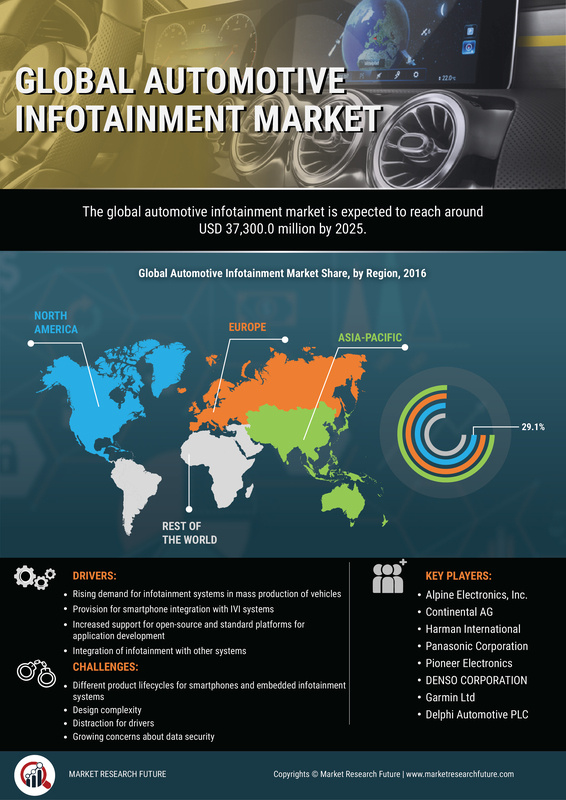
Perspectives régionales de l'infodivertissement automobile (milliards USD, 2018-2030)

Perspectives de l'Amérique du Nord (milliards USD, 2018-2030)

Infodivertissement automobile en Amérique du Nord par système d'exploitation

QNX

Linux

Microsoft

Autres

Perspectives des États-Unis (milliards USD, 2018-2030)

Infodivertissement automobile aux États-Unis par système d'exploitation

QNX

Linux

Microsoft

Autres

Perspectives du CANADA (milliards USD, 2018-2030)

Infodivertissement automobile au CANADA par système d'exploitation

QNX

Linux

Microsoft

Autres

Perspectives de l'Europe (milliards USD, 2018-2030)

Infodivertissement automobile en Europe par système d'exploitation

QNX

Linux

Microsoft

Autres

Perspectives de l'Allemagne (milliards USD, 2018-2030)

Infodivertissement automobile en Allemagne par système d'exploitation

QNX

Linux

Microsoft

Autres

Perspectives de la France (milliards USD, 2018-2030)

Infodivertissement automobile en France par système d'exploitation

QNX

Linux

Microsoft

Autres

Perspectives du Royaume-Uni (milliards USD, 2018-2030)

Infodivertissement automobile au Royaume-Uni par système d'exploitation

QNX

Linux

Microsoft

Autres

Perspectives de l'ITALIE (milliards USD, 2018-2030)

Infodivertissement automobile en ITALIE par système d'exploitation

QNX

Linux

Microsoft

Autres

Perspectives de l'ESPAGNE (milliards USD, 2018-2030)

Infodivertissement automobile en Espagne par système d'exploitation

QNX

Linux

Microsoft

Autres

Perspectives du reste de l'Europe (milliards USD, 2018-2030)

Infodivertissement automobile dans le reste de l'Europe par système d'exploitation

QNX

Linux

Microsoft

Autres

Perspectives de la région Asie-Pacifique (milliards USD, 2018-2030)

Infodivertissement automobile dans la région Asie-Pacifique par système d'exploitation

QNX

Linux

Microsoft

Autres

Perspectives de la Chine (milliards USD, 2018-2030)

Infodivertissement automobile en Chine par système d'exploitation

QNX

Linux

Microsoft

Autres

Perspectives du Japon (milliards USD, 2018-2030)

Infodivertissement automobile au Japon par système d'exploitation

QNX

Linux

Microsoft

Autres

Perspectives de l'Inde (milliards USD, 2018-2030)

Infodivertissement automobile en Inde par système d'exploitation

QNX

Linux

Microsoft

Autres

Perspectives de l'Australie (milliards USD, 2018-2030)

Infodivertissement automobile en Australie par système d'exploitation

QNX

Linux

Microsoft

Autres

Perspectives du reste de la région Asie-Pacifique (milliards USD, 2018-2030)

Infodivertissement automobile dans le reste de la région Asie-Pacifique par système d'exploitation

QNX

Linux

Microsoft

Autres

Perspectives du reste du monde (milliards USD, 2018-2030)

Infodivertissement automobile dans le reste du monde par système d'exploitation

QNX

Linux

Microsoft

Autres

Perspectives du Moyen-Orient (milliards USD, 2018-2030)

Infodivertissement automobile au Moyen-Orient par système d'exploitation

QNX

Linux

Microsoft

Autres

Perspectives de l'Afrique (milliards USD, 2018-2030)

Infodivertissement automobile en Afrique par système d'exploitation

QNX

Linux

Microsoft

Autres

Perspectives de l'Amérique latine (milliards USD, 2018-2030)

Infodivertissement automobile en Amérique latine par système d'exploitation

QNX

Linux

Microsoft

Autres

Compare Licence

×
Features License Type
Single User Multiuser License Enterprise User
Price $4,950 $5,950 $7,250
Maximum User Access Limit 1 User Upto 10 Users Unrestricted Access Throughout the Organization
Free Customization
Direct Access to Analyst
Deliverable Format
Platform Access
Discount on Next Purchase 10% 15% 15%
Printable Versions