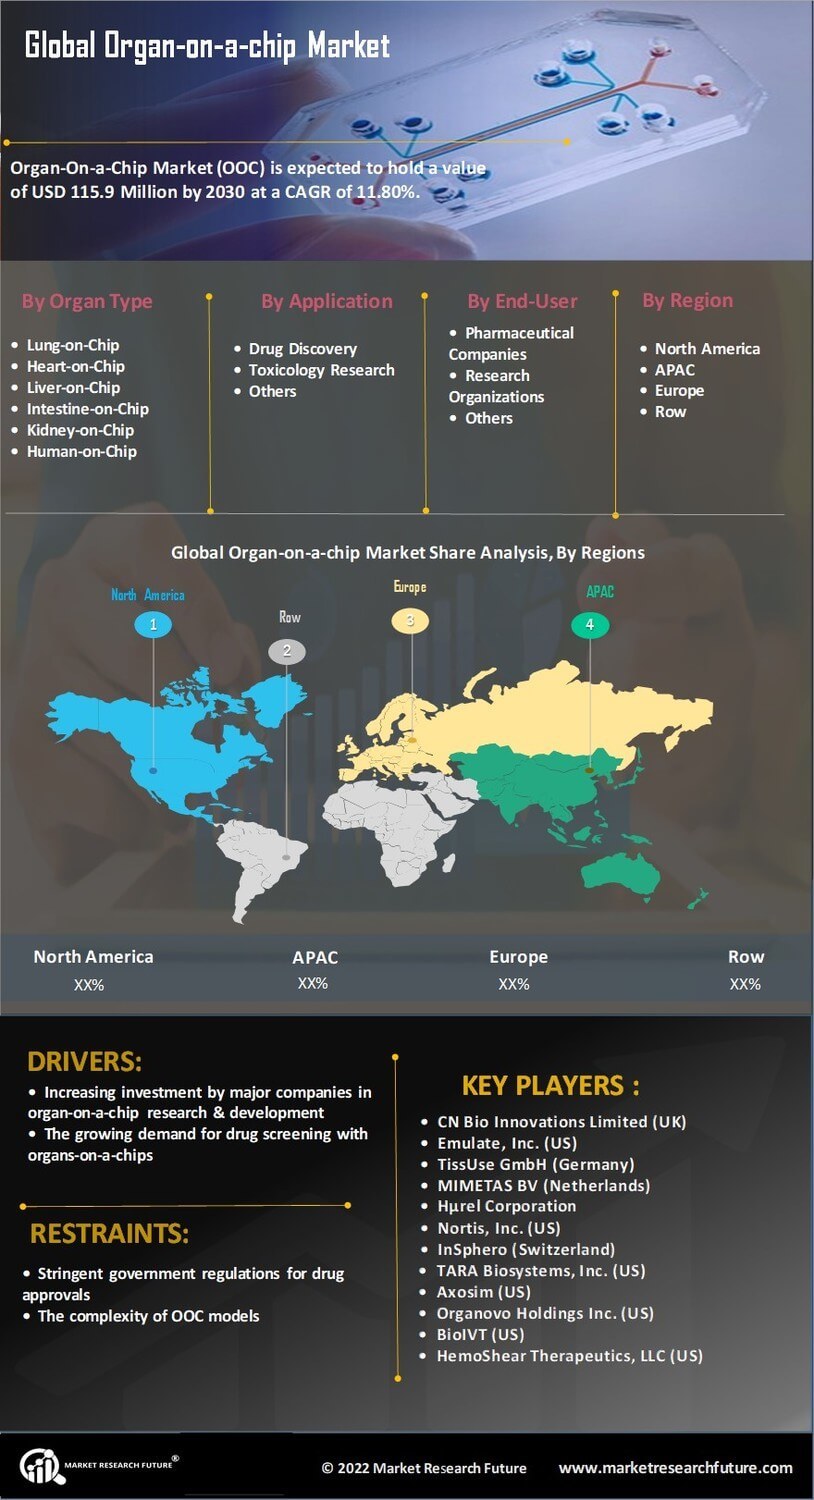
Organ on chip Market
Market Size
Key Players
- Technological Advancements
- Regulatory Support
- Collaborative Research Initiatives
- Rising Demand for Personalized Medicine
- 1 PRÓLOGO DEL INFORME
-
2 INTRODUCCIÓN AL MERCADO
- 2.1 Definición
-
2.2 Alcance del estudio
- 2.2.1 Objetivo de la investigación
- 2.2.2 Supuestos
- 2.2.3 Limitaciones
-
3 METODOLOGÍA DE LA INVESTIGACIÓN
- 3.1 Descripción general
- 3.2 Investigación primaria
- 3.3 Investigación secundaria
- 3.4 Estimación del tamaño del mercado
-
4 DINÁMICA DEL MERCADO
- 4.1 Descripción general
- 4.2 Factores impulsores
- 4.3 Limitaciones
- 4.4 Oportunidades
-
5 ANÁLISIS DE FACTORES DE MERCADO
-
5.1 Análisis de las cinco fuerzas de Porter
- 5.1.1 Poder de negociación de los proveedores
- 5.1.2 Poder de negociación de los compradores
- 5.1.3 Amenaza de nuevos competidores
- 5.1.4 Amenaza de sustitutos
- 5.1.5 Intensidad de la rivalidad
- 5.2 Análisis de la cadena de valor
- ?
-
5.1 Análisis de las cinco fuerzas de Porter
-
6 MERCADO GLOBAL DE ÓRGANOS EN CHIP, POR TIPO DE ÓRGANO
- 6.1 Resumen
- 6.2 Pulmón en chip
- Estimaciones y pronósticos del mercado, por región, 2020-2027
- Estimaciones y pronósticos del mercado, por país, 2020-2027
- 6.3 Corazón en chip
- Estimaciones y pronósticos del mercado, por región, 2020-2027
- Estimaciones y pronósticos del mercado, por país, 2020-2027
- 6.4 Hígado en chip
- Estimaciones y pronósticos del mercado por región, 2020-2027
- Estimaciones y pronósticos del mercado por país, 2020-2027
- 6.5 Intestino en chip
- Estimaciones y pronósticos del mercado por región, 2020-2027
- Estimaciones y pronósticos del mercado por país, 2020-2027
- 6.6 Riñón en chip
- Estimaciones y pronósticos del mercado por región, 2020-2027
- Estimaciones y pronósticos del mercado por país, 2020-2027
- 6.7 Piel en chip
- Estimaciones y pronósticos del mercado por región, 2020-2027
- Estimaciones y pronósticos del mercado Pronóstico por país, 2020-2027
- 6.8 Barrera hematoencefálica en chip
- Estimaciones y pronóstico del mercado por región, 2020-2027
- Estimaciones y pronóstico del mercado por país, 2020-2027
- 6.9 Humano en chip
- Estimaciones y pronóstico del mercado por región, 2020-2027
- Estimaciones y pronóstico del mercado por país, 2020-2027
- 6.10 Otros
- Estimaciones y pronóstico del mercado por región, 2020-2027
- Estimaciones y pronóstico del mercado por país, 2020-2027
-
7 MERCADO GLOBAL DE ÓRGANOS EN CHIP, POR APLICACIÓN
- 7.1 Resumen general
- 7.2 Descubrimiento de fármacos
- Estimaciones y pronósticos del mercado por región, 2020-2027
- Estimaciones y pronósticos del mercado por país, 2020-2027
- 7.3 Investigación toxicológica
- Estimaciones y pronósticos del mercado por región, 2020-2027
- Estimaciones y pronósticos del mercado por país, 2020-2027
- 7.4 Otros
- Estimaciones y pronósticos del mercado por región, 2020-2027
- Estimaciones y pronósticos del mercado por país, 2020-2027
-
8 MERCADO GLOBAL DE ÓRGANOS EN CHIP, POR USUARIO FINAL
- 8.1 Resumen
- 8.2 Compañías farmacéuticas
- Estimaciones y pronósticos del mercado Pronóstico por región, 2020-2027
- Estimaciones y pronóstico del mercado por país, 2020-2027
- 8.3 Organizaciones de investigación
- Estimaciones y pronóstico del mercado por región, 2020-2027
- Estimaciones y pronóstico del mercado por país, 2020-2027
- 8.4 Otros
- Estimaciones y pronóstico del mercado por región, 2020-2027
- Estimaciones y pronóstico del mercado por país, 2020-2027
-
9 MERCADO GLOBAL DE ÓRGANOS EN CHIP POR REGIÓN
- 9.1 Panorama general
-
9.2 América
-
9.2.1 Norteamérica
- 9.2.1.1 EE. UU.
- 9.2.1.2 Canadá
- 9.2.2 Latinoamérica
-
9.2.1 Norteamérica
-
9.3 Europa
-
9.3.1 Europa Occidental
- 9.3.1.1 Alemania
- 9.3.1.2 Francia
- 9.3.1.3 Italia
- 9.3.1.4 España
- 9.3.1.5 Reino Unido
- 9.3.1.6 Resto de Europa Occidental
- 9.3.2 Europa Oriental
-
9.3.1 Europa Occidental
-
9.4 Asia-Pacífico
- 9.4.1 Japón
- 9.4.2 China
- 9.4.3 India
- 9.4.4 Australia
- 9.4.5 Corea del Sur
- 9.4.6 Resto de Asia-Pacífico
-
9.5 Oriente Medio y África
- 9.5.1 Oriente Medio
- 9.5.2 África
-
10 PANORAMA DE LA EMPRESA
- 10.1 Resumen
- 10.2 Análisis competitivo
- 10.3 Análisis de la cuota de mercado
- 10.4 Principales estrategias de crecimiento en el mercado global de órganos en chip
- 10.5 Benchmarking competitivo
- 10.6 Principales actores en términos de número de desarrollos en el mercado global de órganos en chip
-
10.7 Desarrollos clave y estrategias de crecimiento
- 10.7.1 Lanzamiento de productos
- 10.7.2 Fusiones y adquisiciones
- 10.7.3 Empresas conjuntas
-
10.8 Matriz financiera y ratio de mercado de los principales actores
- 10.8.1 Ventas e ingresos operativos 2020
- 10.8.2 Gasto en I+D de los principales actores 2020
- 10.9 Ratio de mercado de capitales de los principales actores
-
11 PERFILES DE LA EMPRESA
-
11.1 CN Bio Innovations Limited
- 11.1.1 Descripción general de la empresa
- 11.1.2 Resumen financiero
- 11.1.3 Producto ofrecido
- 11.1.4 Desarrollos clave
- 11.1.5 Análisis FODA
- 11.1.6 Estrategias clave
-
11.2 Emulate
- 11.2.1 Descripción general de la empresa
- 11.2.2 Resumen financiero
- 11.2.3 Producto ofrecido
- 11.2.4 Desarrollos clave
- 11.2.5 Análisis FODA
- 11.2.6 Estrategias clave
-
11.3 TissUse
- 11.3.1 Descripción general de la empresa
- 11.3.2 Resumen financiero
- 11.3.3 Producto ofrecido
- 11.3.4 Desarrollos Clave
- 11.3.5 Análisis FODA
- 11.3.6 Estrategias Clave
-
11.4 Mimetas
- 11.4.1 Descripción General de la Empresa
- 11.4.2 Descripción Financiera
- 11.4.3 Producto Ofrecido
- 11.4.4 Desarrollos Clave
- 11.4.5 Análisis FODA
- 11.4.6 Estrategias Clave
-
11.5 Hµrel
- 11.5.1 Descripción General de la Empresa
- 11.5.2 Descripción Financiera
- 11.5.3 Producto Ofrecido
- 11.5.4 Desarrollos Clave
- 11.5.5 Análisis FODA
- 11.5.6 Estrategias Clave
-
11.6 Nortis
- 11.6.1 Descripción General de la Empresa
- 11.6.2 Panorama financiero
- 11.6.3 Producto ofrecido
- 11.6.4 Desarrollos clave
- 11.6.5 Análisis FODA
- 11.6.6 Estrategias clave
-
11.7 Insphero
- 11.7.1 Panorama de la empresa
- 11.7.2 Panorama financiero
- 11.7.3 Producto ofrecido
- 11.7.4 Desarrollos clave
- 11.7.5 Análisis FODA
- 11.7.6 Estrategias clave
-
11.8 Tara Biosystems
- 11.8.1 Panorama de la empresa
- 11.8.2 Panorama financiero
- 11.8.3 Producto ofrecido
- 11.8.4 Desarrollos clave
- 11.8.5 Análisis FODA
- 11.8.6 Estrategias clave
-
11.9 AxoSim Technologies LLC
- 11.9.1 Descripción general de la empresa
- 11.9.2 Descripción financiera
- 11.9.3 Producto ofrecido
- 11.9.4 Desarrollos clave
- 11.9.5 Análisis FODA
- 11.9.6 Estrategias clave
-
11.10 Organovo
- 11.10.1 Descripción general de la empresa
- 11.10.2 Descripción financiera
- 11.10.3 Producto ofrecido
- 11.10.4 Desarrollos clave
- 11.10.5 Análisis FODA
- 11.10.6 Estrategias clave
-
11.11 BioIVT
- 11.11.1 Descripción general de la empresa
- 11.11.2 Descripción financiera
- 11.11.3 Producto ofrecido
- 11.11.4 Desarrollos Clave
- 11.11.5 Análisis FODA
- 11.11.6 Estrategias Clave
-
11.12 HemoShear
- 11.12.1 Descripción General de la Empresa
- 11.12.2 Panorama Financiero
- 11.12.3 Producto Ofrecido
- 11.12.4 Desarrollos Clave
- 11.12.5 Análisis FODA
- 11.12.6 Estrategias Clave
-
11.1 CN Bio Innovations Limited
-
12 APÉNDICE
- 12.1 Referencias
- 12.2 Informes Relacionados
- LISTA DE TABLAS
- TABLA 1 SINOPSIS DEL MERCADO GLOBAL DE ÓRGANOS EN CHIP, 2020-2027
- TABLA 2 ESTIMACIONES Y ESTIMACIONES DEL MERCADO GLOBAL DE ÓRGANOS EN CHIP PRONÓSTICO, 2020-2027 (USD MILLONES)
- TABLA 3 MERCADO MUNDIAL DE ÓRGANOS EN CHIP, POR TIPO DE ÓRGANO, 2020-2027 (USD MILLONES)
- TABLA 4 MERCADO MUNDIAL DE ÓRGANOS EN CHIP, POR APLICACIÓN, 2020-2027 (USD MILLONES)
- TABLA 5 MERCADO MUNDIAL DE ÓRGANOS EN CHIP, POR USUARIO FINAL, 2020-2027 (USD MILLONES)
- TABLA 6 MERCADO MUNDIAL DE ÓRGANOS EN CHIP, POR REGIÓN, 2020-2027 (USD MILLONES)
- TABLA 7 AMÉRICA DEL NORTE: MERCADO DE ÓRGANOS EN CHIP, POR TIPO DE ÓRGANO, 2020-2027 (USD MILLONES)
- TABLA 8 AMÉRICA DEL NORTE: MERCADO DE ÓRGANOS EN CHIP, POR APLICACIÓN, 2020-2027 (MILLONES DE USD)
- TABLA 9 AMÉRICA DEL NORTE: MERCADO DE ÓRGANOS EN CHIP, POR USUARIO FINAL, 2020-2027 (MILLONES DE USD)
- TABLA 10 EE. UU.: MERCADO DE ÓRGANOS EN CHIP, POR TIPO DE ÓRGANO, 2020-2027 (MILLONES DE USD)
- TABLA 11 EE. UU.: MERCADO DE ÓRGANOS EN CHIP, POR APLICACIÓN, 2020-2027 (MILLONES DE USD)
- TABLA 12 EE. UU.: MERCADO DE ÓRGANOS EN CHIP, POR USUARIO FINAL, 2020-2027 (MILLONES DE USD)
- TABLA 13 CANADÁ: MERCADO DE ÓRGANOS EN CHIP, POR TIPO DE ÓRGANO, 2020-2027 (USD MILLONES)
- TABLA 14 CANADÁ: MERCADO DE ÓRGANOS EN CHIP, POR APLICACIÓN, 2020-2027 (USD MILLONES)
- TABLA 15 CANADÁ: MERCADO DE ÓRGANOS EN CHIP, POR USUARIO FINAL, 2020-2027 (USD MILLONES)
- TABLA 16 AMÉRICA LATINA: MERCADO DE ÓRGANOS EN CHIP, POR TIPO DE ÓRGANO, 2020-2027 (USD MILLONES)
- TABLA 17 AMÉRICA LATINA: MERCADO DE ÓRGANOS EN CHIP, POR APLICACIÓN, 2020-2027 (USD MILLONES)
- TABLA 18 AMÉRICA LATINA: MERCADO DE ÓRGANOS EN CHIP, POR USUARIO FINAL, 2020-2027 (USD MILLONES)
- TABLA 19 EUROPA: MERCADO DE ÓRGANOS EN CHIP, POR TIPO DE ÓRGANO, 2020-2027 (MILLONES DE USD)
- TABLA 20 EUROPA: MERCADO DE ÓRGANOS EN CHIP, POR APLICACIÓN, 2020-2027 (MILLONES DE USD)
- TABLA 21 EUROPA: MERCADO DE ÓRGANOS EN CHIP, POR USUARIO FINAL, 2020-2027 (MILLONES DE USD)
- TABLA 22 EUROPA OCCIDENTAL: MERCADO DE ÓRGANOS EN CHIP, POR TIPO DE ÓRGANO, 2020-2027 (MILLONES DE USD)
- TABLA 23 EUROPA OCCIDENTAL: MERCADO DE ÓRGANOS EN CHIP, POR APLICACIÓN, 2020-2027 (MILLONES DE USD)
- TABLA 24 EUROPA OCCIDENTAL: MERCADO DE ÓRGANOS EN CHIP, POR USUARIO FINAL, 2020-2027 (MILLONES DE USD)
- TABLA 25 EUROPA ORIENTAL: MERCADO DE ÓRGANOS EN CHIP, POR TIPO DE ÓRGANO, 2020-2027 (MILLONES DE USD)
- TABLA 26 EUROPA ORIENTAL: MERCADO DE ÓRGANOS EN CHIP, POR APLICACIÓN, 2020-2027 (MILLONES DE USD)
- TABLA 27 EUROPA ORIENTAL: MERCADO DE ÓRGANOS EN CHIP, POR USUARIO FINAL, 2020-2027 (MILLONES DE USD)
- TABLA 28 ASIA-PACÍFICO: MERCADO DE ÓRGANOS EN CHIP, POR TIPO DE ÓRGANO, 2020-2027 (MILLONES DE USD)
- TABLA 29 ASIA-PACÍFICO: MERCADO DE ÓRGANOS EN CHIP, POR APLICACIÓN, 2020-2027 (USD MILLONES)
- TABLA 30 ASIA-PACÍFICO: MERCADO DE ÓRGANOS EN CHIP, POR USUARIO FINAL, 2020-2027 (USD MILLONES)
- TABLA 31 ORIENTE MEDIO Y ÁFRICA: MERCADO DE ÓRGANOS EN CHIP, POR TIPO DE ÓRGANO, 2020-2027 (USD MILLONES)
- TABLA 32 ORIENTE MEDIO Y ÁFRICA: MERCADO DE ÓRGANOS EN CHIP, POR APLICACIÓN, 2020-2027 (USD MILLONES)
- TABLA 33 ORIENTE MEDIO Y ÁFRICA: MERCADO DE ÓRGANOS EN CHIP, POR USUARIO FINAL, 2020-2027 (MILLONES DE USD)
- ?
- LISTA DE FIGURAS
- FIGURA 1 PROCESO DE INVESTIGACIÓN
- FIGURA 2 ESTRUCTURA DEL MERCADO GLOBAL DE ÓRGANOS EN CHIP
- FIGURA 3 DINÁMICA DEL MERCADO GLOBAL DE ÓRGANOS EN CHIP
- FIGURA 4 CUOTA DE MERCADO GLOBAL DE ÓRGANOS EN CHIP, POR TIPO DE ÓRGANO, 2020 (%)
- FIGURA 5 CUOTA DE MERCADO GLOBAL DE ÓRGANOS EN CHIP, POR APLICACIÓN, 2020 (%)
- FIGURA 6 CUOTA DE MERCADO GLOBAL DE ÓRGANOS EN CHIP POR USUARIO FINAL, 2020 (%)
- FIGURA 6 CUOTA DE MERCADO MUNDIAL DE ÓRGANOS EN CHIP, POR REGIÓN, 2020 (%)
- FIGURA 7 AMÉRICA: CUOTA DE MERCADO DE ÓRGANOS EN CHIP POR REGIÓN, 2020 (%)
- FIGURA 7 AMÉRICA DEL NORTE: CUOTA DE MERCADO DE ÓRGANOS EN CHIP, POR PAÍS, 2020 (%)
- FIGURA 8 EUROPA: CUOTA DE MERCADO DE ÓRGANOS EN CHIP, POR REGIÓN, 2020 (%)
- FIGURA 9 EUROPA OCCIDENTAL: CUOTA DE MERCADO DE ÓRGANOS EN CHIP, POR PAÍS, 2020 (%)
- FIGURA 10 ASIA-PACÍFICO: CUOTA DE MERCADO DE ÓRGANOS EN CHIP, POR PAÍS, 2020 (%)
- FIGURA 11 ORIENTE MEDIO Y ÁFRICA: CUOTA DE MERCADO DE ÓRGANOS EN CHIP, POR PAÍS, 2020 (%)
- FIGURA 12 MERCADO GLOBAL DE ÓRGANOS EN CHIP: ANÁLISIS DE LA CUOTA DE LAS EMPRESAS, 2020 (%)
- FIGURA 13 CN BIO INNOVATIONS LIMITED: INFORMACIÓN FINANCIERA CLAVE
- FIGURA 14 CN BIO INNOVATIONS LIMITED: INGRESOS POR SEGMENTO
- FIGURA 15 CN BIO INNOVATIONS LIMITED: INGRESOS REGIONALES
- FIGURA 16 EMULATE: INFORMACIÓN FINANCIERA CLAVE
- FIGURA 17 EMULATE: INGRESOS POR SEGMENTO
- FIGURA 18 EMULATE: INGRESOS REGIONALES
- FIGURA 19 TISSUSE: INFORMACIÓN FINANCIERA CLAVE
- FIGURA 20 TISSUSE: INGRESOS SEGMENTALES
- FIGURA 21 TISSUSE: INGRESOS REGIONALES
- FIGURA 22 MIMETAS: INFORMACIÓN FINANCIERA CLAVE
- FIGURA 23 MIMETAS: INGRESOS SEGMENTALES
- FIGURA 24 MIMETAS: INGRESOS REGIONALES
- FIGURA 25 HµREL: INFORMACIÓN FINANCIERA CLAVE
- FIGURA 26 HµREL: INGRESOS SEGMENTALES
- FIGURA 27 HµREL: INGRESOS REGIONALES
- FIGURA 28 NORTIS: INFORMACIÓN FINANCIERA CLAVE
- FIGURA 29 NORTIS: INGRESOS SEGMENTALES
- FIGURA 30 NORTIS: INGRESOS REGIONALES
- FIGURA 31 TARA BIOSYSTEMS: INFORMACIÓN FINANCIERA CLAVE
- FIGURA 32 TARA BIOSYSTEMS: INGRESOS POR SEGMENTO
- FIGURA 33 TARA BIOSYSTEMS: INGRESOS REGIONALES
- FIGURA 34 INSPHERO: INFORMACIÓN FINANCIERA CLAVE
- FIGURA 35 INSPHERO: INGRESOS POR SEGMENTO
- FIGURA 36 INSPHERO: INGRESOS REGIONALES
- FIGURA 37 AXOSIM TECHNOLOGIES LLC: INFORMACIÓN FINANCIERA CLAVE
- FIGURA 38 AXOSIM TECHNOLOGIES LLC: INGRESOS POR SEGMENTO
- FIGURA 39 AXOSIM TECHNOLOGIES LLC: INGRESOS REGIONALES
- FIGURA 40 ASCENDANCE: INFORMACIÓN FINANCIERA CLAVE
- FIGURA 41 ASCENDANCE: INGRESOS POR SEGMENTO
- FIGURA 42 ASCENDANCE: INGRESOS REGIONALES
- FIGURA 43 HEMOSHEAR: INFORMACIÓN FINANCIERA CLAVE
- FIGURA 44 HEMOSHEAR: INGRESOS POR SEGMENTO
- FIGURA 45 HEMOSHEAR: INGRESOS REGIONALES
Customer Stories

“This is really good guys. Excellent work on a tight deadline. I will continue to use you going forward and recommend you to others. Nice job”

“Thanks. It’s been a pleasure working with you, please use me as reference with any other Intel employees.”

“Thanks for sending the report it gives us a good global view of the Betaïne market.”

“Thank you, this will be very helpful for OQS.”

“We found the report very insightful! we found your research firm very helpful. I'm sending this email to secure our future business.”

“I am very pleased with how market segments have been defined in a relevant way for my purposes (such as "Portable Freezers & refrigerators" and "last-mile"). In general the report is well structured. Thanks very much for your efforts.”

“I have been reading the first document or the study, ,the Global HVAC and FP market report 2021 till 2026. Must say, good info! I have not gone in depth at all parts, but got a good indication of the data inside!”

“We got the report in time, we really thank you for your support in this process. I also thank to all of your team as they did a great job.”