
Mobile Application Testing Services Market
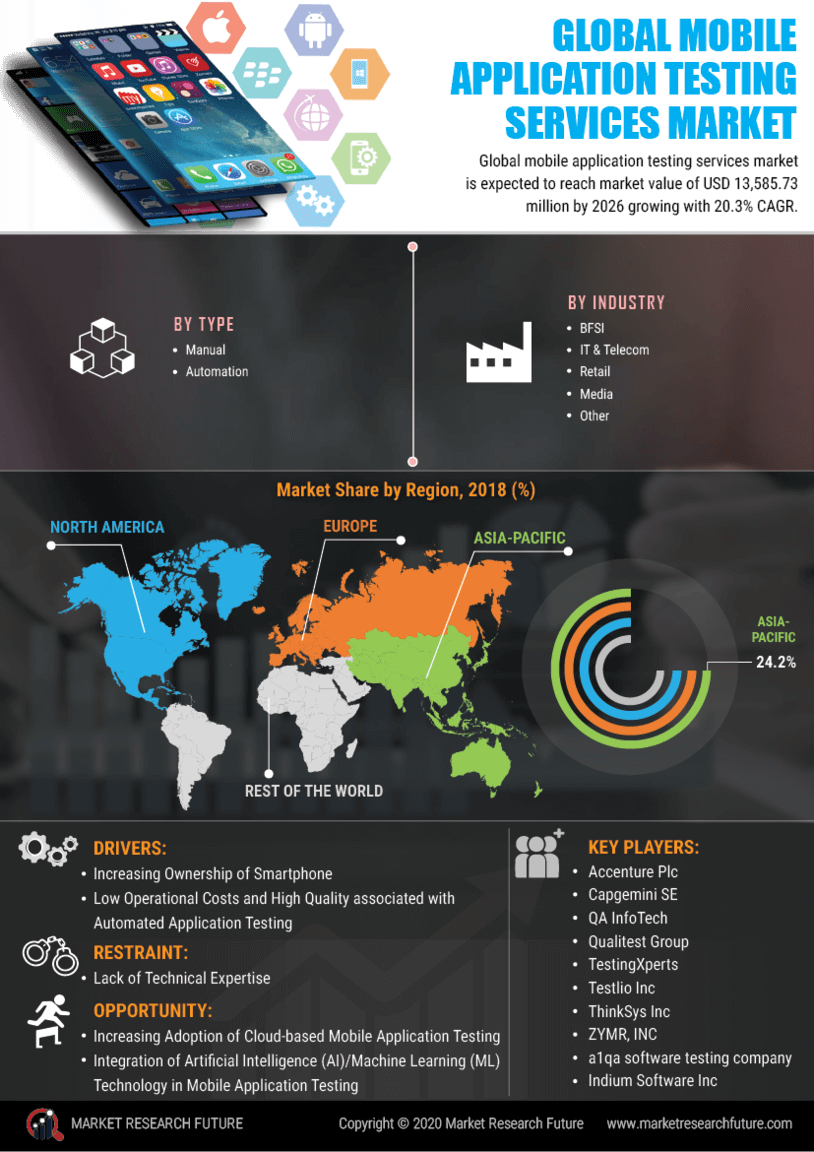
Informe de investigación de mercado de servicios de prueba de aplicaciones móviles: información por tipo (manual y automatización), por industria (BFSI, TI y telecomunicaciones, comercio minorista, medios y otros) y por región (Norteamérica, Asia-Pacífico, Europa y resto del mundo): pronóstico hasta 2032

-
1 Resumen ejecutivo
-
1.1 Análisis del atractivo del mercado
- 1.1.1 Mercado global de servicios de prueba de aplicaciones móviles, por tipo
- 1.1.2 Mercado global de servicios de prueba de aplicaciones móviles, por industria
- 1.2 Mercado global de servicios de prueba de aplicaciones móviles, por región
-
1.1 Análisis del atractivo del mercado
-
2 Introducción al mercado
- 2.1 Definición
- 2.2 Alcance del estudio
- 2.3 Estructura del mercado
-
3 Metodología de investigación
- 3.1 Proceso de investigación
- 3.2 Investigación primaria
- 3.3 Investigación secundaria
- 3.4 Estimación del tamaño del mercado
- 3.5 Pronóstico vertical
- 3.6 Lista de supuestos
- 4 Perspectivas del mercado
-
5 Dinámica del mercado
- 5.1 Introducción
-
5.2 Factores impulsores
- 5.2.1 Aumento de la propiedad de teléfonos inteligentes
- 5.2.2 Bajos costos operativos y alta calidad asociados con las pruebas automatizadas de aplicaciones
- 5.2.3 Análisis del impacto de los factores
-
5.3 Limitaciones
- 5.3.1 Falta de experiencia técnica
- 5.3.2 Análisis del impacto de las limitaciones
-
5.4 Oportunidad
- 5.4.1 Creciente adopción de pruebas de aplicaciones móviles en la nube
-
6 Análisis de factores de mercado
-
6.1 Modelo de las cinco fuerzas de Porter
- 6.1.1 Amenaza de nuevos participantes
- 6.1.2 Poder de negociación de los proveedores
- 6.1.3 Poder de negociación de los compradores
- 6.1.4 Amenaza de sustitutos
- 6.1.5 Intensidad de la rivalidad
-
6.1 Modelo de las cinco fuerzas de Porter
-
7 Mercado global de servicios de prueba de aplicaciones móviles, por tipo
- 7.1 Descripción general
- 7.2 Manual
- 7.3 Automatización
-
8 Mercado global de servicios de prueba de aplicaciones móviles, por industria
- 8.1 Descripción general
- 8.2 BFSI
- 8.3 TI y Telecomunicaciones
- 8.4 Minorista
- 8.5 Medios
- 8.6 Otros
-
9 Mercado global de servicios de prueba de aplicaciones móviles, por región
- 9.1 Descripción general
-
9.2 Norteamérica
- 9.2.1 EE. UU.
- 9.2.2 Canadá
- 9.2.3 México
-
9.3 Europa
- 9.3.1 Reino Unido
- 9.3.2 Alemania
- 9.3.3 Francia
- 9.3.4 Resto de Europa
-
9.4 Asia Pacífico
- 9.4.1 China
- 9.4.2 Japón
- 9.4.3 India
- 9.4.4 Resto de Asia Pacífico
-
9.5 Resto del mundo
- 9.5.1 Sur América
-
10 Panorama competitivo
- 10.1 Análisis de la cuota de mercado de los actores clave, 2020 (%)
-
11 Perfiles de empresas
-
11.1 Testlio Inc
- 11.1.1 Descripción general de la empresa
- 11.1.2 Productos, servicios y soluciones ofrecidos
- 11.1.3 Desarrollos clave
- 11.1.4 Análisis FODA
- 11.1.5 Estrategias clave
-
11.2 QA InfoTech
- 11.2.1 Descripción general de la empresa
- 11.2.2 Productos, servicios y soluciones ofrecidos
- 11.2.3 Desarrollos clave
- 11.2.4 Análisis FODA
- 11.2.5 Estrategias clave
-
11.3 Capgemini
- 11.3.1 Descripción general de la empresa
- 11.3.2 Descripción financiera
- 11.3.3 Productos/servicios/soluciones ofrecidos
- 11.3.4 Desarrollos clave
- 11.3.5 Análisis FODA
- 11.3.6 Estrategias clave
-
11.4 ThinkSys Inc
- 11.4.1 Descripción general de la empresa
- 11.4.2 Productos/servicios/soluciones ofrecidos
- 11.4.3 Desarrollos clave
- 11.4.4 Análisis FODA
- 11.4.5 Estrategias clave
-
11.5 Qualitest
- 11.5.1 Descripción general de la empresa
- 11.5.2 Productos/servicios/soluciones ofrecidos
- 11.5.3 Desarrollos clave Desarrollos
- 11.5.4 Análisis FODA
- 11.5.5 Estrategias clave
-
11.6 TestingXperts
- 11.6.1 Descripción general de la empresa
- 11.6.2 Productos/servicios/soluciones ofrecidos
- 11.6.3 Desarrollos clave
- 11.6.4 Análisis FODA
- 11.6.5 Estrategias clave
-
11.7 ZYMR, INC
- 11.7.1 Descripción general de la empresa
- 11.7.2 Productos/servicios/soluciones ofrecidos
- 11.7.3 Desarrollos clave
- 11.7.4 Análisis FODA
- 11.7.5 Estrategias clave
-
11.8 A1qa Software Testing Company
- 11.8.1 Empresa Descripción general
- 11.8.2 Productos/Servicios/Soluciones ofrecidos
- 11.8.3 Desarrollos clave
- 11.8.4 Análisis FODA
- 11.8.5 Estrategias clave
-
11.9 Indium Software Inc
- 11.9.1 Descripción general de la empresa
- 11.9.2 Productos/Servicios/Soluciones ofrecidos
- 11.9.3 Desarrollos clave
- 11.9.4 Análisis FODA
- 11.9.5 Estrategias clave
-
11.10 Pruebas globales de aplicaciones
- 11.10.1 Descripción general de la empresa
- 11.10.2 Productos/Servicios/Soluciones ofrecidos
- 11.10.3 Desarrollos clave
- 11.10.4 Análisis FODA Análisis
- 11.10.5 Estrategias clave
-
11.11 Accenture Plc
- 11.11.1 Descripción general de la empresa
- 11.11.2 Descripción general financiera
- 11.11.3 Productos/servicios/soluciones ofrecidos
- 11.11.4 Desarrollos clave
- 11.11.5 Análisis FODA
- 11.11.6 Estrategias clave
-
11.1 Testlio Inc
-
12 Apéndice
- 12.1 Referencias
-
13 Lista de tablas
- TABLA 1 LISTA DE SUPUESTOS
- TABLA 2 MERCADO GLOBAL DE SERVICIOS DE PRUEBAS DE APLICACIONES MÓVILES, POR TIPO, 2020-2027 (MILLONES DE USD)
- TABLA 3 MERCADO GLOBAL DE SERVICIOS DE PRUEBAS DE APLICACIONES MÓVILES, POR TIPO, 2020-2027 (USD MILLONES)
- TABLA 4 MERCADO GLOBAL DE SERVICIOS DE PRUEBAS DE APLICACIONES MÓVILES, POR INDUSTRIA, 2020-2027 (USD MILLONES)
- TABLA 5 MERCADO GLOBAL DE SERVICIOS DE PRUEBAS DE APLICACIONES MÓVILES, POR INDUSTRIA, 2020-2027 (USD MILLONES)
- TABLA 6 MERCADO GLOBAL DE SERVICIOS DE PRUEBAS DE APLICACIONES MÓVILES, POR REGIÓN, 2020-2027 (USD MILLONES)
- TABLA 7 MERCADO GLOBAL DE SERVICIOS DE PRUEBAS DE APLICACIONES MÓVILES, POR REGIÓN, 2020-2027 (USD MILLONES)
- TABLA 8 AMÉRICA DEL NORTE: MERCADO DE SERVICIOS DE PRUEBAS DE APLICACIONES MÓVILES, POR PAÍS, 2020–2027 (USD MILLONES)
- TABLA 9 AMÉRICA DEL NORTE: MERCADO DE SERVICIOS DE PRUEBAS DE APLICACIONES MÓVILES, POR PAÍS, 2020–2027 (USD MILLONES)
- TABLA 10 AMÉRICA DEL NORTE: MERCADO DE SERVICIOS DE PRUEBAS DE APLICACIONES MÓVILES, POR INDUSTRIA, 2020–2027 (USD MILLONES)
- TABLA 11 AMÉRICA DEL NORTE: MERCADO DE SERVICIOS DE PRUEBAS DE APLICACIONES MÓVILES, POR INDUSTRIA, 2020–2027 (USD MILLONES)
- TABLA 12 AMÉRICA DEL NORTE: MERCADO DE SERVICIOS DE PRUEBAS DE APLICACIONES MÓVILES, POR INDUSTRIA, 2020–2027 (USD MILLONES)
- TABLA 13 AMÉRICA DEL NORTE: APLICACIONES MÓVILES MERCADO DE SERVICIOS DE PRUEBAS, POR INDUSTRIA, 2020-2027 (MILLONES DE USD)
- TABLA 14 EE. UU.: MERCADO DE SERVICIOS DE PRUEBAS DE APLICACIONES MÓVILES, POR TIPO, 2020-2027 (MILLONES DE USD)
- TABLA 15 EE. UU.: MERCADO DE SERVICIOS DE PRUEBAS DE APLICACIONES MÓVILES, POR TIPO, 2020-2027 (MILLONES DE USD)
- TABLA 16 EE. UU.: MERCADO DE SERVICIOS DE PRUEBAS DE APLICACIONES MÓVILES, POR INDUSTRIA, 2020-2027 (MILLONES DE USD)
- TABLA 17 EE. UU.: MERCADO DE SERVICIOS DE PRUEBAS DE APLICACIONES MÓVILES, POR INDUSTRIA, 2020-2027 (MILLONES DE USD)
- TABLA 18 CANADÁ: MERCADO DE SERVICIOS DE PRUEBAS DE APLICACIONES MÓVILES, POR TIPO, 2020–2027 (USD MILLONES)
- TABLA 19 CANADÁ: MERCADO DE SERVICIOS DE PRUEBAS DE APLICACIONES MÓVILES, POR TIPO, 2020–2027 (USD MILLONES)
- TABLA 20 CANADÁ: MERCADO DE SERVICIOS DE PRUEBAS DE APLICACIONES MÓVILES, POR INDUSTRIA, 2020–2027 (USD MILLONES)
- TABLA 21 CANADÁ: MERCADO DE SERVICIOS DE PRUEBAS DE APLICACIONES MÓVILES, POR INDUSTRIA, 2020–2027 (USD MILLONES)
- TABLA 22 MÉXICO: MERCADO DE SERVICIOS DE PRUEBAS DE APLICACIONES MÓVILES, POR TIPO, 2020–2027 (USD MILLONES)
- TABLA 23 MÉXICO: MERCADO DE SERVICIOS DE PRUEBAS DE APLICACIONES MÓVILES, POR TIPO, 2020–2027 (USD MILLONES)
- TABLA 24 MÉXICO: MERCADO DE SERVICIOS DE PRUEBAS DE APLICACIONES MÓVILES, POR INDUSTRIA, 2020-2027 (USD MILLONES)
- TABLA 25 MÉXICO: MERCADO DE SERVICIOS DE PRUEBAS DE APLICACIONES MÓVILES, POR INDUSTRIA, 2020-2027 (USD MILLONES)
- TABLA 26 EUROPA: MERCADO DE SERVICIOS DE PRUEBAS DE APLICACIONES MÓVILES, POR PAÍS, 2020-2027 (USD MILLONES)
- TABLA 27 EUROPA: MERCADO DE SERVICIOS DE PRUEBAS DE APLICACIONES MÓVILES, POR PAÍS, 2020-2027 (USD MILLONES)
- TABLA 28 EUROPA: MERCADO DE SERVICIOS DE PRUEBAS DE APLICACIONES MÓVILES, POR TIPO, 2020-2027 (USD MILLONES)
- TABLA 29 EUROPA: MERCADO DE SERVICIOS DE PRUEBAS DE APLICACIONES MÓVILES, POR TIPO, 2020-2027 (MILLONES DE USD)
- TABLA 30 EUROPA: MERCADO DE SERVICIOS DE PRUEBAS DE APLICACIONES MÓVILES, POR INDUSTRIA, 2020-2027 (MILLONES DE USD)
- TABLA 31 EUROPA: MERCADO DE SERVICIOS DE PRUEBAS DE APLICACIONES MÓVILES, POR INDUSTRIA, 2020-2027 (MILLONES DE USD)
- TABLA 32 REINO UNIDO: MERCADO DE SERVICIOS DE PRUEBAS DE APLICACIONES MÓVILES, POR TIPO, 2020-2027 (MILLONES DE USD)
- TABLA 33 REINO UNIDO: MERCADO DE SERVICIOS DE PRUEBAS DE APLICACIONES MÓVILES, POR TIPO, 2020-2027 (MILLONES DE USD) MILLONES)
- TABLA 34 REINO UNIDO: MERCADO DE SERVICIOS DE PRUEBAS DE APLICACIONES MÓVILES, POR INDUSTRIA, 2020-2027 (MILLONES DE USD)
- TABLA 35 REINO UNIDO: MERCADO DE SERVICIOS DE PRUEBAS DE APLICACIONES MÓVILES, POR INDUSTRIA, 2020-2027 (MILLONES DE USD)
- TABLA 36 ALEMANIA: MERCADO DE SERVICIOS DE PRUEBAS DE APLICACIONES MÓVILES, POR TIPO, 2020-2027 (MILLONES DE USD)
- TABLA 37 ALEMANIA: MERCADO DE SERVICIOS DE PRUEBAS DE APLICACIONES MÓVILES, POR TIPO, 2020-2027 (MILLONES DE USD)
- TABLA 38 ALEMANIA: MERCADO DE SERVICIOS DE PRUEBAS DE APLICACIONES MÓVILES, POR INDUSTRIA, 2020-2027 (MILLONES DE USD) MILLONES)
- TABLA 39 ALEMANIA: MERCADO DE SERVICIOS DE PRUEBAS DE APLICACIONES MÓVILES, POR INDUSTRIA, 2020-2027 (MILLONES DE USD)
- TABLA 40 FRANCIA: MERCADO DE SERVICIOS DE PRUEBAS DE APLICACIONES MÓVILES, POR TIPO, 2020-2027 (MILLONES DE USD)
- TABLA 41 FRANCIA: MERCADO DE SERVICIOS DE PRUEBAS DE APLICACIONES MÓVILES, POR TIPO, 2020-2027 (MILLONES DE USD)
- TABLA 42 FRANCIA: MERCADO DE SERVICIOS DE PRUEBAS DE APLICACIONES MÓVILES, POR INDUSTRIA, 2020-2027 (MILLONES DE USD)
- TABLA 43 FRANCIA: MERCADO DE SERVICIOS DE PRUEBAS DE APLICACIONES MÓVILES, POR INDUSTRIA, 2012-2027 (MILLONES DE USD) MILLONES)
- TABLA 44 RESTO DE EUROPA: MERCADO DE SERVICIOS DE PRUEBAS DE APLICACIONES MÓVILES, POR TIPO, 2020-2027 (MILLONES DE USD)
- TABLA 45 RESTO DE EUROPA: MERCADO DE SERVICIOS DE PRUEBAS DE APLICACIONES MÓVILES, POR TIPO, 2020-2027 (MILLONES DE USD)
- TABLA 46 RESTO DE EUROPA: MERCADO DE SERVICIOS DE PRUEBAS DE APLICACIONES MÓVILES, POR INDUSTRIA, 2020-2027 (MILLONES DE USD)
- TABLA 47 RESTO DE EUROPA: MERCADO DE SERVICIOS DE PRUEBAS DE APLICACIONES MÓVILES, POR INDUSTRIA, 2020-2027 (MILLONES DE USD)
- TABLA 48 ASIA PACÍFICO: MERCADO DE SERVICIOS DE PRUEBAS DE APLICACIONES MÓVILES, POR PAÍS, 2020–2027 (USD MILLONES)
- TABLA 49 ASIA PACÍFICO: MERCADO DE SERVICIOS DE PRUEBAS DE APLICACIONES MÓVILES, POR PAÍS, 2020–2027 (USD MILLONES)
- TABLA 50 ASIA-PACÍFICO: MERCADO DE SERVICIOS DE PRUEBAS DE APLICACIONES MÓVILES, POR TIPO, 2020–2027 (USD MILLONES)
- TABLA 51 ASIA-PACÍFICO: MERCADO DE SERVICIOS DE PRUEBAS DE APLICACIONES MÓVILES, POR TIPO, 2020–2027 (USD MILLONES)
- TABLA 52 ASIA-PACÍFICO: MERCADO DE SERVICIOS DE PRUEBAS DE APLICACIONES MÓVILES, POR INDUSTRIA, 2020–2027 (USD MILLONES)
- TABLA 53 ASIA-PACÍFICO: MERCADO DE SERVICIOS DE PRUEBAS DE APLICACIONES MÓVILES, POR INDUSTRIA, 2020-2027 (USD MILLONES)
- TABLA 54 CHINA: MERCADO DE SERVICIOS DE PRUEBAS DE APLICACIONES MÓVILES, POR TIPO, 2020-2027 (USD MILLONES)
- TABLA 55 CHINA: MERCADO DE SERVICIOS DE PRUEBAS DE APLICACIONES MÓVILES, POR TIPO, 2020-2027 (USD MILLONES)
- TABLA 56 CHINA: MERCADO DE SERVICIOS DE PRUEBAS DE APLICACIONES MÓVILES, POR INDUSTRIA, 2020-2027 (USD MILLONES)
- TABLA 57 CHINA: MERCADO DE SERVICIOS DE PRUEBAS DE APLICACIONES MÓVILES, POR INDUSTRIA, 2020-2027 (USD MILLONES)
- TABLA 58 JAPÓN: MERCADO DE SERVICIOS DE PRUEBAS DE APLICACIONES MÓVILES, POR TIPO, 2020–2027 (USD MILLONES)
- TABLA 59 JAPÓN: MERCADO DE SERVICIOS DE PRUEBAS DE APLICACIONES MÓVILES, POR TIPO, 2020–2027 (USD MILLONES)
- TABLA 60 JAPÓN: MERCADO DE SERVICIOS DE PRUEBAS DE APLICACIONES MÓVILES, POR INDUSTRIA, 2020–2027 (USD MILLONES)
- TABLA 61 JAPÓN: MERCADO DE SERVICIOS DE PRUEBAS DE APLICACIONES MÓVILES, POR INDUSTRIA, 2020–2027 (USD MILLONES)
- TABLA 62 INDIA: MERCADO DE SERVICIOS DE PRUEBAS DE APLICACIONES MÓVILES, POR TIPO, 2020–2027 (USD MILLONES)
- TABLA 63 INDIA: MERCADO DE SERVICIOS DE PRUEBAS DE APLICACIONES MÓVILES, POR TIPO, 2020–2027 (USD MILLONES)
- TABLA 64 INDIA: MERCADO DE SERVICIOS DE PRUEBAS DE APLICACIONES MÓVILES, POR INDUSTRIA, 2020-2027 (MILLONES DE USD)
- TABLA 65 INDIA: MERCADO DE SERVICIOS DE PRUEBAS DE APLICACIONES MÓVILES, POR INDUSTRIA, 2020-2027 (MILLONES DE USD)
- TABLA 66 RESTO DE ASIA-PACÍFICO: MERCADO DE SERVICIOS DE PRUEBAS DE APLICACIONES MÓVILES, POR TIPO, 2020-2027 (MILLONES DE USD)
- TABLA 67 RESTO DE ASIA-PACÍFICO: MERCADO DE SERVICIOS DE PRUEBAS DE APLICACIONES MÓVILES, POR TIPO, 2020-2027 (MILLONES DE USD)
- TABLA 68 RESTO DE ASIA-PACÍFICO: MERCADO DE SERVICIOS DE PRUEBAS DE APLICACIONES MÓVILES, POR INDUSTRIA, 2020–2027 (USD MILLONES)
- TABLA 69 RESTO DE ASIA-PACÍFICO: MERCADO DE SERVICIOS DE PRUEBAS DE APLICACIONES MÓVILES, POR INDUSTRIA, 2020–2027 (USD MILLONES)
- TABLA 70 RESTO DEL MUNDO: MERCADO DE SERVICIOS DE PRUEBAS DE APLICACIONES MÓVILES, POR REGIÓN, 2020–2022 (USD MILLONES)
- TABLA 71 RESTO DEL MUNDO: MERCADO DE SERVICIOS DE PRUEBAS DE APLICACIONES MÓVILES, POR REGIÓN, 2020-2027 (MILLONES DE USD)
- TABLA 72 RESTO DEL MUNDO: MERCADO DE SERVICIOS DE PRUEBAS DE APLICACIONES MÓVILES, POR TIPO, 2020-2027 (MILLONES DE USD)
- TABLA 73 RESTO DEL MUNDO: MERCADO DE SERVICIOS DE PRUEBAS DE APLICACIONES MÓVILES, POR TIPO, 2020-2027 (MILLONES DE USD)
- TABLA 74 RESTO DEL MUNDO: CUOTA DE MERCADO DE SERVICIOS DE PRUEBAS DE APLICACIONES MÓVILES, POR INDUSTRIA, 2020-2027 (MILLONES DE USD)
- TABLA 75 RESTO DEL MUNDO: MERCADO DE SERVICIOS DE PRUEBAS DE APLICACIONES MÓVILES, POR INDUSTRIA, 2020–2027 (USD MILLONES)
- TABLA 76 RESTO DEL MUNDO: MERCADO DE SERVICIOS DE PRUEBAS DE APLICACIONES MÓVILES, POR INDUSTRIA, 2020–2027 (USD MILLONES)
- TABLA 77 ORIENTE MEDIO Y ÁFRICA: MERCADO DE SERVICIOS DE PRUEBAS DE APLICACIONES MÓVILES, POR TIPO, 2020–2027 (USD MILLONES)
- TABLA 78 ORIENTE MEDIO Y ÁFRICA: MERCADO DE SERVICIOS DE PRUEBAS DE APLICACIONES MÓVILES, POR TIPO, 2020–2027 (USD MILLONES)
- TABLA 79 ORIENTE MEDIO Y ÁFRICA: MERCADO DE SERVICIOS DE PRUEBAS DE APLICACIONES MÓVILES, POR INDUSTRIA, 2020–2027 (USD MILLONES)
- TABLA 80 ORIENTE MEDIO Y ÁFRICA: MERCADO DE SERVICIOS DE PRUEBAS DE APLICACIONES MÓVILES, POR INDUSTRIA, 2020-2027 (MILLONES DE USD)
- TABLA 81 SUDAMÉRICA: MERCADO DE SERVICIOS DE PRUEBAS DE APLICACIONES MÓVILES, POR TIPO, 2020-2027 (MILLONES DE USD)
- TABLA 82 SUDAMÉRICA: MERCADO DE SERVICIOS DE PRUEBAS DE APLICACIONES MÓVILES, POR TIPO, 2020-2027 (MILLONES DE USD)
- TABLA 83 SUDAMÉRICA: MERCADO DE SERVICIOS DE PRUEBAS DE APLICACIONES MÓVILES, POR INDUSTRIA, 2020-2027 (MILLONES DE USD)
- TABLA 84 SUDAMÉRICA: MERCADO DE SERVICIOS DE PRUEBAS DE APLICACIONES MÓVILES, POR INDUSTRIA, 2020-2027 (MILLONES DE USD) MILLONES)
-
14 Lista de figuras
- FIGURA 1 SINOPSIS DEL MERCADO
- FIGURA 2 ANÁLISIS DEL ATRACTIVO DEL MERCADO: MERCADO GLOBAL DE SERVICIOS DE PRUEBAS DE APLICACIONES MÓVILES
- FIGURA 3 ANÁLISIS DEL MERCADO GLOBAL DE SERVICIOS DE PRUEBAS DE APLICACIONES MÓVILES POR TIPO, 2020 (%)
- FIGURA 4 ANÁLISIS DEL MERCADO GLOBAL DE SERVICIOS DE PRUEBAS DE APLICACIONES MÓVILES POR INDUSTRIA, 2020 (%)
- FIGURA 5 ANÁLISIS DEL MERCADO GLOBAL DE SERVICIOS DE PRUEBAS DE APLICACIONES MÓVILES POR REGIÓN, 2020 (%)
- FIGURA 6 MERCADO GLOBAL DE SERVICIOS DE PRUEBAS DE APLICACIONES MÓVILES: ESTRUCTURA DEL MERCADO
- FIGURA 7 PROCESO DE INVESTIGACIÓN DE MRFR
- FIGURA 8 ENFOQUE DE ARRIBA HACIA ABAJO Y DE ABAJO HACIA ARRIBA
- FIGURA 9 TAMAÑO DEL MERCADO DE AMÉRICA DEL NORTE Y PARTICIPACIÓN DE MERCADO POR PAÍS (2020 VS 2027)
- FIGURA 10 TAMAÑO DEL MERCADO DE EUROPA Y PARTICIPACIÓN DE MERCADO POR PAÍS (2020 VS 2027)
- FIGURA 11 ASIA-PACÍFICO Y PARTICIPACIÓN DE MERCADO POR PAÍS (2020 VS 2027)
- FIGURA 12 RESTO DEL MUNDO Y CUOTA DE MERCADO POR PAÍS (2020 VS 2027)
- FIGURA 13 ANÁLISIS DROC DEL MERCADO GLOBAL DE SERVICIOS DE PRUEBAS DE APLICACIONES MÓVILES
- FIGURA 14 ANÁLISIS DEL IMPACTO DE LOS IMPULSORES: MERCADO DE SERVICIOS DE PRUEBAS DE APLICACIONES MÓVILES
- FIGURA 15 ANÁLISIS DEL IMPACTO DE LAS RESTRICCIONES: MERCADO DE SERVICIOS DE PRUEBAS DE APLICACIONES MÓVILES
- FIGURA 16 ANÁLISIS DE LAS CINCO FUERZAS DE PORTER DEL MERCADO GLOBAL DE SERVICIOS DE PRUEBAS DE APLICACIONES MÓVILES
- FIGURA 17 MERCADO GLOBAL DE SERVICIOS DE PRUEBAS DE APLICACIONES MÓVILES, POR TIPO, 2020-2027 (MILLONES DE USD)
- FIGURA 18 MERCADO GLOBAL DE SERVICIOS DE PRUEBAS DE APLICACIONES MÓVILES, POR INDUSTRIA, 2020-2027 (USD MILLONES)
- FIGURA 19 MERCADO GLOBAL DE SERVICIOS DE PRUEBAS DE APLICACIONES MÓVILES, POR REGIÓN, 2020-2027 (USD MILLONES)
- FIGURA 20 AMÉRICA DEL NORTE: CUOTA DE MERCADO DE SERVICIOS DE PRUEBAS DE APLICACIONES MÓVILES, POR PAÍS, 2020-2027 (USD MILLONES)
- FIGURA 21 AMÉRICA DEL NORTE: CUOTA DE MERCADO DE SERVICIOS DE PRUEBAS DE APLICACIONES MÓVILES, POR TIPO, 2020-2027 (USD MILLONES)
- FIGURA 22 AMÉRICA DEL NORTE: CUOTA DE MERCADO DE SERVICIOS DE PRUEBAS DE APLICACIONES MÓVILES, POR INDUSTRIA, 2020-2027 (USD MILLONES)
- FIGURA EUROPA: CUOTA DE MERCADO DE SERVICIOS DE PRUEBAS DE APLICACIONES MÓVILES, POR PAÍS, 2020-2027 (MILLONES DE USD)
Customer Stories

“This is really good guys. Excellent work on a tight deadline. I will continue to use you going forward and recommend you to others. Nice job”

“Thanks. It’s been a pleasure working with you, please use me as reference with any other Intel employees.”

“Thanks for sending the report it gives us a good global view of the Betaïne market.”

“Thank you, this will be very helpful for OQS.”

“We found the report very insightful! we found your research firm very helpful. I'm sending this email to secure our future business.”

“I am very pleased with how market segments have been defined in a relevant way for my purposes (such as "Portable Freezers & refrigerators" and "last-mile"). In general the report is well structured. Thanks very much for your efforts.”

“I have been reading the first document or the study, ,the Global HVAC and FP market report 2021 till 2026. Must say, good info! I have not gone in depth at all parts, but got a good indication of the data inside!”

“We got the report in time, we really thank you for your support in this process. I also thank to all of your team as they did a great job.”
