Request Free Sample ×

Kindly complete the form below to receive a free sample of this Report

* Please use a valid business email

Leading companies partner with us for data-driven Insights

clients tt-cursor
Hero Background

Metaverso en el mercado de comercio electrónico

ID: MRFR/ICT/31653-HCR
100 Pages
Aarti Dhapte
Last Updated: April 06, 2026

Informe de Investigación del Mercado del Metaverso en el Comercio Electrónico: Por Aplicación (Retail, Eventos Virtuales, Juegos), Por Tecnología (Realidad Aumentada, Realidad Virtual, Realidad Mixta), Por Plataforma (Escritorio, Móvil, Cascos de VR), Por Tipo de Consumidor (Consumidores Individuales, B2B, Influencers) y Por Región (América del Norte, Europa, América del Sur, Asia-Pacífico, Medio Oriente y África) - Pronóstico hasta 2035

Compartir
Download PDF ×

We do not share your information with anyone. However, we may send you emails based on your report interest from time to time. You may contact us at any time to opt-out.

Metaverse In E Commerce Market Infographic
Purchase Options
  1. 1 RESUMEN EJECUTIVO
    1. 1.1 Visión General del Mercado
    2. 1.2 Hallazgos Clave
    3. 1.3 Segmentación del Mercado
    4. 1.4 Panorama Competitivo
    5. 1.5 Desafíos y Oportunidades
    6. 1.6 Perspectivas Futuras
  2. 2 INTRODUCCIÓN AL MERCADO
    1. 2.1 Definición
    2. 2.2 Alcance del estudio
      1. 2.2.1 Objetivo de la Investigación
      2. 2.2.2 Suposición
      3. 2.2.3 Limitaciones
  3. 3 METODOLOGÍA DE INVESTIGACIÓN
    1. 3.1 Visión General
    2. 3.2 Minería de Datos
    3. 3.3 Investigación Secundaria
    4. 3.4 Investigación Primaria
      1. 3.4.1 Entrevistas Primarias y Proceso de Recopilación de Información
      2. 3.4.2 Desglose de los Respondientes Primarios
    5. 3.5 Modelo de Pronóstico
    6. 3.6 Estimación del Tamaño del Mercado
      1. 3.6.1 Enfoque de Arriba hacia Abajo
      2. 3.6.2 Enfoque de Abajo hacia Arriba
    7. 3.7 Triangulación de Datos
    8. 3.8 Validación
  4. 4 DINÁMICAS DEL MERCADO
    1. 4.1 Visión General
    2. 4.2 Impulsores
    3. 4.3 Restricciones
    4. 4.4 Oportunidades
  5. 5 ANÁLISIS DE FACTORES DEL MERCADO
    1. 5.1 Análisis de la Cadena de Valor
    2. 5.2 Análisis de las Cinco Fuerzas de Porter
      1. 5.2.1 Poder de Negociación de los Proveedores
      2. 5.2.2 Poder de Negociación de los Compradores
      3. 5.2.3 Amenaza de Nuevos Entrantes
      4. 5.2.4 Amenaza de Sustitutos
      5. 5.2.5 Intensidad de Rivalidad
    3. 5.3 Análisis del Impacto del COVID-19
      1. 5.3.1 Análisis del Impacto en el Mercado
      2. 5.3.2 Impacto Regional
      3. 5.3.3 Análisis de Oportunidades y Amenazas
  6. 6 METAVERSO EN EL MERCADO DE COMERCIO ELECTRÓNICO, POR APLICACIÓN (USD MIL MILLONES)
    1. 6.1 Retail
    2. 6.2 Eventos Virtuales
    3. 6.3 Juegos
  7. 7 METAVERSO EN EL MERCADO DE COMERCIO ELECTRÓNICO, POR TECNOLOGÍA (USD MIL MILLONES)
    1. 7.1 Realidad Aumentada
    2. 7.2 Realidad Virtual
    3. 7.3 Realidad Mixta
  8. 8 METAVERSO EN EL MERCADO DE COMERCIO ELECTRÓNICO, POR PLATAFORMA (USD MIL MILLONES)
    1. 8.1 Escritorio
    2. 8.2 Móvil
    3. 8.3 Cascos de VR
  9. 9 METAVERSO EN EL MERCADO DE COMERCIO ELECTRÓNICO, POR TIPO DE CONSUMIDOR (USD MIL MILLONES)
    1. 9.1 Consumidores Individuales
    2. 9.2 B2B
    3. 9.3 Influencers
  10. 10 METAVERSO EN EL MERCADO DE COMERCIO ELECTRÓNICO, POR REGIÓN (USD MIL MILLONES)
    1. 10.1 América del Norte
      1. 10.1.1 EE. UU.
      2. 10.1.2 Canadá
    2. 10.2 Europa
      1. 10.2.1 Alemania
      2. 10.2.2 Reino Unido
      3. 10.2.3 Francia
      4. 10.2.4 Rusia
      5. 10.2.5 Italia
      6. 10.2.6 España
      7. 10.2.7 Resto de Europa
    3. 10.3 APAC
      1. 10.3.1 China
      2. 10.3.2 India
      3. 10.3.3 Japón
      4. 10.3.4 Corea del Sur
      5. 10.3.5 Malasia
      6. 10.3.6 Tailandia
      7. 10.3.7 Indonesia
      8. 10.3.8 Resto de APAC
    4. 10.4 América del Sur
      1. 10.4.1 Brasil
      2. 10.4.2 México
      3. 10.4.3 Argentina
      4. 10.4.4 Resto de América del Sur
    5. 10.5 MEA
      1. 10.5.1 Países del CCG
      2. 10.5.2 Sudáfrica
      3. 10.5.3 Resto de MEA
  11. 11 PANORAMA COMPETITIVO
    1. 11.1 Visión General
    2. 11.2 Análisis Competitivo
    3. 11.3 Análisis de Participación de Mercado
    4. 11.4 Estrategia de Crecimiento Principal en el Metaverso en el Mercado de Comercio Electrónico
    5. 11.5 Comparación Competitiva
    6. 11.6 Principales Actores en Términos de Número de Desarrollos en el Metaverso en el Mercado de Comercio Electrónico
    7. 11.7 Principales desarrollos y estrategias de crecimiento
      1. 11.7.1 Lanzamiento de Nuevos Productos/Implementación de Servicios
      2. 11.7.2 Fusiones y Adquisiciones
      3. 11.7.3 Empresas Conjuntas
    8. 11.8 Matriz Financiera de los Principales Actores
      1. 11.8.1 Ventas e Ingresos Operativos
      2. 11.8.2 Gasto en I+D de los Principales Actores. 2023
  12. 12 PERFILES DE LAS EMPRESAS
    1. 12.1 Microsoft
      1. 12.1.1 Visión General Financiera
      2. 12.1.2 Productos Ofrecidos
      3. 12.1.3 Principales Desarrollos
      4. 12.1.4 Análisis FODA
      5. 12.1.5 Estrategias Clave
    2. 12.2 eBay
      1. 12.2.1 Visión General Financiera
      2. 12.2.2 Productos Ofrecidos
      3. 12.2.3 Principales Desarrollos
      4. 12.2.4 Análisis FODA
      5. 12.2.5 Estrategias Clave
    3. 12.3 Shopify
      1. 12.3.1 Visión General Financiera
      2. 12.3.2 Productos Ofrecidos
      3. 12.3.3 Principales Desarrollos
      4. 12.3.4 Análisis FODA
      5. 12.3.5 Estrategias Clave
    4. 12.4 Roblox
      1. 12.4.1 Visión General Financiera
      2. 12.4.2 Productos Ofrecidos
      3. 12.4.3 Principales Desarrollos
      4. 12.4.4 Análisis FODA
      5. 12.4.5 Estrategias Clave
    5. 12.5 Decentraland
      1. 12.5.1 Visión General Financiera
      2. 12.5.2 Productos Ofrecidos
      3. 12.5.3 Principales Desarrollos
      4. 12.5.4 Análisis FODA
      5. 12.5.5 Estrategias Clave
    6. 12.6 Meta
      1. 12.6.1 Visión General Financiera
      2. 12.6.2 Productos Ofrecidos
      3. 12.6.3 Principales Desarrollos
      4. 12.6.4 Análisis FODA
      5. 12.6.5 Estrategias Clave
    7. 12.7 Apple
      1. 12.7.1 Visión General Financiera
      2. 12.7.2 Productos Ofrecidos
      3. 12.7.3 Principales Desarrollos
      4. 12.7.4 Análisis FODA
      5. 12.7.5 Estrategias Clave
    8. 12.8 Google
      1. 12.8.1 Visión General Financiera
      2. 12.8.2 Productos Ofrecidos
      3. 12.8.3 Principales Desarrollos
      4. 12.8.4 Análisis FODA
      5. 12.8.5 Estrategias Clave
    9. 12.9 Snap
      1. 12.9.1 Visión General Financiera
      2. 12.9.2 Productos Ofrecidos
      3. 12.9.3 Principales Desarrollos
      4. 12.9.4 Análisis FODA
      5. 12.9.5 Estrategias Clave
    10. 12.10 Alibaba
      1. 12.10.1 Visión General Financiera
      2. 12.10.2 Productos Ofrecidos
      3. 12.10.3 Principales Desarrollos
      4. 12.10.4 Análisis FODA
      5. 12.10.5 Estrategias Clave
    11. 12.11 Epic Games
      1. 12.11.1 Visión General Financiera
      2. 12.11.2 Productos Ofrecidos
      3. 12.11.3 Principales Desarrollos
      4. 12.11.4 Análisis FODA
      5. 12.11.5 Estrategias Clave
    12. 12.12 Tencent
      1. 12.12.1 Visión General Financiera
      2. 12.12.2 Productos Ofrecidos
      3. 12.12.3 Principales Desarrollos
      4. 12.12.4 Análisis FODA
      5. 12.12.5 Estrategias Clave
    13. 12.13 Nvidia
      1. 12.13.1 Visión General Financiera
      2. 12.13.2 Productos Ofrecidos
      3. 12.13.3 Principales Desarrollos
      4. 12.13.4 Análisis FODA
      5. 12.13.5 Estrategias Clave
    14. 12.14 Amazon
      1. 12.14.1 Visión General Financiera
      2. 12.14.2 Productos Ofrecidos
      3. 12.14.3 Principales Desarrollos
      4. 12.14.4 Análisis FODA
      5. 12.14.5 Estrategias Clave
    15. 12.15 Walmart
      1. 12.15.1 Visión General Financiera
      2. 12.15.2 Productos Ofrecidos
      3. 12.15.3 Principales Desarrollos
      4. 12.15.4 Análisis FODA
      5. 12.15.5 Estrategias Clave
  13. 13 APÉNDICE
    1. 13.1 Referencias
    2. 13.2 Informes Relacionados
    3. LISTA DE TABLAS
    4. TABLA 1. LISTA DE SUPOSICIONES
    5. TABLA 2. ESTIMACIONES Y PRONÓSTICO DEL TAMAÑO DEL MERCADO DEL METAVERSO EN AMÉRICA DEL NORTE, POR APLICACIÓN, 2019-2032 (USD MIL MILLONES)
    6. TABLA 3. ESTIMACIONES Y PRONÓSTICO DEL TAMAÑO DEL MERCADO DEL METAVERSO EN AMÉRICA DEL NORTE, POR TECNOLOGÍA, 2019-2032 (USD MIL MILLONES)
    7. TABLA 4. ESTIMACIONES Y PRONÓSTICO DEL TAMAÑO DEL MERCADO DEL METAVERSO EN AMÉRICA DEL NORTE, POR PLATAFORMA, 2019-2032 (USD MIL MILLONES)
    8. TABLA 5. ESTIMACIONES Y PRONÓSTICO DEL TAMAÑO DEL MERCADO DEL METAVERSO EN AMÉRICA DEL NORTE, POR TIPO DE CONSUMIDOR, 2019-2032 (USD MIL MILLONES)
    9. TABLA 6. ESTIMACIONES Y PRONÓSTICO DEL TAMAÑO DEL MERCADO DEL METAVERSO EN AMÉRICA DEL NORTE, POR REGIÓN, 2019-2032 (USD MIL MILLONES)
    10. TABLA 7. ESTIMACIONES Y PRONÓSTICO DEL TAMAÑO DEL MERCADO DEL METAVERSO EN EE. UU., POR APLICACIÓN, 2019-2032 (USD MIL MILLONES)
    11. TABLA 8. ESTIMACIONES Y PRONÓSTICO DEL TAMAÑO DEL MERCADO DEL METAVERSO EN EE. UU., POR TECNOLOGÍA, 2019-2032 (USD MIL MILLONES)
    12. TABLA 9. ESTIMACIONES Y PRONÓSTICO DEL TAMAÑO DEL MERCADO DEL METAVERSO EN EE. UU., POR PLATAFORMA, 2019-2032 (USD MIL MILLONES)
    13. TABLA 10. ESTIMACIONES Y PRONÓSTICO DEL TAMAÑO DEL MERCADO DEL METAVERSO EN EE. UU., POR TIPO DE CONSUMIDOR, 2019-2032 (USD MIL MILLONES)
    14. TABLA 11. ESTIMACIONES Y PRONÓSTICO DEL TAMAÑO DEL MERCADO DEL METAVERSO EN EE. UU., POR REGIÓN, 2019-2032 (USD MIL MILLONES)
    15. TABLA 12. ESTIMACIONES Y PRONÓSTICO DEL TAMAÑO DEL MERCADO DEL METAVERSO EN CANADÁ, POR APLICACIÓN, 2019-2032 (USD MIL MILLONES)
    16. TABLA 13. ESTIMACIONES Y PRONÓSTICO DEL TAMAÑO DEL MERCADO DEL METAVERSO EN CANADÁ, POR TECNOLOGÍA, 2019-2032 (USD MIL MILLONES)
    17. TABLA 14. ESTIMACIONES Y PRONÓSTICO DEL TAMAÑO DEL MERCADO DEL METAVERSO EN CANADÁ, POR PLATAFORMA, 2019-2032 (USD MIL MILLONES)
    18. TABLA 15. ESTIMACIONES Y PRONÓSTICO DEL TAMAÑO DEL MERCADO DEL METAVERSO EN CANADÁ, POR TIPO DE CONSUMIDOR, 2019-2032 (USD MIL MILLONES)
    19. TABLA 16. ESTIMACIONES Y PRONÓSTICO DEL TAMAÑO DEL MERCADO DEL METAVERSO EN CANADÁ, POR REGIÓN, 2019-2032 (USD MIL MILLONES)
    20. TABLA 17. ESTIMACIONES Y PRONÓSTICO DEL TAMAÑO DEL MERCADO DEL METAVERSO EN EUROPA, POR APLICACIÓN, 2019-2032 (USD MIL MILLONES)
    21. TABLA 18. ESTIMACIONES Y PRONÓSTICO DEL TAMAÑO DEL MERCADO DEL METAVERSO EN EUROPA, POR TECNOLOGÍA, 2019-2032 (USD MIL MILLONES)
    22. TABLA 19. ESTIMACIONES Y PRONÓSTICO DEL TAMAÑO DEL MERCADO DEL METAVERSO EN EUROPA, POR PLATAFORMA, 2019-2032 (USD MIL MILLONES)
    23. TABLA 20. ESTIMACIONES Y PRONÓSTICO DEL TAMAÑO DEL MERCADO DEL METAVERSO EN EUROPA, POR TIPO DE CONSUMIDOR, 2019-2032 (USD MIL MILLONES)
    24. TABLA 21. ESTIMACIONES Y PRONÓSTICO DEL TAMAÑO DEL MERCADO DEL METAVERSO EN EUROPA, POR REGIÓN, 2019-2032 (USD MIL MILLONES)
    25. TABLA 22. ESTIMACIONES Y PRONÓSTICO DEL TAMAÑO DEL MERCADO DEL METAVERSO EN ALEMANIA, POR APLICACIÓN, 2019-2032 (USD MIL MILLONES)
    26. TABLA 23. ESTIMACIONES Y PRONÓSTICO DEL TAMAÑO DEL MERCADO DEL METAVERSO EN ALEMANIA, POR TECNOLOGÍA, 2019-2032 (USD MIL MILLONES)
    27. TABLA 24. ESTIMACIONES Y PRONÓSTICO DEL TAMAÑO DEL MERCADO DEL METAVERSO EN ALEMANIA, POR PLATAFORMA, 2019-2032 (USD MIL MILLONES)
    28. TABLA 25. ESTIMACIONES Y PRONÓSTICO DEL TAMAÑO DEL MERCADO DEL METAVERSO EN ALEMANIA, POR TIPO DE CONSUMIDOR, 2019-2032 (USD MIL MILLONES)
    29. TABLA 26. ESTIMACIONES Y PRONÓSTICO DEL TAMAÑO DEL MERCADO DEL METAVERSO EN ALEMANIA, POR REGIÓN, 2019-2032 (USD MIL MILLONES)
    30. TABLA 27. ESTIMACIONES Y PRONÓSTICO DEL TAMAÑO DEL MERCADO DEL METAVERSO EN REINO UNIDO, POR APLICACIÓN, 2019-2032 (USD MIL MILLONES)
    31. TABLA 28. ESTIMACIONES Y PRONÓSTICO DEL TAMAÑO DEL MERCADO DEL METAVERSO EN REINO UNIDO, POR TECNOLOGÍA, 2019-2032 (USD MIL MILLONES)
    32. TABLA 29. ESTIMACIONES Y PRONÓSTICO DEL TAMAÑO DEL MERCADO DEL METAVERSO EN REINO UNIDO, POR PLATAFORMA, 2019-2032 (USD MIL MILLONES)
    33. TABLA 30. ESTIMACIONES Y PRONÓSTICO DEL TAMAÑO DEL MERCADO DEL METAVERSO EN REINO UNIDO, POR TIPO DE CONSUMIDOR, 2019-2032 (USD MIL MILLONES)
    34. TABLA 31. ESTIMACIONES Y PRONÓSTICO DEL TAMAÑO DEL MERCADO DEL METAVERSO EN REINO UNIDO, POR REGIÓN, 2019-2032 (USD MIL MILLONES)
    35. TABLA 32. ESTIMACIONES Y PRONÓSTICO DEL TAMAÑO DEL MERCADO DEL METAVERSO EN FRANCIA, POR APLICACIÓN, 2019-2032 (USD MIL MILLONES)
    36. TABLA 33. ESTIMACIONES Y PRONÓSTICO DEL TAMAÑO DEL MERCADO DEL METAVERSO EN FRANCIA, POR TECNOLOGÍA, 2019-2032 (USD MIL MILLONES)
    37. TABLA 34. ESTIMACIONES Y PRONÓSTICO DEL TAMAÑO DEL MERCADO DEL METAVERSO EN FRANCIA, POR PLATAFORMA, 2019-2032 (USD MIL MILLONES)
    38. TABLA 35. ESTIMACIONES Y PRONÓSTICO DEL TAMAÑO DEL MERCADO DEL METAVERSO EN FRANCIA, POR TIPO DE CONSUMIDOR, 2019-2032 (USD MIL MILLONES)
    39. TABLA 36. ESTIMACIONES Y PRONÓSTICO DEL TAMAÑO DEL MERCADO DEL METAVERSO EN FRANCIA, POR REGIÓN, 2019-2032 (USD MIL MILLONES)
    40. TABLA 37. ESTIMACIONES Y PRONÓSTICO DEL TAMAÑO DEL MERCADO DEL METAVERSO EN RUSIA, POR APLICACIÓN, 2019-2032 (USD MIL MILLONES)
    41. TABLA 38. ESTIMACIONES Y PRONÓSTICO DEL TAMAÑO DEL MERCADO DEL METAVERSO EN RUSIA, POR TECNOLOGÍA, 2019-2032 (USD MIL MILLONES)
    42. TABLA 39. ESTIMACIONES Y PRONÓSTICO DEL TAMAÑO DEL MERCADO DEL METAVERSO EN RUSIA, POR PLATAFORMA, 2019-2032 (USD MIL MILLONES)
    43. TABLA 40. ESTIMACIONES Y PRONÓSTICO DEL TAMAÑO DEL MERCADO DEL METAVERSO EN RUSIA, POR TIPO DE CONSUMIDOR, 2019-2032 (USD MIL MILLONES)
    44. TABLA 41. ESTIMACIONES Y PRONÓSTICO DEL TAMAÑO DEL MERCADO DEL METAVERSO EN RUSIA, POR REGIÓN, 2019-2032 (USD MIL MILLONES)
    45. TABLA 42. ESTIMACIONES Y PRONÓSTICO DEL TAMAÑO DEL MERCADO DEL METAVERSO EN ITALIA, POR APLICACIÓN, 2019-2032 (USD MIL MILLONES)
    46. TABLA 43. ESTIMACIONES Y PRONÓSTICO DEL TAMAÑO DEL MERCADO DEL METAVERSO EN ITALIA, POR TECNOLOGÍA, 2019-2032 (USD MIL MILLONES)
    47. TABLA 44. ESTIMACIONES Y PRONÓSTICO DEL TAMAÑO DEL MERCADO DEL METAVERSO EN ITALIA, POR PLATAFORMA, 2019-2032 (USD MIL MILLONES)
    48. TABLA 45. ESTIMACIONES Y PRONÓSTICO DEL TAMAÑO DEL MERCADO DEL METAVERSO EN ITALIA, POR TIPO DE CONSUMIDOR, 2019-2032 (USD MIL MILLONES)
    49. TABLA 46. ESTIMACIONES Y PRONÓSTICO DEL TAMAÑO DEL MERCADO DEL METAVERSO EN ITALIA, POR REGIÓN, 2019-2032 (USD MIL MILLONES)
    50. TABLA 47. ESTIMACIONES Y PRONÓSTICO DEL TAMAÑO DEL MERCADO DEL METAVERSO EN ESPAÑA, POR APLICACIÓN, 2019-2032 (USD MIL MILLONES)
    51. TABLA 48. ESTIMACIONES Y PRONÓSTICO DEL TAMAÑO DEL MERCADO DEL METAVERSO EN ESPAÑA, POR TECNOLOGÍA, 2019-2032 (USD MIL MILLONES)
    52. TABLA 49. ESTIMACIONES Y PRONÓSTICO DEL TAMAÑO DEL MERCADO DEL METAVERSO EN ESPAÑA, POR PLATAFORMA, 2019-2032 (USD MIL MILLONES)
    53. TABLA 50. ESTIMACIONES Y PRONÓSTICO DEL TAMAÑO DEL MERCADO DEL METAVERSO EN ESPAÑA, POR TIPO DE CONSUMIDOR, 2019-2032 (USD MIL MILLONES)
    54. TABLA 51. ESTIMACIONES Y PRONÓSTICO DEL TAMAÑO DEL MERCADO DEL METAVERSO EN ESPAÑA, POR REGIÓN, 2019-2032 (USD MIL MILLONES)
    55. TABLA 52. ESTIMACIONES Y PRONÓSTICO DEL TAMAÑO DEL MERCADO DEL METAVERSO EN EL RESTO DE EUROPA, POR APLICACIÓN, 2019-2032 (USD MIL MILLONES)
    56. TABLA 53. ESTIMACIONES Y PRONÓSTICO DEL TAMAÑO DEL MERCADO DEL METAVERSO EN EL RESTO DE EUROPA, POR TECNOLOGÍA, 2019-2032 (USD MIL MILLONES)
    57. TABLA 54. ESTIMACIONES Y PRONÓSTICO DEL TAMAÑO DEL MERCADO DEL METAVERSO EN EL RESTO DE EUROPA, POR PLATAFORMA, 2019-2032 (USD MIL MILLONES)
    58. TABLA 55. ESTIMACIONES Y PRONÓSTICO DEL TAMAÑO DEL MERCADO DEL METAVERSO EN EL RESTO DE EUROPA, POR TIPO DE CONSUMIDOR, 2019-2032 (USD MIL MILLONES)
    59. TABLA 56. ESTIMACIONES Y PRONÓSTICO DEL TAMAÑO DEL MERCADO DEL METAVERSO EN EL RESTO DE EUROPA, POR REGIÓN, 2019-2032 (USD MIL MILLONES)
    60. TABLA 57. ESTIMACIONES Y PRONÓSTICO DEL TAMAÑO DEL MERCADO DEL METAVERSO EN APAC, POR APLICACIÓN, 2019-2032 (USD MIL MILLONES)
    61. TABLA 58. ESTIMACIONES Y PRONÓSTICO DEL TAMAÑO DEL MERCADO DEL METAVERSO EN APAC, POR TECNOLOGÍA, 2019-2032 (USD MIL MILLONES)
    62. TABLA 59. ESTIMACIONES Y PRONÓSTICO DEL TAMAÑO DEL MERCADO DEL METAVERSO EN APAC, POR PLATAFORMA, 2019-2032 (USD MIL MILLONES)
    63. TABLA 60. ESTIMACIONES Y PRONÓSTICO DEL TAMAÑO DEL MERCADO DEL METAVERSO EN APAC, POR TIPO DE CONSUMIDOR, 2019-2032 (USD MIL MILLONES)
    64. TABLA 61. ESTIMACIONES Y PRONÓSTICO DEL TAMAÑO DEL MERCADO DEL METAVERSO EN APAC, POR REGIÓN, 2019-2032 (USD MIL MILLONES)
    65. TABLA 62. ESTIMACIONES Y PRONÓSTICO DEL TAMAÑO DEL MERCADO DEL METAVERSO EN CHINA, POR APLICACIÓN, 2019-2032 (USD MIL MILLONES)
    66. TABLA 63. ESTIMACIONES Y PRONÓSTICO DEL TAMAÑO DEL MERCADO DEL METAVERSO EN CHINA, POR TECNOLOGÍA, 2019-2032 (USD MIL MILLONES)
    67. TABLA 64. ESTIMACIONES Y PRONÓSTICO DEL TAMAÑO DEL MERCADO DEL METAVERSO EN CHINA, POR PLATAFORMA, 2019-2032 (USD MIL MILLONES)
    68. TABLA 65. ESTIMACIONES Y PRONÓSTICO DEL TAMAÑO DEL MERCADO DEL METAVERSO EN CHINA, POR TIPO DE CONSUMIDOR, 2019-2032 (USD MIL MILLONES)
    69. TABLA 66. ESTIMACIONES Y PRONÓSTICO DEL TAMAÑO DEL MERCADO DEL METAVERSO EN CHINA, POR REGIÓN, 2019-2032 (USD MIL MILLONES)
    70. TABLA 67. ESTIMACIONES Y PRONÓSTICO DEL TAMAÑO DEL MERCADO DEL METAVERSO EN INDIA, POR APLICACIÓN, 2019-2032 (USD MIL MILLONES)
    71. TABLA 68. ESTIMACIONES Y PRONÓSTICO DEL TAMAÑO DEL MERCADO DEL METAVERSO EN INDIA, POR TECNOLOGÍA, 2019-2032 (USD MIL MILLONES)
    72. TABLA 69. ESTIMACIONES Y PRONÓSTICO DEL TAMAÑO DEL MERCADO DEL METAVERSO EN INDIA, POR PLATAFORMA, 2019-2032 (USD MIL MILLONES)
    73. TABLA 70. ESTIMACIONES Y PRONÓSTICO DEL TAMAÑO DEL MERCADO DEL METAVERSO EN INDIA, POR TIPO DE CONSUMIDOR, 2019-2032 (USD MIL MILLONES)
    74. TABLA 71. ESTIMACIONES Y PRONÓSTICO DEL TAMAÑO DEL MERCADO DEL METAVERSO EN INDIA, POR REGIÓN, 2019-2032 (USD MIL MILLONES)
    75. TABLA 72. ESTIMACIONES Y PRONÓSTICO DEL TAMAÑO DEL MERCADO DEL METAVERSO EN JAPÓN, POR APLICACIÓN, 2019-2032 (USD MIL MILLONES)
    76. TABLA 73. ESTIMACIONES Y PRONÓSTICO DEL TAMAÑO DEL MERCADO DEL METAVERSO EN JAPÓN, POR TECNOLOGÍA, 2019-2032 (USD MIL MILLONES)
    77. TABLA 74. ESTIMACIONES Y PRONÓSTICO DEL TAMAÑO DEL MERCADO DEL METAVERSO EN JAPÓN, POR PLATAFORMA, 2019-2032 (USD MIL MILLONES)
    78. TABLA 75. ESTIMACIONES Y PRONÓSTICO DEL TAMAÑO DEL MERCADO DEL METAVERSO EN JAPÓN, POR TIPO DE CONSUMIDOR, 2019-2032 (USD MIL MILLONES)
    79. TABLA 76. ESTIMACIONES Y PRONÓSTICO DEL TAMAÑO DEL MERCADO DEL METAVERSO EN JAPÓN, POR REGIÓN, 2019-2032 (USD MIL MILLONES)
    80. TABLA 77. ESTIMACIONES Y PRONÓSTICO DEL TAMAÑO DEL MERCADO DEL METAVERSO EN COREA DEL SUR, POR APLICACIÓN, 2019-2032 (USD MIL MILLONES)
    81. TABLA 78. ESTIMACIONES Y PRONÓSTICO DEL TAMAÑO DEL MERCADO DEL METAVERSO EN COREA DEL SUR, POR TECNOLOGÍA, 2019-2032 (USD MIL MILLONES)
    82. TABLA 79. ESTIMACIONES Y PRONÓSTICO DEL TAMAÑO DEL MERCADO DEL METAVERSO EN COREA DEL SUR, POR PLATAFORMA, 2019-2032 (USD MIL MILLONES)
    83. TABLA 80. ESTIMACIONES Y PRONÓSTICO DEL TAMAÑO DEL MERCADO DEL METAVERSO EN COREA DEL SUR, POR TIPO DE CONSUMIDOR, 2019-2032 (USD MIL MILLONES)
    84. TABLA 81. ESTIMACIONES Y PRONÓSTICO DEL TAMAÑO DEL MERCADO DEL METAVERSO EN COREA DEL SUR, POR REGIÓN, 2019-2032 (USD MIL MILLONES)
    85. TABLA 82. ESTIMACIONES Y PRONÓSTICO DEL TAMAÑO DEL MERCADO DEL METAVERSO EN MALASIA, POR APLICACIÓN, 2019-2032 (USD MIL MILLONES)
    86. TABLA 83. ESTIMACIONES Y PRONÓSTICO DEL TAMAÑO DEL MERCADO DEL METAVERSO EN MALASIA, POR TECNOLOGÍA, 2019-2032 (USD MIL MILLONES)
    87. TABLA 84. ESTIMACIONES Y PRONÓSTICO DEL TAMAÑO DEL MERCADO DEL METAVERSO EN MALASIA, POR PLATAFORMA, 2019-2032 (USD MIL MILLONES)
    88. TABLA 85. ESTIMACIONES Y PRONÓSTICO DEL TAMAÑO DEL MERCADO DEL METAVERSO EN MALASIA, POR TIPO DE CONSUMIDOR, 2019-2032 (USD MIL MILLONES)
    89. TABLA 86. ESTIMACIONES Y PRONÓSTICO DEL TAMAÑO DEL MERCADO DEL METAVERSO EN MALASIA, POR REGIÓN, 2019-2032 (USD MIL MILLONES)
    90. TABLA 87. ESTIMACIONES Y PRONÓSTICO DEL TAMAÑO DEL MERCADO DEL METAVERSO EN TAILANDIA, POR APLICACIÓN, 2019-2032 (USD MIL MILLONES)
    91. TABLA 88. ESTIMACIONES Y PRONÓSTICO DEL TAMAÑO DEL MERCADO DEL METAVERSO EN TAILANDIA, POR TECNOLOGÍA, 2019-2032 (USD MIL MILLONES)
    92. TABLA 89. ESTIMACIONES Y PRONÓSTICO DEL TAMAÑO DEL MERCADO DEL METAVERSO EN TAILANDIA, POR PLATAFORMA, 2019-2032 (USD MIL MILLONES)
    93. TABLA 90. ESTIMACIONES Y PRONÓSTICO DEL TAMAÑO DEL MERCADO DEL METAVERSO EN TAILANDIA, POR TIPO DE CONSUMIDOR, 2019-2032 (USD MIL MILLONES)
    94. TABLA 91. ESTIMACIONES Y PRONÓSTICO DEL TAMAÑO DEL MERCADO DEL METAVERSO EN TAILANDIA, POR REGIÓN, 2019-2032 (USD MIL MILLONES)
    95. TABLA 92. ESTIMACIONES Y PRONÓSTICO DEL TAMAÑO DEL MERCADO DEL METAVERSO EN INDONESIA, POR APLICACIÓN, 2019-2032 (USD MIL MILLONES)
    96. TABLA 93. ESTIMACIONES Y PRONÓSTICO DEL TAMAÑO DEL MERCADO DEL METAVERSO EN INDONESIA, POR TECNOLOGÍA, 2019-2032 (USD MIL MILLONES)
    97. TABLA 94. ESTIMACIONES Y PRONÓSTICO DEL TAMAÑO DEL MERCADO DEL METAVERSO EN INDONESIA, POR PLATAFORMA, 2019-2032 (USD MIL MILLONES)
    98. TABLA 95. ESTIMACIONES Y PRONÓSTICO DEL TAMAÑO DEL MERCADO DEL METAVERSO EN INDONESIA, POR TIPO DE CONSUMIDOR, 2019-2032 (USD MIL MILLONES)
    99. TABLA 96. ESTIMACIONES Y PRONÓSTICO DEL TAMAÑO DEL MERCADO DEL METAVERSO EN INDONESIA, POR REGIÓN, 2019-2032 (USD MIL MILLONES)
    100. TABLA 97. ESTIMACIONES Y PRONÓSTICO DEL TAMAÑO DEL MERCADO DEL METAVERSO EN EL RESTO DE APAC, POR APLICACIÓN, 2019-2032 (USD MIL MILLONES)
    101. TABLA 98. ESTIMACIONES Y PRONÓSTICO DEL TAMAÑO DEL MERCADO DEL METAVERSO EN EL RESTO DE APAC, POR TECNOLOGÍA, 2019-2032 (USD MIL MILLONES)
    102. TABLA 99. ESTIMACIONES Y PRONÓSTICO DEL TAMAÑO DEL MERCADO DEL METAVERSO EN EL RESTO DE APAC, POR PLATAFORMA, 2019-2032 (USD MIL MILLONES)
    103. TABLA 100. ESTIMACIONES Y PRONÓSTICO DEL TAMAÑO DEL MERCADO DEL METAVERSO EN EL RESTO DE APAC, POR TIPO DE CONSUMIDOR, 2019-2032 (USD MIL MILLONES)
    104. TABLA 101. ESTIMACIONES Y PRONÓSTICO DEL TAMAÑO DEL MERCADO DEL METAVERSO EN EL RESTO DE APAC, POR REGIÓN, 2019-2032 (USD MIL MILLONES)
    105. TABLA 102. ESTIMACIONES Y PRONÓSTICO DEL TAMAÑO DEL MERCADO DEL METAVERSO EN AMÉRICA DEL SUR, POR APLICACIÓN, 2019-2032 (USD MIL MILLONES)
    106. TABLA 103. ESTIMACIONES Y PRONÓSTICO DEL TAMAÑO DEL MERCADO DEL METAVERSO EN AMÉRICA DEL SUR, POR TECNOLOGÍA, 2019-2032 (USD MIL MILLONES)
    107. TABLA 104. ESTIMACIONES Y PRONÓSTICO DEL TAMAÑO DEL MERCADO DEL METAVERSO EN AMÉRICA DEL SUR, POR PLATAFORMA, 2019-2032 (USD MIL MILLONES)
    108. TABLA 105. ESTIMACIONES Y PRONÓSTICO DEL TAMAÑO DEL MERCADO DEL METAVERSO EN AMÉRICA DEL SUR, POR TIPO DE CONSUMIDOR, 2019-2032 (USD MIL MILLONES)
    109. TABLA 106. ESTIMACIONES Y PRONÓSTICO DEL TAMAÑO DEL MERCADO DEL METAVERSO EN AMÉRICA DEL SUR, POR REGIÓN, 2019-2032 (USD MIL MILLONES)
    110. TABLA 107. ESTIMACIONES Y PRONÓSTICO DEL TAMAÑO DEL MERCADO DEL METAVERSO EN MEA, POR APLICACIÓN, 2019-2032 (USD MIL MILLONES)
    111. TABLA 108. ESTIMACIONES Y PRONÓSTICO DEL TAMAÑO DEL MERCADO DEL METAVERSO EN MEA, POR TECNOLOGÍA, 2019-2032 (USD MIL MILLONES)
    112. TABLA 109. ESTIMACIONES Y PRONÓSTICO DEL TAMAÑO DEL MERCADO DEL METAVERSO EN MEA, POR PLATAFORMA, 2019-2032 (USD MIL MILLONES)
    113. TABLA 110. ESTIMACIONES Y PRONÓSTICO DEL TAMAÑO DEL MERCADO DEL METAVERSO EN MEA, POR TIPO DE CONSUMIDOR, 2019-2032 (USD MIL MILLONES)
    114. TABLA 111. ESTIMACIONES Y PRONÓSTICO DEL TAMAÑO DEL MERCADO DEL METAVERSO EN MEA, POR REGIÓN, 2019-2032 (USD MIL MILLONES)
    115. TABLA 112. ESTIMACIONES Y PRONÓSTICO DEL TAMAÑO DEL MERCADO DEL METAVERSO EN PAÍSES DEL CCG, POR APLICACIÓN, 2019-2032 (USD MIL MILLONES)
    116. TABLA 113. ESTIMACIONES Y PRONÓSTICO DEL TAMAÑO DEL MERCADO DEL METAVERSO EN PAÍSES DEL CCG, POR TECNOLOGÍA, 2019-2032 (USD MIL MILLONES)
    117. TABLA 114. ESTIMACIONES Y PRONÓSTICO DEL TAMAÑO DEL MERCADO DEL METAVERSO EN PAÍSES DEL CCG, POR PLATAFORMA, 2019-2032 (USD MIL MILLONES)
    118. TABLA 115. ESTIMACIONES Y PRONÓSTICO DEL TAMAÑO DEL MERCADO DEL METAVERSO EN PAÍSES DEL CCG, POR TIPO DE CONSUMIDOR, 2019-2032 (USD MIL MILLONES)
    119. TABLA 116. ESTIMACIONES Y PRONÓSTICO DEL TAMAÑO DEL MERCADO DEL METAVERSO EN PAÍSES DEL CCG, POR REGIÓN, 2019-2032 (USD MIL MILLONES)
    120. TABLA 117. ESTIMACIONES Y PRONÓSTICO DEL TAMAÑO DEL MERCADO DEL METAVERSO EN SUDÁFRICA, POR APLICACIÓN, 2019-2032 (USD MIL MILLONES)
    121. TABLA 118. ESTIMACIONES Y PRONÓSTICO DEL TAMAÑO DEL MERCADO DEL METAVERSO EN SUDÁFRICA, POR TECNOLOGÍA, 2019-2032 (USD MIL MILLONES)
    122. TABLA 119. ESTIMACIONES Y PRONÓSTICO DEL TAMAÑO DEL MERCADO DEL METAVERSO EN SUDÁFRICA, POR PLATAFORMA, 2019-2032 (USD MIL MILLONES)
    123. TABLA 120. ESTIMACIONES Y PRONÓSTICO DEL TAMAÑO DEL MERCADO DEL METAVERSO EN SUDÁFRICA, POR TIPO DE CONSUMIDOR, 2019-2032 (USD MIL MILLONES)
    124. TABLA 121. ESTIMACIONES Y PRONÓSTICO DEL TAMAÑO DEL MERCADO DEL METAVERSO EN SUDÁFRICA, POR REGIÓN, 2019-2032 (USD MIL MILLONES)
    125. TABLA 122. ESTIMACIONES Y PRONÓSTICO DEL TAMAÑO DEL MERCADO DEL METAVERSO EN EL RESTO DE MEA, POR APLICACIÓN, 2019-2032 (USD MIL MILLONES)
    126. TABLA 123. ESTIMACIONES Y PRONÓSTICO DEL TAMAÑO DEL MERCADO DEL METAVERSO EN EL RESTO DE MEA, POR TECNOLOGÍA, 2019-2032 (USD MIL MILLONES)
    127. TABLA 124. ESTIMACIONES Y PRONÓSTICO DEL TAMAÑO DEL MERCADO DEL METAVERSO EN EL RESTO DE MEA, POR PLATAFORMA, 2019-2032 (USD MIL MILLONES)
    128. TABLA 125. ESTIMACIONES Y PRONÓSTICO DEL TAMAÑO DEL MERCADO DEL METAVERSO EN EL RESTO DE MEA, POR TIPO DE CONSUMIDOR, 2019-2032 (USD MIL MILLONES)
    129. TABLA 126. ESTIMACIONES Y PRONÓSTICO DEL TAMAÑO DEL MERCADO DEL METAVERSO EN EL RESTO DE MEA, POR REGIÓN, 2019-2032 (USD MIL MILLONES)
    130. TABLA 127. LANZAMIENTO DE PRODUCTO/DESARROLLO DE PRODUCTO/APROBACIÓN
    131. TABLA 128. ADQUISICIÓN/PARTNERSHIP
    132. LISTA DE FIGURAS
    133. FIGURA 1. SINOPSIS DEL MERCADO
    134. FIGURA 2. ANÁLISIS DEL MERCADO DEL METAVERSO EN AMÉRICA DEL NORTE
    135. FIGURA 3. ANÁLISIS DEL MERCADO DEL METAVERSO EN EE. UU. POR APLICACIÓN
    136. FIGURA 4. ANÁLISIS DEL MERCADO DEL METAVERSO EN EE. UU. POR TECNOLOGÍA
    137. FIGURA 5. ANÁLISIS DEL MERCADO DEL METAVERSO EN EE. UU. POR PLATAFORMA
    138. FIGURA 6. ANÁLISIS DEL MERCADO DEL METAVERSO EN EE. UU. POR TIPO DE CONSUMIDOR
    139. FIGURA 7. ANÁLISIS DEL MERCADO DEL METAVERSO EN EE. UU. POR REGIÓN
    140. FIGURA 8. ANÁLISIS DEL MERCADO DEL METAVERSO EN CANADÁ POR APLICACIÓN
    141. FIGURA 9. ANÁLISIS DEL MERCADO DEL METAVERSO EN CANADÁ POR TECNOLOGÍA
    142. FIGURA 10. ANÁLISIS DEL MERCADO DEL METAVERSO EN CANADÁ POR PLATAFORMA
    143. FIGURA 11. ANÁLISIS DEL MERCADO DEL METAVERSO EN CANADÁ POR TIPO DE CONSUMIDOR
    144. FIGURA 12. ANÁLISIS DEL MERCADO DEL METAVERSO EN CANADÁ POR REGIÓN
    145. FIGURA 13. ANÁLISIS DEL MERCADO DEL METAVERSO EN EUROPA
    146. FIGURA 14. ANÁLISIS DEL MERCADO DEL METAVERSO EN ALEMANIA POR APLICACIÓN
    147. FIGURA 15. ANÁLISIS DEL MERCADO DEL METAVERSO EN ALEMANIA POR TECNOLOGÍA
    148. FIGURA 16. ANÁLISIS DEL MERCADO DEL METAVERSO EN ALEMANIA POR PLATAFORMA
    149. FIGURA 17. ANÁLISIS DEL MERCADO DEL METAVERSO EN ALEMANIA POR TIPO DE CONSUMIDOR
    150. FIGURA 18. ANÁLISIS DEL MERCADO DEL METAVERSO EN ALEMANIA POR REGIÓN
    151. FIGURA 19. ANÁLISIS DEL MERCADO DEL METAVERSO EN REINO UNIDO POR APLICACIÓN
    152. FIGURA 20. ANÁLISIS DEL MERCADO DEL METAVERSO EN REINO UNIDO POR TECNOLOGÍA
    153. FIGURA 21. ANÁLISIS DEL MERCADO DEL METAVERSO EN REINO UNIDO POR PLATAFORMA
    154. FIGURA 22. ANÁLISIS DEL MERCADO DEL METAVERSO EN REINO UNIDO POR TIPO DE CONSUMIDOR
    155. FIGURA 23. ANÁLISIS DEL MERCADO DEL METAVERSO EN REINO UNIDO POR REGIÓN
    156. FIGURA 24. ANÁLISIS DEL MERCADO DEL METAVERSO EN FRANCIA POR APLICACIÓN
    157. FIGURA 25. ANÁLISIS DEL MERCADO DEL METAVERSO EN FRANCIA POR TECNOLOGÍA
    158. FIGURA 26. ANÁLISIS DEL MERCADO DEL METAVERSO EN FRANCIA POR PLATAFORMA
    159. FIGURA 27. ANÁLISIS DEL MERCADO DEL METAVERSO EN FRANCIA POR TIPO DE CONSUMIDOR
    160. FIGURA 28. ANÁLISIS DEL MERCADO DEL METAVERSO EN FRANCIA POR REGIÓN
    161. FIGURA 29. ANÁLISIS DEL MERCADO DEL METAVERSO EN RUSIA POR APLICACIÓN
    162. FIGURA 30. ANÁLISIS DEL MERCADO DEL METAVERSO EN RUSIA POR TECNOLOGÍA
    163. FIGURA 31. ANÁLISIS DEL MERCADO DEL METAVERSO EN RUSIA POR PLATAFORMA
    164. FIGURA 32. ANÁLISIS DEL MERCADO DEL METAVERSO EN RUSIA POR TIPO DE CONSUMIDOR
    165. FIGURA 33. ANÁLISIS DEL MERCADO DEL METAVERSO EN RUSIA POR REGIÓN
    166. FIGURA 34. ANÁLISIS DEL MERCADO DEL METAVERSO EN ITALIA POR APLICACIÓN
    167. FIGURA 35. ANÁLISIS DEL MERCADO DEL METAVERSO EN ITALIA POR TECNOLOGÍA
    168. FIGURA 36. ANÁLISIS DEL MERCADO DEL METAVERSO EN ITALIA POR PLATAFORMA
    169. FIGURA 37. ANÁLISIS DEL MERCADO DEL METAVERSO EN ITALIA POR TIPO DE CONSUMIDOR
    170. FIGURA 38. ANÁLISIS DEL MERCADO DEL METAVERSO EN ITALIA POR REGIÓN
    171. FIGURA 39. ANÁLISIS DEL MERCADO DEL METAVERSO EN ESPAÑA POR APLICACIÓN
    172. FIGURA 40. ANÁLISIS DEL MERCADO DEL METAVERSO EN ESPAÑA POR TECNOLOGÍA
    173. FIGURA 41. ANÁLISIS DEL MERCADO DEL METAVERSO EN ESPAÑA POR PLATAFORMA
    174. FIGURA 42. ANÁLISIS DEL MERCADO DEL METAVERSO EN ESPAÑA POR TIPO DE CONSUMIDOR
    175. FIGURA 43. ANÁLISIS DEL MERCADO DEL METAVERSO EN ESPAÑA POR REGIÓN
    176. FIGURA 44. ANÁLISIS DEL MERCADO DEL METAVERSO EN EL RESTO DE EUROPA POR APLICACIÓN
    177. FIGURA 45. ANÁLISIS DEL MERCADO DEL METAVERSO EN EL RESTO DE EUROPA POR TECNOLOGÍA
    178. FIGURA 46. ANÁLISIS DEL MERCADO DEL METAVERSO EN EL RESTO DE EUROPA POR PLATAFORMA
    179. FIGURA 47. ANÁLISIS DEL MERCADO DEL METAVERSO EN EL RESTO DE EUROPA POR TIPO DE CONSUMIDOR
    180. FIGURA 48. ANÁLISIS DEL MERCADO DEL METAVERSO EN EL RESTO DE EUROPA POR REGIÓN
    181. FIGURA 49. ANÁLISIS DEL MERCADO DEL METAVERSO EN APAC
    182. FIGURA 50. ANÁLISIS DEL MERCADO DEL METAVERSO EN CHINA POR APLICACIÓN
    183. FIGURA 51. ANÁLISIS DEL MERCADO DEL METAVERSO EN CHINA POR TECNOLOGÍA
    184. FIGURA 52. ANÁLISIS DEL MERCADO DEL METAVERSO EN CHINA POR PLATAFORMA
    185. FIGURA 53. ANÁLISIS DEL MERCADO DEL METAVERSO EN CHINA POR TIPO DE CONSUMIDOR
    186. FIGURA 54. ANÁLISIS DEL MERCADO DEL METAVERSO EN CHINA POR REGIÓN
    187. FIGURA 55. ANÁLISIS DEL MERCADO DEL METAVERSO EN INDIA POR APLICACIÓN
    188. FIGURA 56. ANÁLISIS DEL MERCADO DEL METAVERSO EN INDIA POR TECNOLOGÍA
    189. FIGURA 57. ANÁLISIS DEL MERCADO DEL METAVERSO EN INDIA POR PLATAFORMA
    190. FIGURA 58. ANÁLISIS DEL MERCADO DEL METAVERSO EN INDIA POR TIPO DE CONSUMIDOR
    191. FIGURA 59. ANÁLISIS DEL MERCADO DEL METAVERSO EN INDIA POR REGIÓN
    192. FIGURA 60. ANÁLISIS DEL MERCADO DEL METAVERSO EN JAPÓN POR APLICACIÓN
    193. FIGURA 61. ANÁLISIS DEL MERCADO DEL METAVERSO EN JAPÓN POR TECNOLOGÍA
    194. FIGURA 62. ANÁLISIS DEL MERCADO DEL METAVERSO EN JAPÓN POR PLATAFORMA
    195. FIGURA 63. ANÁLISIS DEL MERCADO DEL METAVERSO EN JAPÓN POR TIPO DE CONSUMIDOR
    196. FIGURA 64. ANÁLISIS DEL MERCADO DEL METAVERSO EN JAPÓN POR REGIÓN
    197. FIGURA 65. ANÁLISIS DEL MERCADO DEL METAVERSO EN COREA DEL SUR POR APLICACIÓN
    198. FIGURA 66. ANÁLISIS DEL MERCADO DEL METAVERSO EN COREA DEL SUR POR TECNOLOGÍA
    199. FIGURA 67. ANÁLISIS DEL MERCADO DEL METAVERSO EN COREA DEL SUR POR PLATAFORMA
    200. FIGURA 68. ANÁLISIS DEL MERCADO DEL METAVERSO EN COREA DEL SUR POR TIPO DE CONSUMIDOR
    201. FIGURA 69. ANÁLISIS DEL MERCADO DEL METAVERSO EN COREA DEL SUR POR REGIÓN
    202. FIGURA 70. ANÁLISIS DEL MERCADO DEL METAVERSO EN MALASIA POR APLICACIÓN
    203. FIGURA 71. ANÁLISIS DEL MERCADO DEL METAVERSO EN MALASIA POR TECNOLOGÍA
    204. FIGURA 72. ANÁLISIS DEL MERCADO DEL METAVERSO EN MALASIA POR PLATAFORMA
    205. FIGURA 73. ANÁLISIS DEL MERCADO DEL METAVERSO EN MALASIA POR TIPO DE CONSUMIDOR
    206. FIGURA 74. ANÁLISIS DEL MERCADO DEL METAVERSO EN MALASIA POR REGIÓN
    207. FIGURA 75. ANÁLISIS DEL MERCADO DEL METAVERSO EN TAILANDIA POR APLICACIÓN
    208. FIGURA 76. ANÁLISIS DEL MERCADO DEL METAVERSO EN TAILANDIA POR TECNOLOGÍA
    209. FIGURA 77. ANÁLISIS DEL MERCADO DEL METAVERSO EN TAILANDIA POR PLATAFORMA
    210. FIGURA 78. ANÁLISIS DEL MERCADO DEL METAVERSO EN TAILANDIA POR TIPO DE CONSUMIDOR
    211. FIGURA 79. ANÁLISIS DEL MERCADO DEL METAVERSO EN TAILANDIA POR REGIÓN
    212. FIGURA 80. ANÁLISIS DEL MERCADO DEL METAVERSO EN INDONESIA POR APLICACIÓN
    213. FIGURA 81. ANÁLISIS DEL MERCADO DEL METAVERSO EN INDONESIA POR TECNOLOGÍA
    214. FIGURA 82. ANÁLISIS DEL MERCADO DEL METAVERSO EN INDONESIA POR PLATAFORMA
    215. FIGURA 83. ANÁLISIS DEL MERCADO DEL METAVERSO EN INDONESIA POR TIPO DE CONSUMIDOR
    216. FIGURA 84. ANÁLISIS DEL MERCADO DEL METAVERSO EN INDONESIA POR REGIÓN
    217. FIGURA 85. ANÁLISIS DEL MERCADO DEL METAVERSO EN EL RESTO DE APAC POR APLICACIÓN
    218. FIGURA 86. ANÁLISIS DEL MERCADO DEL METAVERSO EN EL RESTO DE APAC POR TECNOLOGÍA
    219. FIGURA 87. ANÁLISIS DEL MERCADO DEL METAVERSO EN EL RESTO DE APAC POR PLATAFORMA
    220. FIGURA 88. ANÁLISIS DEL MERCADO DEL METAVERSO EN EL RESTO DE APAC POR TIPO DE CONSUMIDOR
    221. FIGURA 89. ANÁLISIS DEL MERCADO DEL METAVERSO EN EL RESTO DE APAC POR REGIÓN
    222. FIGURA 90. ANÁLISIS DEL MERCADO DEL METAVERSO EN AMÉRICA DEL SUR
    223. FIGURA 91. ANÁLISIS DEL MERCADO DEL METAVERSO EN BRASIL POR APLICACIÓN
    224. FIGURA 92. ANÁLISIS DEL MERCADO DEL METAVERSO EN BRASIL POR TECNOLOGÍA
    225. FIGURA 93. ANÁLISIS DEL MERCADO DEL METAVERSO EN BRASIL POR PLATAFORMA
    226. FIGURA 94. ANÁLISIS DEL MERCADO DEL METAVERSO EN BRASIL POR TIPO DE CONSUMIDOR
    227. FIGURA 95. ANÁLISIS DEL MERCADO DEL METAVERSO EN BRASIL POR REGIÓN
    228. FIGURA 96. ANÁLISIS DEL MERCADO DEL METAVERSO EN MÉXICO POR APLICACIÓN
    229. FIGURA 97. ANÁLISIS DEL MERCADO DEL METAVERSO EN MÉXICO POR TECNOLOGÍA
    230. FIGURA 98. ANÁLISIS DEL MERCADO DEL METAVERSO EN MÉXICO POR PLATAFORMA
    231. FIGURA 99. ANÁLISIS DEL MERCADO DEL METAVERSO EN MÉXICO POR TIPO DE CONSUMIDOR
    232. FIGURA 100. ANÁLISIS DEL MERCADO DEL METAVERSO EN MÉXICO POR REGIÓN
    233. FIGURA 101. ANÁLISIS DEL MERCADO DEL METAVERSO EN ARGENTINA POR APLICACIÓN
    234. FIGURA 102. ANÁLISIS DEL MERCADO DEL METAVERSO EN ARGENTINA POR TECNOLOGÍA
    235. FIGURA 103. ANÁLISIS DEL MERCADO DEL METAVERSO EN ARGENTINA POR PLATAFORMA
    236. FIGURA 104. ANÁLISIS DEL MERCADO DEL METAVERSO EN ARGENTINA POR TIPO DE CONSUMIDOR
    237. FIGURA 105. ANÁLISIS DEL MERCADO DEL METAVERSO EN ARGENTINA POR REGIÓN
    238. FIGURA 106. ANÁLISIS DEL MERCADO DEL METAVERSO EN EL RESTO DE AMÉRICA DEL SUR POR APLICACIÓN
    239. FIGURA 107. ANÁLISIS DEL MERCADO DEL METAVERSO EN EL RESTO DE AMÉRICA DEL SUR POR TECNOLOGÍA
    240. FIGURA 108. ANÁLISIS DEL MERCADO DEL METAVERSO EN EL RESTO DE AMÉRICA DEL SUR POR PLATAFORMA
    241. FIGURA 109. ANÁLISIS DEL MERCADO DEL METAVERSO EN EL RESTO DE AMÉRICA DEL SUR POR TIPO DE CONSUMIDOR
    242. FIGURA 110. ANÁLISIS DEL MERCADO DEL METAVERSO EN EL RESTO DE AMÉRICA DEL SUR POR REGIÓN
    243. FIGURA 111. ANÁLISIS DEL MERCADO DEL METAVERSO EN MEA
    244. FIGURA 112. ANÁLISIS DEL MERCADO DEL METAVERSO EN PAÍSES DEL CCG POR APLICACIÓN
    245. FIGURA 113. ANÁLISIS DEL MERCADO DEL METAVERSO EN PAÍSES DEL CCG POR TECNOLOGÍA
    246. FIGURA 114. ANÁLISIS DEL MERCADO DEL METAVERSO EN PAÍSES DEL CCG POR PLATAFORMA
    247. FIGURA 115. ANÁLISIS DEL MERCADO DEL METAVERSO EN PAÍSES DEL CCG POR TIPO DE CONSUMIDOR
    248. FIGURA 116. ANÁLISIS DEL MERCADO DEL METAVERSO EN PAÍSES DEL CCG POR REGIÓN
    249. FIGURA 117. ANÁLISIS DEL MERCADO DEL METAVERSO EN SUDÁFRICA POR APLICACIÓN
    250. FIGURA 118. ANÁLISIS DEL MERCADO DEL METAVERSO EN SUDÁFRICA POR TECNOLOGÍA
    251. FIGURA 119. ANÁLISIS DEL MERCADO DEL METAVERSO EN SUDÁFRICA POR PLATAFORMA
    252. FIGURA 120. ANÁLISIS DEL MERCADO DEL METAVERSO EN SUDÁFRICA POR TIPO DE CONSUMIDOR
    253. FIGURA 121. ANÁLISIS DEL MERCADO DEL METAVERSO EN SUDÁFRICA POR REGIÓN
    254. FIGURA 122. ANÁLISIS DEL MERCADO DEL METAVERSO EN EL RESTO DE MEA POR APLICACIÓN
    255. FIGURA 123. ANÁLISIS DEL MERCADO DEL METAVERSO EN EL RESTO DE MEA POR TECNOLOGÍA
    256. FIGURA 124. ANÁLISIS DEL MERCADO DEL METAVERSO EN EL RESTO DE MEA POR PLATAFORMA
    257. FIGURA 125. ANÁLISIS DEL MERCADO DEL METAVERSO EN EL RESTO DE MEA POR TIPO DE CONSUMIDOR
    258. FIGURA 126. ANÁLISIS DEL MERCADO DEL METAVERSO EN EL RESTO DE MEA POR REGIÓN
    259. FIGURA 127. CRITERIOS CLAVE DE COMPRA DEL METAVERSO EN EL MERCADO DE COMERCIO ELECTRÓNICO
    260. FIGURA 128. PROCESO DE INVESTIGACIÓN DE MRFR
    261. FIGURA 129. ANÁLISIS DRO DEL METAVERSO EN EL MERCADO DE COMERCIO ELECTRÓNICO
    262. FIGURA 130. ANÁLISIS DEL IMPACTO DE LOS IMPULSORES: METAVERSO EN EL MERCADO DE COMERCIO ELECTRÓNICO
    263. FIGURA 131. ANÁLISIS DEL IMPACTO DE LAS RESTRICCIONES: METAVERSO EN EL MERCADO DE COMERCIO ELECTRÓNICO
    264. FIGURA 132. CADENA DE SUMINISTRO / VALOR: METAVERSO EN EL MERCADO DE COMERCIO ELECTRÓNICO
    265. FIGURA 133. METAVERSO EN EL MERCADO DE COMERCIO ELECTRÓNICO, POR APLICACIÓN, 2024 (% DE PARTICIPACIÓN)
    266. FIGURA 134. METAVERSO EN EL MERCADO DE COMERCIO ELECTRÓNICO, POR APLICACIÓN, 2019 A 2032 (USD Mil millones)
    267. FIGURA 135. METAVERSO EN EL MERCADO DE COMERCIO ELECTRÓNICO, POR TECNOLOGÍA, 2024 (% DE PARTICIPACIÓN)
    268. FIGURA 136. METAVERSO EN EL MERCADO DE COMERCIO ELECTRÓNICO, POR TECNOLOGÍA, 2019 A 2032 (USD Mil millones)
    269. FIGURA 137. METAVERSO EN EL MERCADO DE COMERCIO ELECTRÓNICO, POR PLATAFORMA, 2024 (% DE PARTICIPACIÓN)
    270. FIGURA 138. METAVERSO EN EL MERCADO DE COMERCIO ELECTRÓNICO, POR PLATAFORMA, 2019 A 2032 (USD Mil millones)
    271. FIGURA 139. METAVERSO EN EL MERCADO DE COMERCIO ELECTRÓNICO, POR TIPO DE CONSUMIDOR, 2024 (% DE PARTICIPACIÓN)
    272. FIGURA 140. METAVERSO EN EL MERCADO DE COMERCIO ELECTRÓNICO, POR TIPO DE CONSUMIDOR, 2019 A 2032 (USD Mil millones)
    273. FIGURA 141. METAVERSO EN EL MERCADO DE COMERCIO ELECTRÓNICO, POR REGIÓN, 2024 (% DE PARTICIPACIÓN)
    274. FIGURA 142. METAVERSO EN EL MERCADO DE COMERCIO ELECTRÓNICO, POR REGIÓN, 2019 A 2032 (USD Mil millones)
    275. FIGURA 143. COMPARATIVA DE LOS PRINCIPALES COMPETIDORES.

Metaverso en la Segmentación del Mercado de Comercio Electrónico

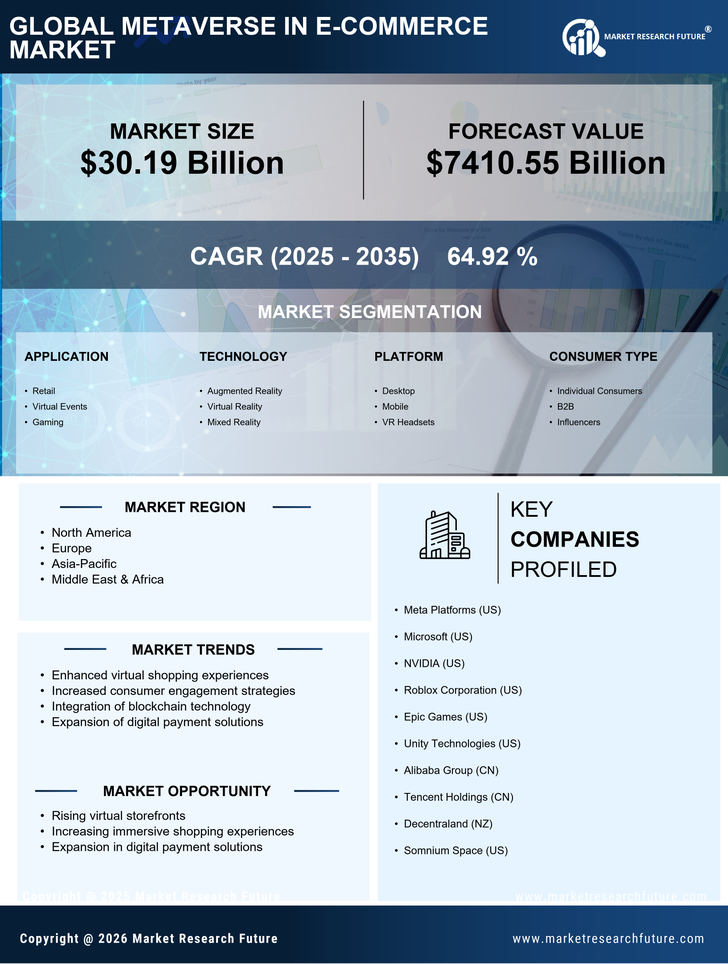
  • Mercado del Metaverso en Comercio Electrónico por Aplicación (USD Mil millones, 2019-2032)
    • Retail
    • Eventos Virtuales
    • Juegos

  • Mercado del Metaverso en Comercio Electrónico por Tecnología (USD Mil millones, 2019-2032)
    • Realidad Aumentada
    • Realidad Virtual
    • Realidad Mixta

  • Mercado del Metaverso en Comercio Electrónico por Plataforma (USD Mil millones, 2019-2032)
    • Escritorio
    • Móvil
    • Gafas de VR

  • Mercado del Metaverso en Comercio Electrónico por Tipo de Consumidor (USD Mil millones, 2019-2032)
    • Consumidores Individuales
    • B2B
    • Influencers

  • Mercado del Metaverso en Comercio Electrónico por Región (USD Mil millones, 2019-2032)
    • América del Norte
    • Europa
    • América del Sur
    • Asia-Pacífico
    • Medio Oriente y África

Perspectiva Regional del Mercado del Metaverso en Comercio Electrónico (USD Mil millones, 2019-2032)

  • Perspectiva de América del Norte (USD Mil millones, 2019-2032)
    • Mercado del Metaverso en Comercio Electrónico de América del Norte por Tipo de Aplicación
      • Retail
      • Eventos Virtuales
      • Juegos
    • Mercado del Metaverso en Comercio Electrónico de América del Norte por Tipo de Tecnología
      • Realidad Aumentada
      • Realidad Virtual
      • Realidad Mixta
    • Mercado del Metaverso en Comercio Electrónico de América del Norte por Tipo de Plataforma
      • Escritorio
      • Móvil
      • Gafas de VR
    • Mercado del Metaverso en Comercio Electrónico de América del Norte por Tipo de Consumidor
      • Consumidores Individuales
      • B2B
      • Influencers
    • Mercado del Metaverso en Comercio Electrónico de América del Norte por Tipo Regional
      • EE. UU.
      • Canadá
    • Perspectiva de EE. UU. (USD Mil millones, 2019-2032)
    • Mercado del Metaverso en Comercio Electrónico de EE. UU. por Tipo de Aplicación
      • Retail
      • Eventos Virtuales
      • Juegos
    • Mercado del Metaverso en Comercio Electrónico de EE. UU. por Tipo de Tecnología
      • Realidad Aumentada
      • Realidad Virtual
      • Realidad Mixta
    • Mercado del Metaverso en Comercio Electrónico de EE. UU. por Tipo de Plataforma
      • Escritorio
      • Móvil
      • Gafas de VR
    • Mercado del Metaverso en Comercio Electrónico de EE. UU. por Tipo de Consumidor
      • Consumidores Individuales
      • B2B
      • Influencers
    • Perspectiva de CANADÁ (USD Mil millones, 2019-2032)
    • Mercado del Metaverso en Comercio Electrónico de CANADÁ por Tipo de Aplicación
      • Retail
      • Eventos Virtuales
      • Juegos
    • Mercado del Metaverso en Comercio Electrónico de CANADÁ por Tipo de Tecnología
      • Realidad Aumentada
      • Realidad Virtual
      • Realidad Mixta
    • Mercado del Metaverso en Comercio Electrónico de CANADÁ por Tipo de Plataforma
      • Escritorio
      • Móvil
      • Gafas de VR
    • Mercado del Metaverso en Comercio Electrónico de CANADÁ por Tipo de Consumidor
      • Consumidores Individuales
      • B2B
      • Influencers
    • Perspectiva de Europa (USD Mil millones, 2019-2032)
      • Mercado del Metaverso en Comercio Electrónico de Europa por Tipo de Aplicación
        • Retail
        • Eventos Virtuales
        • Juegos
      • Mercado del Metaverso en Comercio Electrónico de Europa por Tipo de Tecnología
        • Realidad Aumentada
        • Realidad Virtual
        • Realidad Mixta
      • Mercado del Metaverso en Comercio Electrónico de Europa por Tipo de Plataforma
        • Escritorio
        • Móvil
        • Gafas de VR
      • Mercado del Metaverso en Comercio Electrónico de Europa por Tipo de Consumidor
        • Consumidores Individuales
        • B2B
        • Influencers
      • Mercado del Metaverso en Comercio Electrónico de Europa por Tipo Regional
        • Alemania
        • Reino Unido
        • Francia
        • Rusia
        • Italia
        • España
        • Resto de Europa
      • Perspectiva de ALEMANIA (USD Mil millones, 2019-2032)
      • Mercado del Metaverso en Comercio Electrónico de ALEMANIA por Tipo de Aplicación
        • Retail
        • Eventos Virtuales
        • Juegos
      • Mercado del Metaverso en Comercio Electrónico de ALEMANIA por Tipo de Tecnología
        • Realidad Aumentada
        • Realidad Virtual
        • Realidad Mixta
      • Mercado del Metaverso en Comercio Electrónico de ALEMANIA por Tipo de Plataforma
        • Escritorio
        • Móvil
        • Gafas de VR
      • Mercado del Metaverso en Comercio Electrónico de ALEMANIA por Tipo de Consumidor
        • Consumidores Individuales
        • B2B
        • Influencers
      • Perspectiva del REINO UNIDO (USD Mil millones, 2019-2032)
      • Mercado del Metaverso en Comercio Electrónico del REINO UNIDO por Tipo de Aplicación
        • Retail
        • Eventos Virtuales
        • Juegos
      • Mercado del Metaverso en Comercio Electrónico del REINO UNIDO por Tipo de Tecnología
        • Realidad Aumentada
        • Realidad Virtual
        • Realidad Mixta
      • Mercado del Metaverso en Comercio Electrónico del REINO UNIDO por Tipo de Plataforma
        • Escritorio
        • Móvil
        • Gafas de VR
      • Mercado del Metaverso en Comercio Electrónico del REINO UNIDO por Tipo de Consumidor
        • Consumidores Individuales
        • B2B
        • Influencers
      • Perspectiva de FRANCIA (USD Mil millones, 2019-2032)
      • Mercado del Metaverso en Comercio Electrónico de FRANCIA por Tipo de Aplicación
        • Retail
        • Eventos Virtuales
        • Juegos
      • Mercado del Metaverso en Comercio Electrónico de FRANCIA por Tipo de Tecnología
        • Realidad Aumentada
        • Realidad Virtual
        • Realidad Mixta
      • Mercado del Metaverso en Comercio Electrónico de FRANCIA por Tipo de Plataforma
        • Escritorio
        • Móvil
        • Gafas de VR
      • Mercado del Metaverso en Comercio Electrónico de FRANCIA por Tipo de Consumidor
        • Consumidores Individuales
        • B2B
        • Influencers
      • Perspectiva de RUSIA (USD Mil millones, 2019-2032)
      • Mercado del Metaverso en Comercio Electrónico de RUSIA por Tipo de Aplicación
        • Retail
        • Eventos Virtuales
        • Juegos
      • Mercado del Metaverso en Comercio Electrónico de RUSIA por Tipo de Tecnología
        • Realidad Aumentada
        • Realidad Virtual
        • Realidad Mixta
      • Mercado del Metaverso en Comercio Electrónico de RUSIA por Tipo de Plataforma
        • Escritorio
        • Móvil
        • Gafas de VR
      • Mercado del Metaverso en Comercio Electrónico de RUSIA por Tipo de Consumidor
        • Consumidores Individuales
        • B2B
        • Influencers
      • Perspectiva de ITALIA (USD Mil millones, 2019-2032)
      • Mercado del Metaverso en Comercio Electrónico de ITALIA por Tipo de Aplicación
        • Retail
        • Eventos Virtuales
        • Juegos
      • Mercado del Metaverso en Comercio Electrónico de ITALIA por Tipo de Tecnología
        • Realidad Aumentada
        • Realidad Virtual
        • Realidad Mixta
      • Mercado del Metaverso en Comercio Electrónico de ITALIA por Tipo de Plataforma
        • Escritorio
        • Móvil
        • Gafas de VR
      • Mercado del Metaverso en Comercio Electrónico de ITALIA por Tipo de Consumidor
        • Consumidores Individuales
        • B2B
        • Influencers
      • Perspectiva de ESPAÑA (USD Mil millones, 2019-2032)
      • Mercado del Metaverso en Comercio Electrónico de ESPAÑA por Tipo de Aplicación
        • Retail
        • Eventos Virtuales
        • Juegos
      • Mercado del Metaverso en Comercio Electrónico de ESPAÑA por Tipo de Tecnología
        • Realidad Aumentada
        • Realidad Virtual
        • Realidad Mixta
      • Mercado del Metaverso en Comercio Electrónico de ESPAÑA por Tipo de Plataforma
        • Escritorio
        • Móvil
        • Gafas de VR
      • Mercado del Metaverso en Comercio Electrónico de ESPAÑA por Tipo de Consumidor
        • Consumidores Individuales
        • B2B
        • Influencers
      • Perspectiva del RESTO DE EUROPA (USD Mil millones, 2019-2032)
      • Mercado del Metaverso en Comercio Electrónico del RESTO DE EUROPA por Tipo de Aplicación
        • Retail
        • Eventos Virtuales
        • Juegos
      • Mercado del Metaverso en Comercio Electrónico del RESTO DE EUROPA por Tipo de Tecnología
        • Realidad Aumentada
        • Realidad Virtual
        • Realidad Mixta
      • Mercado del Metaverso en Comercio Electrónico del RESTO DE EUROPA por Tipo de Plataforma
        • Escritorio
        • Móvil
        • Gafas de VR
      • Mercado del Metaverso en Comercio Electrónico del RESTO DE EUROPA por Tipo de Consumidor
        • Consumidores Individuales
        • B2B
        • Influencers
      • Perspectiva de APAC (USD Mil millones, 2019-2032)
        • Mercado del Metaverso en Comercio Electrónico de APAC por Tipo de Aplicación
          • Retail
          • Eventos Virtuales
          • Juegos
        • Mercado del Metaverso en Comercio Electrónico de APAC por Tipo de Tecnología
          • Realidad Aumentada
          • Realidad Virtual
          • Realidad Mixta
        • Mercado del Metaverso en Comercio Electrónico de APAC por Tipo de Plataforma
          • Escritorio
          • Móvil
          • Gafas de VR
        • Mercado del Metaverso en Comercio Electrónico de APAC por Tipo de Consumidor
          • Consumidores Individuales
          • B2B
          • Influencers
        • Mercado del Metaverso en Comercio Electrónico de APAC por Tipo Regional
          • China
          • India
          • Japón
          • Corea del Sur
          • Malasia
          • Tailandia
          • Indonesia
          • Resto de APAC
        • Perspectiva de CHINA (USD Mil millones, 2019-2032)
        • Mercado del Metaverso en Comercio Electrónico de CHINA por Tipo de Aplicación
          • Retail
          • Eventos Virtuales
          • Juegos
        • Mercado del Metaverso en Comercio Electrónico de CHINA por Tipo de Tecnología
          • Realidad Aumentada
          • Realidad Virtual
          • Realidad Mixta
        • Mercado del Metaverso en Comercio Electrónico de CHINA por Tipo de Plataforma
          • Escritorio
          • Móvil
          • Gafas de VR
        • Mercado del Metaverso en Comercio Electrónico de CHINA por Tipo de Consumidor
          • Consumidores Individuales
          • B2B
          • Influencers
        • Perspectiva de INDIA (USD Mil millones, 2019-2032)
        • Mercado del Metaverso en Comercio Electrónico de INDIA por Tipo de Aplicación
          • Retail
          • Eventos Virtuales
          • Juegos
        • Mercado del Metaverso en Comercio Electrónico de INDIA por Tipo de Tecnología
          • Realidad Aumentada
          • Realidad Virtual
          • Realidad Mixta
        • Mercado del Metaverso en Comercio Electrónico de INDIA por Tipo de Plataforma
          • Escritorio
          • Móvil
          • Gafas de VR
        • Mercado del Metaverso en Comercio Electrónico de INDIA por Tipo de Consumidor
          • Consumidores Individuales
          • B2B
          • Influencers
        • Perspectiva de JAPÓN (USD Mil millones, 2019-2032)
        • Mercado del Metaverso en Comercio Electrónico de JAPÓN por Tipo de Aplicación
          • Retail
          • Eventos Virtuales
          • Juegos
        • Mercado del Metaverso en Comercio Electrónico de JAPÓN por Tipo de Tecnología
          • Realidad Aumentada
          • Realidad Virtual
          • Realidad Mixta
        • Mercado del Metaverso en Comercio Electrónico de JAPÓN por Tipo de Plataforma
          • Escritorio
          • Móvil
          • Gafas de VR
        • Mercado del Metaverso en Comercio Electrónico de JAPÓN por Tipo de Consumidor
          • Consumidores Individuales
          • B2B
          • Influencers
        • Perspectiva de COREA DEL SUR (USD Mil millones, 2019-2032)
        • Mercado del Metaverso en Comercio Electrónico de COREA DEL SUR por Tipo de Aplicación
          • Retail
          • Eventos Virtuales
          • Juegos
        • Mercado del Metaverso en Comercio Electrónico de COREA DEL SUR por Tipo de Tecnología
          • Realidad Aumentada
          • Realidad Virtual
          • Realidad Mixta
        • Mercado del Metaverso en Comercio Electrónico de COREA DEL SUR por Tipo de Plataforma
          • Escritorio
          • Móvil
          • Gafas de VR
        • Mercado del Metaverso en Comercio Electrónico de COREA DEL SUR por Tipo de Consumidor
          • Consumidores Individuales
          • B2B
          • Influencers
        • Perspectiva de MALASIA (USD Mil millones, 2019-2032)
        • Mercado del Metaverso en Comercio Electrónico de MALASIA por Tipo de Aplicación
          • Retail
          • Eventos Virtuales
          • Juegos
        • Mercado del Metaverso en Comercio Electrónico de MALASIA por Tipo de Tecnología
          • Realidad Aumentada
          • Realidad Virtual
          • Realidad Mixta
        • Mercado del Metaverso en Comercio Electrónico de MALASIA por Tipo de Plataforma
          • Escritorio
          • Móvil
          • Gafas de VR
        • Mercado del Metaverso en Comercio Electrónico de MALASIA por Tipo de Consumidor
          • Consumidores Individuales
          • B2B
          • Influencers
        • Perspectiva de TAILANDIA (USD Mil millones, 2019-2032)
        • Mercado del Metaverso en Comercio Electrónico de TAILANDIA por Tipo de Aplicación
          • Retail
          • Eventos Virtuales
          • Juegos
        • Mercado del Metaverso en Comercio Electrónico de TAILANDIA por Tipo de Tecnología
          • Realidad Aumentada
          • Realidad Virtual
          • Realidad Mixta
        • Mercado del Metaverso en Comercio Electrónico de TAILANDIA por Tipo de Plataforma
          • Escritorio
          • Móvil
          • Gafas de VR
        • Mercado del Metaverso en Comercio Electrónico de TAILANDIA por Tipo de Consumidor
          • Consumidores Individuales
          • B2B
          • Influencers
        • Perspectiva de INDONESIA (USD Mil millones, 2019-2032)
        • Mercado del Metaverso en Comercio Electrónico de INDONESIA por Tipo de Aplicación
          • Retail
          • Eventos Virtuales
          • Juegos
        • Mercado del Metaverso en Comercio Electrónico de INDONESIA por Tipo de Tecnología
          • Realidad Aumentada
          • Realidad Virtual
          • Realidad Mixta
        • Mercado del Metaverso en Comercio Electrónico de INDONESIA por Tipo de Plataforma
          • Escritorio
          • Móvil
          • Gafas de VR
        • Mercado del Metaverso en Comercio Electrónico de INDONESIA por Tipo de Consumidor
          • Consumidores Individuales
          • B2B
          • Influencers
        • Perspectiva del RESTO DE APAC (USD Mil millones, 2019-2032)
        • Mercado del Metaverso en Comercio Electrónico del RESTO DE APAC por Tipo de Aplicación
          • Retail
          • Eventos Virtuales
          • Juegos
        • Mercado del Metaverso en Comercio Electrónico del RESTO DE APAC por Tipo de Tecnología
          • Realidad Aumentada
          • Realidad Virtual
          • Realidad Mixta
        • Mercado del Metaverso en Comercio Electrónico del RESTO DE APAC por Tipo de Plataforma
          • Escritorio
          • Móvil
          • Gafas de VR
        • Mercado del Metaverso en Comercio Electrónico del RESTO DE APAC por Tipo de Consumidor
          • Consumidores Individuales
          • B2B
          • Influencers
        • Perspectiva de América del Sur (USD Mil millones, 2019-2032)
          • Mercado del Metaverso en Comercio Electrónico de América del Sur por Tipo de Aplicación
            • Retail
            • Eventos Virtuales
            • Juegos
          • Mercado del Metaverso en Comercio Electrónico de América del Sur por Tipo de Tecnología
            • Realidad Aumentada
            • Realidad Virtual
            • Realidad Mixta
          • Mercado del Metaverso en Comercio Electrónico de América del Sur por Tipo de Plataforma
            • Escritorio
            • Móvil
            • Gafas de VR
          • Mercado del Metaverso en Comercio Electrónico de América del Sur por Tipo de Consumidor
            • Consumidores Individuales
            • B2B
            • Influencers
          • Mercado del Metaverso en Comercio Electrónico de América del Sur por Tipo Regional
            • Brasil
            • México
            • Argentina
            • Resto de América del Sur
          • Perspectiva de BRASIL (USD Mil millones, 2019-2032)
          • Mercado del Metaverso en Comercio Electrónico de BRASIL por Tipo de Aplicación
            • Retail
            • Eventos Virtuales
            • Juegos
          • Mercado del Metaverso en Comercio Electrónico de BRASIL por Tipo de Tecnología
            • Realidad Aumentada
            • Realidad Virtual
            • Realidad Mixta
          • Mercado del Metaverso en Comercio Electrónico de BRASIL por Tipo de Plataforma
            • Escritorio
            • Móvil
            • Gafas de VR
          • Mercado del Metaverso en Comercio Electrónico de BRASIL por Tipo de Consumidor
            • Consumidores Individuales
            • B2B
            • Influencers
          • Perspectiva de MÉXICO (USD Mil millones, 2019-2032)
          • Mercado del Metaverso en Comercio Electrónico de MÉXICO por Tipo de Aplicación
            • Retail
            • Eventos Virtuales
            • Juegos
          • Mercado del Metaverso en Comercio Electrónico de MÉXICO por Tipo de Tecnología
            • Realidad Aumentada
            • Realidad Virtual
            • Realidad Mixta
          • Mercado del Metaverso en Comercio Electrónico de MÉXICO por Tipo de Plataforma
            • Escritorio
            • Móvil
            • Gafas de VR
          • Mercado del Metaverso en Comercio Electrónico de MÉXICO por Tipo de Consumidor
            • Consumidores Individuales
            • B2B
            • Influencers
          • Perspectiva de ARGENTINA (USD Mil millones, 2019-2032)
          • Mercado del Metaverso en Comercio Electrónico de ARGENTINA por Tipo de Aplicación
            • Retail
            • Eventos Virtuales
            • Juegos
          • Mercado del Metaverso en Comercio Electrónico de ARGENTINA por Tipo de Tecnología
            • Realidad Aumentada
            • Realidad Virtual
            • Realidad Mixta
          • Mercado del Metaverso en Comercio Electrónico de ARGENTINA por Tipo de Plataforma
            • Escritorio
            • Móvil
            • Gafas de VR
          • Mercado del Metaverso en Comercio Electrónico de ARGENTINA por Tipo de Consumidor
            • Consumidores Individuales
            • B2B
            • Influencers
          • Perspectiva del RESTO DE AMÉRICA DEL SUR (USD Mil millones, 2019-2032)
          • Mercado del Metaverso en Comercio Electrónico del RESTO DE AMÉRICA DEL SUR por Tipo de Aplicación
            • Retail
            • Eventos Virtuales
            • Juegos
          • Mercado del Metaverso en Comercio Electrónico del RESTO DE AMÉRICA DEL SUR por Tipo de Tecnología
            • Realidad Aumentada
            • Realidad Virtual
            • Realidad Mixta
          • Mercado del Metaverso en Comercio Electrónico del RESTO DE AMÉRICA DEL SUR por Tipo de Plataforma
            • Escritorio
            • Móvil
            • Gafas de VR
          • Mercado del Metaverso en Comercio Electrónico del RESTO DE AMÉRICA DEL SUR por Tipo de Consumidor
            • Consumidores Individuales
            • B2B
            • Influencers
          • Perspectiva de MEA (USD Mil millones, 2019-2032)
            • Mercado del Metaverso en Comercio Electrónico de MEA por Tipo de Aplicación
              • Retail
              • Eventos Virtuales
              • Juegos
            • Mercado del Metaverso en Comercio Electrónico de MEA por Tipo de Tecnología
              • Realidad Aumentada
              • Realidad Virtual
              • Realidad Mixta
            • Mercado del Metaverso en Comercio Electrónico de MEA por Tipo de Plataforma
              • Escritorio
              • Móvil
              • Gafas de VR
            • Mercado del Metaverso en Comercio Electrónico de MEA por Tipo de Consumidor
              • Consumidores Individuales
              • B2B
              • Influencers
            • Mercado del Metaverso en Comercio Electrónico de MEA por Tipo Regional
              • Paises del CCG
              • Sudáfrica
              • Resto de MEA
            • Perspectiva de PAÍSES DEL CCG (USD Mil millones, 2019-2032)
            • Mercado del Metaverso en Comercio Electrónico de PAÍSES DEL CCG por Tipo de Aplicación
              • Retail
              • Eventos Virtuales
              • Juegos
            • Mercado del Metaverso en Comercio Electrónico de PAÍSES DEL CCG por Tipo de Tecnología
              • Realidad Aumentada
              • Realidad Virtual
              • Realidad Mixta
            • Mercado del Metaverso en Comercio Electrónico de PAÍSES DEL CCG por Tipo de Plataforma
              • Escritorio
              • Móvil
              • Gafas de VR
            • Mercado del Metaverso en Comercio Electrónico de PAÍSES DEL CCG por Tipo de Consumidor
              • Consumidores Individuales
              • B2B
              • Influencers
            • Perspectiva de SUDÁFRICA (USD Mil millones, 2019-2032)
            • Mercado del Metaverso en Comercio Electrónico de SUDÁFRICA por Tipo de Aplicación
              • Retail
              • Eventos Virtuales
              • Juegos
            • Mercado del Metaverso en Comercio Electrónico de SUDÁFRICA por Tipo de Tecnología
              • Realidad Aumentada
              • Realidad Virtual
              • Realidad Mixta
            • Mercado del Metaverso en Comercio Electrónico de SUDÁFRICA por Tipo de Plataforma
              • Escritorio
              • Móvil
              • Gafas de VR
            • Mercado del Metaverso en Comercio Electrónico de SUDÁFRICA por Tipo de Consumidor
              • Consumidores Individuales
              • B2B
              • Influencers
            • Perspectiva del RESTO DE MEA (USD Mil millones, 2019-2032)
            • Mercado del Metaverso en Comercio Electrónico del RESTO DE MEA por Tipo de Aplicación
              • Retail
              • Eventos Virtuales
              • Juegos
            • Mercado del Metaverso en Comercio Electrónico del RESTO DE MEA por Tipo de Tecnología
              • Realidad Aumentada
              • Realidad Virtual
              • Realidad Mixta
            • Mercado del Metaverso en Comercio Electrónico del RESTO DE MEA por Tipo de Plataforma
              • Escritorio
              • Móvil
              • Gafas de VR
            • Mercado del Metaverso en Comercio Electrónico del RESTO DE MEA por Tipo de Consumidor
              • Consumidores Individuales
              • B2B
              • Influencers

Compare Licence

×
Features License Type
Single User Multiuser License Enterprise User
Price $4,950 $5,950 $7,250
Maximum User Access Limit 1 User Upto 10 Users Unrestricted Access Throughout the Organization
Free Customization
Direct Access to Analyst
Deliverable Format
Platform Access
Discount on Next Purchase 10% 15% 15%
Printable Versions