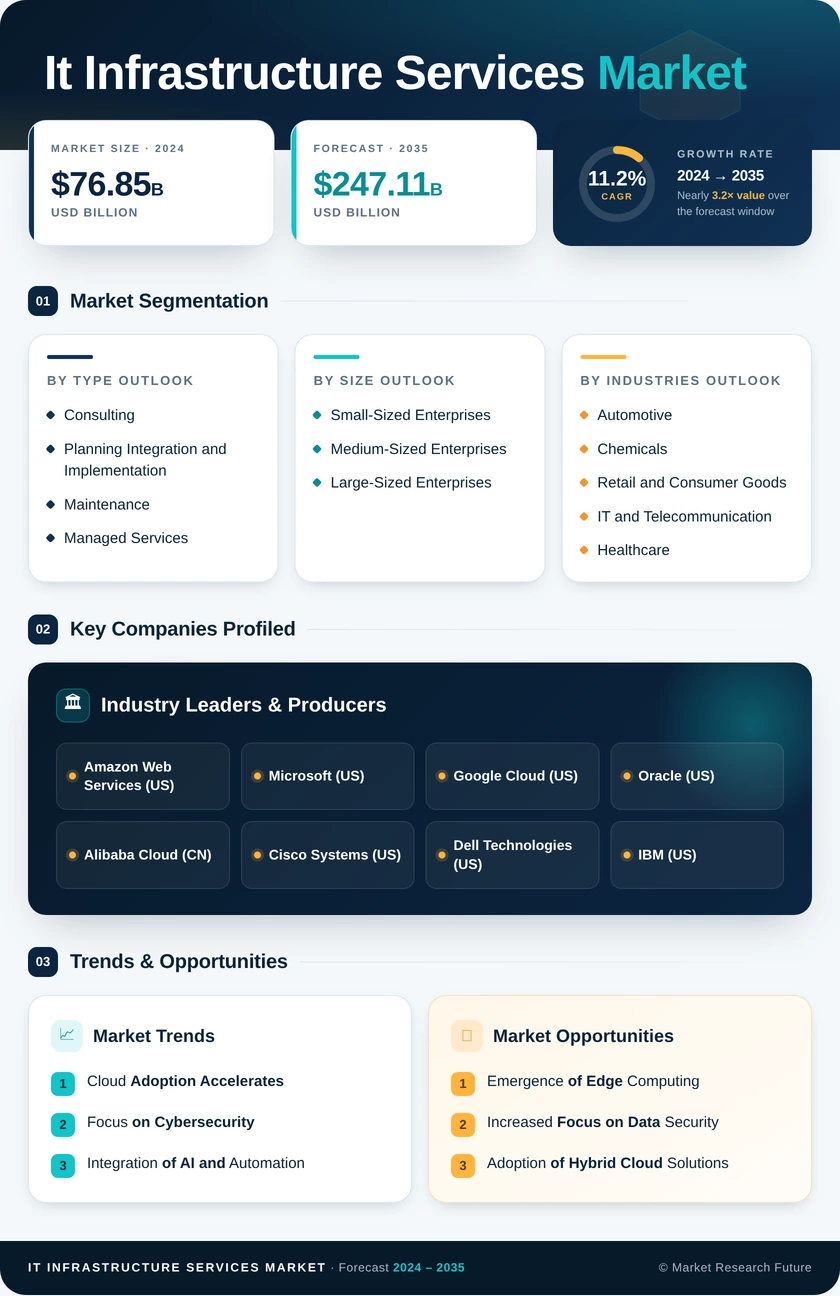
IT Infrastructure Services Market
- Cloud Adoption Accelerates
- Focus on Cybersecurity
- Integration of AI and Automation
- Emergence of Edge Computing
- Increased Focus on Data Security
- Adoption of Hybrid Cloud Solutions
-
1 RESUMEN EJECUTIVO
-
1.1 Análisis del atractivo del mercado
- 1.1.1 Mercado global de servicios de infraestructura de TI, por tipo
- 1.1.2 Mercado global de servicios de infraestructura de TI, por tipo de servicio
- 1.1.3 Mercado global de servicios de infraestructura de TI, por tamaño de organización
- 1.1.4 Mercado global de servicios de infraestructura de TI, por sector vertical
- 1.1.5 Mercado global de servicios de infraestructura de TI, por región
-
1.1 Análisis del atractivo del mercado
-
2 INTRODUCCIÓN DEL MERCADO
- 2.1 Definición
- 2.2 Alcance del estudio
- 2.3 Estructura del mercado
-
3 METODOLOGÍA DE LA INVESTIGACIÓN
- 3.1 Proceso de investigación
- 3.2 Investigación primaria
- 3.3 Investigación secundaria
- 3.4 Estimación del tamaño del mercado
- 3.5 Modelo de pronóstico
- 3.6 Lista de supuestos
-
4 DINÁMICA DEL MERCADO
- 4.1 Introducción
-
4.2 Impulsores
- 4.2.1 Crecientes beneficios de la Infraestructura como Servicio
- 4.2.2 Mayor necesidad de ahorro de costos y retorno de la inversión
-
4.3 Limitaciones
- 4.3.1 Preocupación por la pérdida de datos
-
4.4 Oportunidades
- 4.4.1 Aumento del número de PYMES para generar nuevas oportunidades de ingresos
-
4.5 Desafíos
- 4.5.1 Problemas de compatibilidad con sistemas heredados
-
5 ANÁLISIS DE FACTORES DE MERCADO
- 5.1 Análisis de la cadena de valor/análisis de la cadena de suministro
-
5.2 Modelo de las cinco fuerzas de Porter
- 5.2.1 Poder de negociación de los proveedores
- 5.2.2 Poder de negociación de los compradores
- 5.2.3 Amenaza de nuevos participantes
- 5.2.4 Amenaza de sustitutos
- 5.2.5 Intensidad de la rivalidad
-
6 MERCADO GLOBAL DE SERVICIOS DE INFRAESTRUCTURA DE TI, POR TIPO
- 6.1 Introducción
- 6.2 Servicio de gestión de redes
- 6.3 Gestión de sistemas empresariales
- 6.4 Gestión de la seguridad de TI
- 6.5 Soluciones de virtualización
- 6.6 Servicios de consolidación de centros de datos
- 6.7 Otros
-
7 MERCADO GLOBAL DE SERVICIOS DE INFRAESTRUCTURA DE TI, POR TIPO DE SERVICIO
- 7.1 Introducción
- 7.2 Consultoría
- 7.3 Planificación, integración e implementación
- 7.4 Mantenimiento
- 7.5 Gestionado
-
8 MERCADO GLOBAL DE SERVICIOS DE INFRAESTRUCTURA DE TI, POR TAMAÑO DE LA ORGANIZACIÓN
- 8.1 Introducción
- 8.2 Pequeñas y medianas empresas Mediana empresa
- 8.3 Gran empresa
-
9 MERCADO GLOBAL DE SERVICIOS DE INFRAESTRUCTURA DE TI, POR SECTOR VERTICAL
- 9.1 Introducción
- 9.2 Automotriz
- 9.3 Productos químicos
- 9.4 Comercio minorista y bienes de consumo
- 9.5 TI y telecomunicaciones
- 9.6 Salud
- 9.7 Gobierno
- 9.8 BFSI
- 9.9 Manufactura
- 9.10 Otros
-
10 MERCADO GLOBAL DE SERVICIOS DE INFRAESTRUCTURA DE TI, POR REGIÓN
- 10.1 Introducción
-
10.2 Norteamérica
- 10.2.1 EE. UU.
- 10.2.2 Canadá
- 10.2.3 México
-
10.3 Europa
- 10.3.1 Alemania
- 10.3.2 Francia
- 10.3.3 Reino Unido
- 10.3.4 Resto de Europa
-
10.4 Asia-Pacífico
- 10.4.1 China
- 10.4.2 India
- 10.4.3 Resto de Asia-Pacífico
- 10.5 Oriente Medio y África
- 10.6 Sudamérica
-
11 PANORAMA COMPETITIVO
- 11.1 Introducción
- 11.2 Análisis competitivo
-
12 PERFILES DE EMPRESAS
-
12.1 Clover Infotech Private Limited
- 12.1.1 Descripción general de la empresa
- 12.1.2 Panorama financiero
- 12.1.3 Productos ofrecidos
- 12.1.4 Desarrollos clave
- 12.1.5 Análisis FODA
- 12.1.6 Estrategias Clave
-
12.2 YASH Technologies
- 12.2.1 Descripción General de la Empresa
- 12.2.2 Panorama Financiero
- 12.2.3 Productos Ofrecidos
- 12.2.4 Desarrollos Clave
- 12.2.5 Análisis FODA
- 12.2.6 Estrategias Clave
-
12.3 Soluciones para PC
- 12.3.1 Descripción General de la Empresa
- 12.3.2 Panorama Financiero
- 12.3.3 Productos Ofrecidos
- 12.3.4 Desarrollos Clave
- 12.3.5 Análisis FODA
- 12.3.6 Estrategias Clave
-
12.4 IBM
- 12.4.1 Descripción General de la Empresa
- 12.4.2 Panorama Financiero
- 12.4.3 Productos Ofrecidos
- 12.4.4 Desarrollos Clave
- 12.4.5 Análisis FODA
- 12.4.6 Estrategias Clave
-
12.5 Fingent Corporation
- 12.5.1 Descripción General de la Empresa
- 12.5.2 Descripción Financiera
- 12.5.3 Productos Ofrecidos
- 12.5.4 Desarrollos Clave
- 12.5.5 Análisis FODA
- 12.5.6 Estrategias Clave
-
12.6 Tata Communications
- 12.6.1 Descripción General de la Empresa
- 12.6.2 Descripción Financiera
- 12.6.3 Productos Ofrecidos
- 12.6.4 Desarrollos Clave
- 12.6.5 Análisis FODA
- 12.6.6 Estrategias Clave
-
12.7 Netmagic Solutions
- 12.7.1 Descripción General de la Empresa
- 12.7.2 Resumen financiero
- 12.7.3 Productos ofrecidos
- 12.7.4 Desarrollos clave
- 12.7.5 Análisis FODA
- 12.7.6 Estrategias clave
-
12.8 Rave Technologies Pvt. Ltd
- 12.8.1 Resumen de la empresa
- 12.8.2 Resumen financiero
- 12.8.3 Productos ofrecidos
- 12.8.4 Desarrollos clave
- 12.8.5 Análisis FODA
- 12.8.6 Estrategias clave
-
12.9 FUJITSU
- 12.9.1 Resumen de la empresa
- 12.9.2 Resumen financiero
- 12.9.3 Productos ofrecidos
- 12.9.4 Desarrollos clave
- 12.9.5 Análisis FODA
- 12.9.6 Estrategias Clave
-
12.10 Amnet Technology Pte Ltd
- 12.10.1 Descripción General de la Empresa
- 12.10.2 Descripción Financiera
- 12.10.3 Productos Ofrecidos
- 12.10.4 Desarrollos Clave
- 12.10.5 Análisis FODA
- 12.10.6 Estrategias Clave
-
12.11 Synoptek, LLC.
- 12.11.1 Descripción General de la Empresa
- 12.11.2 Descripción Financiera
- 12.11.3 Productos Ofrecidos
- 12.11.4 Desarrollos Clave
- 12.11.5 Análisis FODA
- 12.11.6 Estrategias Clave
-
12.12 Vaysinfotech
- 12.12.1 Descripción General de la Empresa
- 12.12.2 Panorama financiero
- 12.12.3 Productos ofrecidos
- 12.12.4 Desarrollos clave
- 12.12.5 Análisis FODA
- 12.12.6 Estrategias clave
-
12.13 Cognizant
- 12.13.1 Panorama de la empresa
- 12.13.2 Panorama financiero
- 12.13.3 Productos ofrecidos
- 12.13.4 Desarrollos clave
- 12.13.5 Análisis FODA
- 12.13.6 Estrategias clave
-
12.14 Neusoft Corporation
- 12.14.1 Panorama de la empresa
- 12.14.2 Panorama financiero
- 12.14.3 Productos ofrecidos
- 12.14.4 Desarrollos clave
- 12.14.5 Análisis FODA
- 12.14.6 Estrategias Clave
-
12.15 Telent Technology Services Limited
- 12.15.1 Descripción General de la Empresa
- 12.15.2 Panorama Financiero
- 12.15.3 Productos Ofrecidos
- 12.15.4 Desarrollos Clave
- 12.15.5 Análisis FODA
- 12.15.6 Estrategias Clave
-
12.1 Clover Infotech Private Limited
-
13 APÉNDICE
- NOTA:
- Este índice es provisional y está sujeto a cambios a medida que avanza la investigación.
- En la sección 12, solo se presentarán las 15 empresas principales. Cada empresa será perfilada en función de los parámetros de descripción general del mercado, finanzas, cartera de productos, estrategias comerciales y desarrollos recientes.
- Tenga en cuenta: Los detalles financieros de la empresa no se pueden proporcionar si la información no está disponible en el dominio público o en fuentes confiables. LISTA DE TABLAS
- TABLA 1 LISTA DE SUPUESTOS
- TABLA 2 MERCADO GLOBAL DE SERVICIOS DE INFRAESTRUCTURA DE TI, POR TIPO, 2020-2027 (USD MILLONES)
- TABLA 3 MERCADO GLOBAL DE SERVICIOS DE INFRAESTRUCTURA DE TI, POR TIPO DE SERVICIO, 2020-2027 (USD MILLONES)
- TABLA 3 MERCADO GLOBAL DE SERVICIOS DE INFRAESTRUCTURA DE TI, POR TAMAÑO DE ORGANIZACIÓN, 2020-2027 (USD MILLONES)
- TABLA 4 MERCADO GLOBAL DE SERVICIOS DE INFRAESTRUCTURA DE TI, POR VERTICAL, 2020-2027 (USD MILLONES)
- TABLA 5 MERCADO GLOBAL DE SERVICIOS DE INFRAESTRUCTURA DE TI, POR REGIÓN, 2020-2027 (USD MILLONES)
- TABLA 6 AMÉRICA DEL NORTE: INFRAESTRUCTURA DE TI MERCADO DE SERVICIOS, POR PAÍS, 2020-2027 (USD MILLONES)
- TABLA 7 AMÉRICA DEL NORTE: MERCADO DE SERVICIOS DE INFRAESTRUCTURA DE TI, POR TIPO, 2020-2027 (USD MILLONES)
- TABLA 8 AMÉRICA DEL NORTE: MERCADO DE SERVICIOS DE INFRAESTRUCTURA DE TI, POR TIPO DE SERVICIO, 2020-2027 (USD MILLONES)
- TABLA 9 AMÉRICA DEL NORTE: MERCADO DE SERVICIOS DE INFRAESTRUCTURA DE TI, POR TAMAÑO DE ORGANIZACIÓN, 2020-2027 (USD MILLONES)
- TABLA 10 AMÉRICA DEL NORTE: MERCADO DE SERVICIOS DE INFRAESTRUCTURA DE TI, POR VERTICAL, 2020-2027 (USD MILLONES)
- TABLA 11 EE. UU.: MERCADO DE SERVICIOS DE INFRAESTRUCTURA DE TI, POR TIPO, 2020-2027 (USD MILLONES)
- TABLA 13 EE. UU.: MERCADO DE SERVICIOS DE INFRAESTRUCTURA DE TI, POR TIPO DE SERVICIO, 2020-2027 (MILLONES DE USD)
- TABLA 14 EE. UU.: MERCADO DE SERVICIOS DE INFRAESTRUCTURA DE TI, POR TAMAÑO DE ORGANIZACIÓN, 2020-2027 (MILLONES DE USD)
- TABLA 15 EE. UU.: MERCADO DE SERVICIOS DE INFRAESTRUCTURA DE TI, POR VERTICAL, 2020-2027 (MILLONES DE USD)
- TABLA 16 CANADÁ: MERCADO DE SERVICIOS DE INFRAESTRUCTURA DE TI, POR TIPO, 2020-2027 (MILLONES DE USD)
- TABLA 17 CANADÁ: MERCADO DE SERVICIOS DE INFRAESTRUCTURA DE TI, POR TIPO DE SERVICIO, 2020-2027 (MILLONES DE USD)
- TABLA 18 CANADÁ: MERCADO DE SERVICIOS DE INFRAESTRUCTURA DE TI, POR TAMAÑO DE ORGANIZACIÓN, 2020-2027 (USD MILLONES)
- TABLA 19 CANADÁ: MERCADO DE SERVICIOS DE INFRAESTRUCTURA DE TI, POR VERTICAL, 2020-2027 (USD MILLONES)
- TABLA 20 MÉXICO: MERCADO DE SERVICIOS DE INFRAESTRUCTURA DE TI, POR TIPO, 2020-2027 (USD MILLONES)
- TABLA 21 MERCADO GLOBAL DE SERVICIOS DE INFRAESTRUCTURA DE TI, POR TIPO DE SERVICIO, 2020-2027 (USD MILLONES)
- TABLA 22 MÉXICO: MERCADO DE SERVICIOS DE INFRAESTRUCTURA DE TI, POR TAMAÑO DE ORGANIZACIÓN, 2020-2027 (USD MILLONES)
- TABLA 23 MÉXICO: MERCADO DE SERVICIOS DE INFRAESTRUCTURA DE TI, POR VERTICAL, 2020-2027 (USD MILLONES)
- TABLA 24 EUROPA: MERCADO DE SERVICIOS DE INFRAESTRUCTURA DE TI, POR PAÍS, 2020-2027 (USD MILLONES)
- TABLA 25 EUROPA: MERCADO DE SERVICIOS DE INFRAESTRUCTURA DE TI, POR TIPO, 2020-2027 (USD MILLONES)
- TABLA 26 EUROPA: MERCADO DE SERVICIOS DE INFRAESTRUCTURA DE TI, POR TIPO DE SERVICIO, 2020-2027 (USD MILLONES)
- TABLA 27 EUROPA: MERCADO DE SERVICIOS DE INFRAESTRUCTURA DE TI, POR TAMAÑO DE ORGANIZACIÓN, 2020-2027 (USD MILLONES)
- TABLA 28 EUROPA: MERCADO DE SERVICIOS DE INFRAESTRUCTURA DE TI, POR VERTICAL, 2020-2027 (USD MILLONES)
- TABLA 29 REINO UNIDO: MERCADO DE SERVICIOS DE INFRAESTRUCTURA DE TI, POR TIPO, 2020-2027 (USD MILLONES)
- TABLA 30 REINO UNIDO: MERCADO DE SERVICIOS DE INFRAESTRUCTURA DE TI, POR TIPO DE SERVICIO, 2020-2027 (USD MILLONES)
- TABLA 31 REINO UNIDO: MERCADO DE SERVICIOS DE INFRAESTRUCTURA DE TI, POR TAMAÑO DE ORGANIZACIÓN, 2020-2027 (USD MILLONES)
- TABLA 32 REINO UNIDO: MERCADO DE SERVICIOS DE INFRAESTRUCTURA DE TI, POR VERTICAL, 2020-2027 (USD MILLONES)
- TABLA 33 ALEMANIA: MERCADO DE SERVICIOS DE INFRAESTRUCTURA DE TI, POR TIPO, 2020-2027 (USD MILLONES)
- TABLA 34 ALEMANIA: MERCADO DE SERVICIOS DE INFRAESTRUCTURA DE TI, POR TIPO DE SERVICIO, 2020-2027 (USD MILLONES)
- TABLA 35 ALEMANIA: MERCADO DE SERVICIOS DE INFRAESTRUCTURA DE TI, POR TAMAÑO DE ORGANIZACIÓN, 2020-2027 (USD MILLONES)
- TABLA 36 ALEMANIA: SERVICIOS DE INFRAESTRUCTURA DE TI MERCADO, POR VERTICAL, 2020-2027 (MILLONES DE USD)
- TABLA 37 FRANCIA: MERCADO DE SERVICIOS DE INFRAESTRUCTURA DE TI, POR TIPO, 2020-2027 (MILLONES DE USD)
- TABLA 38 FRANCIA: MERCADO DE SERVICIOS DE INFRAESTRUCTURA DE TI, POR TIPO DE SERVICIO, 2020-2027 (MILLONES DE USD)
- TABLA 39 FRANCIA: MERCADO DE SERVICIOS DE INFRAESTRUCTURA DE TI, POR TAMAÑO DE ORGANIZACIÓN, 2020-2027 (MILLONES DE USD)
- TABLA 40 FRANCIA: MERCADO DE SERVICIOS DE INFRAESTRUCTURA DE TI, POR VERTICAL, 2020-2027 (MILLONES DE USD)
- TABLA 41 RESTO DE EUROPA: MERCADO DE SERVICIOS DE INFRAESTRUCTURA DE TI, POR TIPO, 2020-2027 (MILLONES DE USD)
- TABLA 42 RESTO DE EUROPA: MERCADO DE SERVICIOS DE INFRAESTRUCTURA DE TI, POR TIPO DE SERVICIO, 2020-2027 (MILLONES DE USD)
- TABLA 43 RESTO DE EUROPA: MERCADO DE SERVICIOS DE INFRAESTRUCTURA DE TI, POR TAMAÑO DE ORGANIZACIÓN, 2020-2027 (MILLONES DE USD)
- TABLA 44 RESTO DE EUROPA: MERCADO DE SERVICIOS DE INFRAESTRUCTURA DE TI, POR VERTICAL, 2020-2027 (MILLONES DE USD)
- TABLA 45 ASIA-PACÍFICO: MERCADO DE SERVICIOS DE INFRAESTRUCTURA DE TI, POR PAÍS, 2020-2027 (MILLONES DE USD)
- TABLA 46 ASIA-PACÍFICO: MERCADO DE SERVICIOS DE INFRAESTRUCTURA DE TI, POR TIPO DE SERVICIO, 2020-2027 (MILLONES DE USD)
- TABLA 47 ASIA-PACÍFICO: MERCADO DE SERVICIOS DE INFRAESTRUCTURA DE TI, POR TIPO, 2020-2027 (USD MILLONES)
- TABLA 48 ASIA-PACÍFICO: MERCADO DE SERVICIOS DE INFRAESTRUCTURA DE TI, POR TAMAÑO DE ORGANIZACIÓN, 2020-2027 (USD MILLONES)
- TABLA 49 ASIA-PACÍFICO: MERCADO DE SERVICIOS DE INFRAESTRUCTURA DE TI, POR VERTICAL, 2020-2027 (USD MILLONES)
- TABLA 50 CHINA: MERCADO DE SERVICIOS DE INFRAESTRUCTURA DE TI, POR TIPO, 2020-2027 (USD MILLONES)
- TABLA 51 CHINA: MERCADO DE SERVICIOS DE INFRAESTRUCTURA DE TI, POR TIPO DE SERVICIO, 2020-2027 (USD MILLONES)
- TABLA 52 CHINA: MERCADO DE SERVICIOS DE INFRAESTRUCTURA DE TI, POR TAMAÑO DE ORGANIZACIÓN, 2020-2027 (USD MILLONES)
- TABLA 53 CHINA: TI MERCADO DE SERVICIOS DE INFRAESTRUCTURA, POR VERTICAL, 2020-2027 (USD MILLONES)
- TABLA 54 INDIA: MERCADO DE SERVICIOS DE INFRAESTRUCTURA DE TI, POR TIPO, 2020-2027 (USD MILLONES)
- TABLA 55 INDIA: MERCADO DE SERVICIOS DE INFRAESTRUCTURA DE TI, POR TIPO DE SERVICIO, 2020-2027 (USD MILLONES)
- TABLA 56 INDIA: MERCADO DE SERVICIOS DE INFRAESTRUCTURA DE TI, POR TAMAÑO DE ORGANIZACIÓN, 2020-2027 (USD MILLONES)
- TABLA 57 INDIA: MERCADO DE SERVICIOS DE INFRAESTRUCTURA DE TI, POR VERTICAL, 2020-2027 (USD MILLONES)
- TABLA 58 JAPÓN: MERCADO DE SERVICIOS DE INFRAESTRUCTURA DE TI, POR TIPO, 2020-2027 (USD MILLONES)
- TABLA 59 JAPÓN: MERCADO DE SERVICIOS DE INFRAESTRUCTURA DE TI, POR TIPO DE SERVICIO, 2020-2027 (MILLONES DE USD)
- TABLA 60: JAPÓN: MERCADO DE SERVICIOS DE INFRAESTRUCTURA DE TI, POR TAMAÑO DE ORGANIZACIÓN, 2020-2027 (MILLONES DE USD)
- TABLA 61: JAPÓN: MERCADO DE SERVICIOS DE INFRAESTRUCTURA DE TI, POR VERTICAL, 2020-2027 (MILLONES DE USD)
- TABLA 62: RESTO DE ASIA-PACÍFICO: MERCADO DE SERVICIOS DE INFRAESTRUCTURA DE TI, POR TIPO, 2020-2027 (MILLONES DE USD)
- TABLA 63: RESTO DE ASIA-PACÍFICO: MERCADO DE SERVICIOS DE INFRAESTRUCTURA DE TI, POR TIPO DE SERVICIO, 2020-2027 (MILLONES DE USD)
- TABLA 64: RESTO DE ASIA-PACÍFICO: MERCADO DE SERVICIOS DE INFRAESTRUCTURA DE TI, POR ORGANIZACIÓN TAMAÑO, 2020-2027 (USD MILLONES)
- TABLA 65: RESTO DE ASIA-PACÍFICO: MERCADO DE SERVICIOS DE INFRAESTRUCTURA DE TI, POR VERTICAL, 2020-2027 (USD MILLONES)
- TABLA 66: ORIENTE MEDIO Y ÁFRICA: MERCADO DE SERVICIOS DE INFRAESTRUCTURA DE TI, POR TIPO, 2020-2027 (USD MILLONES)
- TABLA 67: ORIENTE MEDIO Y ÁFRICA: MERCADO DE SERVICIOS DE INFRAESTRUCTURA DE TI, POR TIPO DE SERVICIO, 2020-2027 (USD MILLONES)
- TABLA 68: ORIENTE MEDIO Y ÁFRICA: MERCADO DE SERVICIOS DE INFRAESTRUCTURA DE TI, POR TAMAÑO DE ORGANIZACIÓN, 2020-2027 (USD MILLONES)
- TABLA 69: ORIENTE MEDIO Y ÁFRICA: MERCADO DE SERVICIOS DE INFRAESTRUCTURA DE TI, POR VERTICAL, 2020-2027 (USD MILLONES)
- TABLA 70: SUDAMÉRICA: MERCADO DE SERVICIOS DE INFRAESTRUCTURA DE TI, POR TIPO, 2020-2027 (USD MILLONES)
- TABLA 71: SUDAMÉRICA: MERCADO DE SERVICIOS DE INFRAESTRUCTURA DE TI, POR TIPO DE SERVICIO, 2020-2027 (USD MILLONES)
- TABLA 72: SUDAMÉRICA: MERCADO DE SERVICIOS DE INFRAESTRUCTURA DE TI, POR TAMAÑO DE ORGANIZACIÓN, 2020-2027 (USD MILLONES)
- TABLA 73: SUDAMÉRICA: MERCADO DE SERVICIOS DE INFRAESTRUCTURA DE TI, POR VERTICAL, 2020-2027 (USD MILLONES)
- ?
- LISTA DE FIGURAS
- FIGURA 1 SINOPSIS DEL MERCADO
- FIGURA 2 PROCESO DE INVESTIGACIÓN DE MRFR
- FIGURA 3 DE ARRIBA A ABAJO Y ENFOQUE DE ABAJO HACIA ARRIBA
- FIGURA 4 MERCADO GLOBAL DE SERVICIOS DE INFRAESTRUCTURA DE TI, POR TIPO, 2020-2027 (MILLONES DE USD)
- FIGURA 5 MERCADO GLOBAL DE SERVICIOS DE INFRAESTRUCTURA DE TI, POR TIPO DE SERVICIO, 2020-2027 (MILLONES DE USD)
- FIGURA 6 MERCADO GLOBAL DE SERVICIOS DE INFRAESTRUCTURA DE TI, POR TAMAÑO DE ORGANIZACIÓN, 2020-2027 (MILLONES DE USD)
- FIGURA 7 MERCADO GLOBAL DE SERVICIOS DE INFRAESTRUCTURA DE TI, POR VERTICAL, 2020-2027 (MILLONES DE USD)
- FIGURA 8 MERCADO GLOBAL DE SERVICIOS DE INFRAESTRUCTURA DE TI, POR REGIÓN, 2020-2027 (MILLONES DE USD)
- FIGURA 9 MERCADO GLOBAL DE SERVICIOS DE INFRAESTRUCTURA DE TI, POR REGIÓN, 2020-2027 (USD MILLONES)
- FIGURA 10 AMÉRICA DEL NORTE: MERCADO DE SERVICIOS DE INFRAESTRUCTURA DE TI, POR PAÍS, 2020-2027 (USD MILLONES)
- FIGURA 11 AMÉRICA DEL NORTE: MERCADO DE SERVICIOS DE INFRAESTRUCTURA DE TI, POR TIPO, 2020-2027 (USD MILLONES)
- FIGURA 12 AMÉRICA DEL NORTE: MERCADO DE SERVICIOS DE INFRAESTRUCTURA DE TI, POR TIPO, 2020-2027 (USD MILLONES)
- FIGURA 13 AMÉRICA DEL NORTE: MERCADO DE SERVICIOS DE INFRAESTRUCTURA DE TI, POR TAMAÑO DE ORGANIZACIÓN, 2020-2027 (USD MILLONES)
- FIGURA 14 AMÉRICA DEL NORTE: MERCADO DE SERVICIOS DE INFRAESTRUCTURA DE TI, POR VERTICAL, 2020-2027 (USD MILLONES)
- FIGURA 15 EUROPA: MERCADO DE SERVICIOS DE INFRAESTRUCTURA DE TI, POR PAÍS, 2020-2027 (USD MILLONES)
- FIGURA 16 EUROPA: MERCADO DE SERVICIOS DE INFRAESTRUCTURA DE TI, POR TIPO, 2020-2027 (USD MILLONES)
- FIGURA 17 EUROPA: MERCADO DE SERVICIOS DE INFRAESTRUCTURA DE TI, POR TIPO DE SERVICIO, 2020-2027 (USD MILLONES)
- FIGURA 18 EUROPA: MERCADO DE SERVICIOS DE INFRAESTRUCTURA DE TI, POR TAMAÑO DE ORGANIZACIÓN, 2020-2027 (USD MILLONES)
- FIGURA 19 EUROPA: MERCADO DE SERVICIOS DE INFRAESTRUCTURA DE TI, POR VERTICAL, 2020-2027 (USD MILLONES)
- FIGURA 20 ASIA-PACÍFICO: MERCADO DE SERVICIOS DE INFRAESTRUCTURA DE TI, POR PAÍS, 2020-2027 (MILLONES DE USD)
- FIGURA 21 ASIA-PACÍFICO: MERCADO DE SERVICIOS DE INFRAESTRUCTURA DE TI, POR TIPO, 2020-2027 (MILLONES DE USD)
- FIGURA 22 ASIA-PACÍFICO: MERCADO DE SERVICIOS DE INFRAESTRUCTURA DE TI, POR TIPO, 2020-2027 (MILLONES DE USD)
- FIGURA 23 ASIA-PACÍFICO: MERCADO DE SERVICIOS DE INFRAESTRUCTURA DE TI, POR TAMAÑO DE ORGANIZACIÓN, 2020-2027 (MILLONES DE USD)
- FIGURA 24 ASIA-PACÍFICO: MERCADO DE SERVICIOS DE INFRAESTRUCTURA DE TI, POR VERTICAL, 2020-2027 (MILLONES DE USD)
- FIGURA 25 ORIENTE MEDIO Y ÁFRICA: MERCADO DE SERVICIOS DE INFRAESTRUCTURA DE TI, POR TIPO, 2020-2027 (MILLONES DE USD)
- FIGURA 26 ORIENTE MEDIO Y ÁFRICA: MERCADO DE SERVICIOS DE INFRAESTRUCTURA DE TI, POR TIPO, 2020-2027 (MILLONES DE USD)
- FIGURA 27 ORIENTE MEDIO Y ÁFRICA: MERCADO DE SERVICIOS DE INFRAESTRUCTURA DE TI, POR TAMAÑO DE ORGANIZACIÓN, 2020-2027 (MILLONES DE USD)
- FIGURA 28 ORIENTE MEDIO Y ÁFRICA: MERCADO DE SERVICIOS DE INFRAESTRUCTURA DE TI, POR TAMAÑO DE ORGANIZACIÓN, 2020-2027 (MILLONES DE USD)
- FIGURA 29 ORIENTE MEDIO Y ÁFRICA: MERCADO DE SERVICIOS DE INFRAESTRUCTURA DE TI, POR TAMAÑO DE ORGANIZACIÓN, 2020-2027 (MILLONES DE USD)
- FIGURA 30 ORIENTE MEDIO Y ÁFRICA: MERCADO DE SERVICIOS DE INFRAESTRUCTURA DE TI, POR TAMAÑO DE ORGANIZACIÓN, 2020-2027 (MILLONES DE USD)
- FIGURA 31 ÁFRICA: MERCADO DE SERVICIOS DE INFRAESTRUCTURA DE TI, POR VERTICAL, 2020-2027 (MILLONES DE USD)
- FIGURA 29 SUDAMÉRICA: MERCADO DE SERVICIOS DE INFRAESTRUCTURA DE TI, POR TIPO, 2020-2027 (MILLONES DE USD)
- FIGURA 30 SUDAMÉRICA: MERCADO DE SERVICIOS DE INFRAESTRUCTURA DE TI, POR TIPO DE SERVICIO, 2020-2027 (MILLONES DE USD)
- FIGURA 31 SUDAMÉRICA: MERCADO DE SERVICIOS DE INFRAESTRUCTURA DE TI, POR TAMAÑO DE ORGANIZACIÓN, 2020-2027 (MILLONES DE USD)
- FIGURA 32 SUDAMÉRICA: MERCADO DE SERVICIOS DE INFRAESTRUCTURA DE TI, POR VERTICAL, 2020-2027 (MILLONES DE USD)
- 13.1.1 Plan de Discusión
Informes relacionados

Customer Stories

“This is really good guys. Excellent work on a tight deadline. I will continue to use you going forward and recommend you to others. Nice job”
 Noah Malgeri
Co-Founder

“Thanks for sending the report it gives us a good global view of the Betaïne market.”
 Peter Groot koerkamp
Account and Business Manager

“We found the report very insightful! we found your research firm very helpful. I'm sending this email to secure our future business.”
 Younghwan Choi
Senior Retail Manager

“I am very pleased with how market segments have been defined in a relevant way for my purposes (such as "Portable Freezers & refrigerators" and "last-mile"). In general the report is well structured. Thanks very much for your efforts.”
 Mark Irwin
Management Consultant

“We got the report in time, we really thank you for your support in this process. I also thank to all of your team as they did a great job.”
 Akif Moroglu
Strategy & Business Development Director

“The Automotive 48V ECU Components Procurement Intelligence Study” was a complex project, but the Market Research Future (MRFR) team handled it with quality, agility, and customer-centricity. They delivered all requested data on time and within the agreed scope. The team, including Shubhendra Anand and Rahul Gotadki, was always readily available to clarify questions and swiftly implement necessary adjustments, driving the project to a successful conclusion within a very demanding timeframe.
I would also like to specifically commend Akshay Agarwal for his responsiveness and support at every stage—from our initial inquiry on May 6th through to final delivery on June 18th. His dedication made the entire process seamless.”
 Guilherme Gomes Martins
Product Management Director

“Thanks. It’s been a pleasure working with you, please use me as reference with any other Intel employees.”
 Joseph Aguayo
Sales Operations & Pricing Manager

“Thank you, this will be very helpful for OQS.”
 La Terria Dodd
Program Support Specialist

“I have been reading the first document or the study, ,the Global HVAC and FP market report 2021 till 2026. Must say, good info! I have not gone in depth at all parts, but got a good indication of the data inside!”
 Rob Kooiker
Group Product Manager HVAC & Fire Protection GMA