
Industrial Design Market
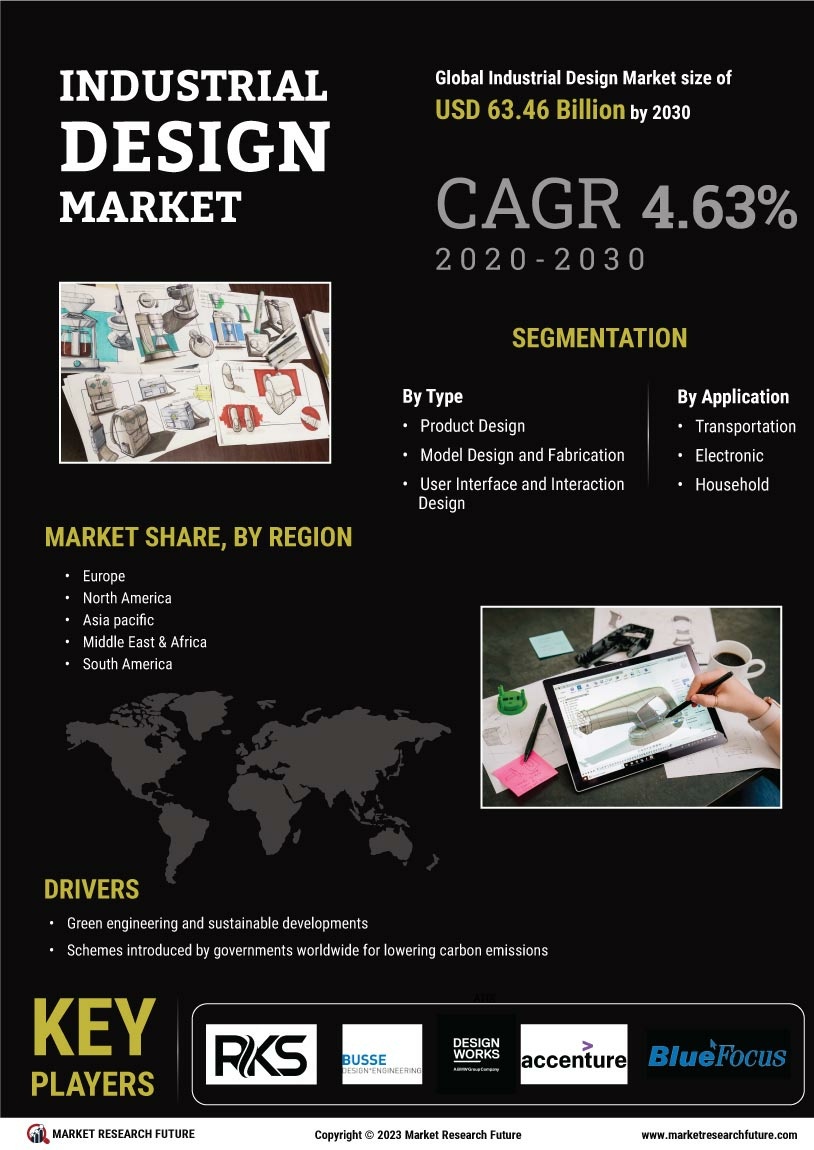
Informe de investigación de mercado de diseño industrial: información por tipo (diseño de producto, diseño y fabricación de modelos, diseño de interfaz de usuario e interacción, otros diseños industriales) y por aplicación (transporte, electrónica, hogar, maquinaria y equipo, otros): pronóstico hasta 2032

- 1 Resumen ejecutivo
-
2 Introducción al mercado
- 2.1 Definición 14
- 2.2 Alcance del estudio 14
- 2.3 Lista de supuestos 15
- 2.4 Estructura del mercado 15
- 3 Perspectivas del mercado
-
4 Metodología de investigación
- 4.1 Proceso de investigación 19
- 4.2 Modelo de pronóstico 23
-
5 Tendencias del mercado
-
5.1 Introducción 25
- 5.1.1 Ingeniería verde: enfoque en el consumo de energía 25
- 5.1.2 Aumento de la infraestructura y la nube IoT 25
-
5.1 Introducción 25
-
6 Análisis de factores de mercado
- 6.1 Análisis de la cadena de valor 27
-
6.2 Modelo de las cinco fuerzas de Porter 27
- 6.2.1 Amenaza de nuevos participantes 28
- 6.2.2 Poder de negociación de los proveedores 28
- 6.2.3 Poder de negociación de los compradores 28
- 6.2.4 Amenaza de sustitutos 29
- 6.2.5 Intensidad de la rivalidad 29
- 7 Mercado global de diseño industrial, por tipo
- 7.1.1 Descripción general 31
- 7.1.2 Diseño de producto 31
- 7.1.3 Diseño y fabricación de modelos 31
- 7.1.4 Diseño de interfaz de usuario e interacción 31
- 7.1.5 Otros diseños industriales 32
-
8 Mercado global de diseño industrial, por aplicación
-
8.1 Descripción general 36
- 8.1.1 Transporte 36
- 8.1.2 Electrónico 36
- 8.1.3 Hogar 36
- 8.1.4 Maquinaria y Equipos 36
- 8.1.5 Otros 37
-
8.1 Descripción general 36
-
9 Mercado global de diseño industrial, por región
- 9.1 Región 41
- 9.2 Norteamérica 43
- 9.3 EE. UU. 48
- 9.4 Europa 52
- 9.5 Asia-Pacífico 56
- 9.6 China 62
- 9.7 Japón 66
- 9.8 India 70
- 9.9 Sudeste asiático 74
-
10 Panorama competitivo
- 10.1 Panorama competitivo 79
-
11 Perfiles de empresas
-
11.1 IDEO LLC 82
- 11.1.1 Descripción general de la empresa 82
- 11.1.2 Productos/servicios/soluciones ofrecidos 82
-
11.2 Altran Technologies SA 83
- 11.2.1 Descripción general de la empresa 83
- 11.2.2 Descripción financiera 83
- 11.2.3 Productos/Servicios/Soluciones Ofrecidas 84
-
11.3 Bayerische Motoren Werke AG (Designworks) 85
- 11.3.1 Descripción General de la Empresa 85
- 11.3.2 Descripción Financiera 85
- 11.3.3 Productos/Servicios/Soluciones Ofrecidas (Designworks) 86
-
11.4 Grupo ARTOP 87
- 11.4.1 Descripción General de la Empresa 87
- 11.4.2 Productos/Servicios/Soluciones Ofrecidas 87
-
11.5 Accenture PLC (Designaffairs) 88
- 11.5.1 Descripción General de la Empresa 88
- 11.5.2 Descripción Financiera 88
- 11.5.3 Productos/Servicios/Soluciones Ofrecidas (Designaffair) 89
-
11.6 Grupo de Municiones 90
- 11.6.1 Descripción general de la empresa 90
- 11.6.2 Productos/servicios/soluciones ofrecidos 90
-
11.7 Ziba Design 91
- 11.7.1 Descripción general de la empresa 91
- 11.7.2 Productos/servicios/soluciones ofrecidos 91
-
11.8 BlueFocus Intelligent Communications Group Co. Ltd. 92
- 11.8.1 Descripción general de la empresa 92
- 11.8.2 Descripción financiera 92
- 11.8.3 Productos/servicios/soluciones ofrecidos 93
-
11.9 PDD Group Ltd. 94
- 11.9.1 Descripción general de la empresa 94
- 11.9.2 Productos/servicios/soluciones ofrecidos 94
-
11.10 LUNAR Design 95
- 11.10.1 Descripción general de la empresa 95
- 11.10.2 Productos/Servicios/Soluciones Ofrecidas 95
-
11.11 Diseño de I+D 96
- 11.11.1 Descripción General de la Empresa 96
- 11.11.2 Productos/Servicios/Soluciones Ofrecidas 96
-
11.12 GK Design Group 97
- 11.12.1 Descripción General de la Empresa 97
- 11.12.2 Productos/Servicios/Soluciones Ofrecidas 97
-
11.13 RKS Design 98
- 11.13.1 Descripción General de la Empresa 98
- 11.13.2 Productos/Servicios/Soluciones Ofrecidas 98
-
11.14 Busse Design 99
- 11.14.1 Descripción General de la Empresa 99
- 11.14.2 Productos/Servicios/Soluciones Ofrecidas 99
- ?
-
11.1 IDEO LLC 82
-
12 Lista de Tablas
- TABLA 1 SINOPSIS DEL MERCADO 12
- TABLA 2 LISTA DE SUPUESTOS 15
- TABLA 3 MERCADO GLOBAL DE DISEÑO INDUSTRIAL, POR TIPO, 2013-2018 (MILLONES DE USD) 33
- TABLA 4 MERCADO GLOBAL DE DISEÑO INDUSTRIAL, POR TIPO, 2020-2027 (MILLONES DE USD) 34
- TABLA 5 MERCADO GLOBAL DE DISEÑO INDUSTRIAL, POR APLICACIÓN, 2013-2018 (MILLONES DE USD) 38
- TABLA 6 MERCADO GLOBAL DE DISEÑO INDUSTRIAL, POR APLICACIÓN, 2020-2027 (MILLONES DE USD) 39
- TABLA 7 MERCADO GLOBAL DE DISEÑO INDUSTRIAL, POR REGIÓN, 2013-2018 (MILLONES DE USD) MILLONES) 41
- TABLA 8 MERCADO DE DISEÑO INDUSTRIAL DE AMÉRICA DEL NORTE, POR REGIÓN, 2013-2018 (MILLONES DE USD) 42
- TABLA 9 MERCADO DE DISEÑO INDUSTRIAL DE AMÉRICA DEL NORTE, POR REGIÓN, 2013-2018 (MILLONES DE USD) 43
- TABLA 10 MERCADO DE DISEÑO INDUSTRIAL DE AMÉRICA DEL NORTE, POR REGIÓN, 2013-2018 (MILLONES DE USD) 44
- TABLA 11 MERCADO DE DISEÑO INDUSTRIAL DE AMÉRICA DEL NORTE, POR TIPO, 2013-2018 (MILLONES DE USD) 44
- TABLA 12 MERCADO DE DISEÑO INDUSTRIAL DE AMÉRICA DEL NORTE, POR TIPO, 2020-2027 (MILLONES DE USD) 45
- TABLA 13 MERCADO DE DISEÑO INDUSTRIAL DE AMÉRICA DEL NORTE MERCADO, POR APLICACIÓN, 2013-2018 (MILLONES DE USD) 46
- TABLA 14 MERCADO DE DISEÑO INDUSTRIAL DE AMÉRICA DEL NORTE, POR APLICACIÓN, 2020-2027 (MILLONES DE USD) 47
- TABLA 15 MERCADO DE DISEÑO INDUSTRIAL DE EE. UU., POR TIPO, 2013-2018 (MILLONES DE USD) 48
- TABLA 16 MERCADO DE DISEÑO INDUSTRIAL DE EE. UU., POR TIPO, 2020-2027 (MILLONES DE USD) 49
- TABLA 17 MERCADO DE DISEÑO INDUSTRIAL DE EE. UU., POR APLICACIÓN, 2013-2018 (MILLONES DE USD) 50
- TABLA 18 MERCADO DE DISEÑO INDUSTRIAL DE EE. UU., POR APLICACIÓN, 2020-2027 (MILLONES DE USD) 51
- TABLA 19 DISEÑO INDUSTRIAL EN EUROPA MERCADO, POR TIPO, 2013-2018 (MILLONES DE USD) 52
- TABLA 20 MERCADO EUROPEO DE DISEÑO INDUSTRIAL, POR TIPO, 2020-2027 (MILLONES DE USD) 53
- TABLA 21 MERCADO EUROPEO DE DISEÑO INDUSTRIAL, POR APLICACIÓN, 2013-2018 (MILLONES DE USD) 54
- TABLA 22 MERCADO EUROPEO DE DISEÑO INDUSTRIAL, POR APLICACIÓN, 2020 A 2027 (MILLONES DE USD) 55
- TABLA 23 MERCADO DE DISEÑO INDUSTRIAL DE ASIA-PACÍFICO, POR REGIÓN, 2013-2018 (MILLONES DE USD) 56
- TABLA 24 MERCADO DE DISEÑO INDUSTRIAL DE ASIA-PACÍFICO, POR REGIÓN, 2013-2018 (MILLONES DE USD) 57
- TABLA 25 MERCADO DE DISEÑO INDUSTRIAL DE ASIA-PACÍFICO, POR TIPO, 2013-2018 (MILLONES DE USD) 58
- TABLA 26 MERCADO DE DISEÑO INDUSTRIAL DE ASIA-PACÍFICO, POR TIPO, 2020-2027 (MILLONES DE USD) 59
- TABLA 27 MERCADO DE DISEÑO INDUSTRIAL DE ASIA-PACÍFICO, POR APLICACIÓN, 2013-2018 (MILLONES DE USD) 60
- TABLA 28 MERCADO DE DISEÑO INDUSTRIAL DE ASIA-PACÍFICO, POR APLICACIÓN, 2020-2027 (MILLONES DE USD) 61
- TABLA 29 MERCADO DE DISEÑO INDUSTRIAL DE CHINA, POR TIPO, 2013-2018 (MILLONES DE USD) 62
- TABLA 30 MERCADO DE DISEÑO INDUSTRIAL DE CHINA, POR TIPO, 2020-2027 (MILLONES DE USD) 63
- TABLA 31 MERCADO DE DISEÑO INDUSTRIAL DE CHINA, POR APLICACIÓN, 2013-2018 (MILLONES DE USD) 64
- TABLA 32 MERCADO DE DISEÑO INDUSTRIAL DE CHINA, POR APLICACIÓN, 2020-2027 (MILLONES DE USD) 65
- TABLA 33 MERCADO DE DISEÑO INDUSTRIAL DE JAPÓN, POR TIPO, 2013-2018 (MILLONES DE USD) 66
- TABLA 34 MERCADO DE DISEÑO INDUSTRIAL DE JAPÓN, POR TIPO, 2020-2027 (MILLONES DE USD) 67
- TABLA 35 MERCADO DE DISEÑO INDUSTRIAL DE JAPÓN, POR APLICACIÓN, 2013-2018 (MILLONES DE USD) 68
- TABLA 36 MERCADO DE DISEÑO INDUSTRIAL DE JAPÓN, POR APLICACIÓN, 2020-2027 (MILLONES DE USD) 69
- TABLA 37 MERCADO DE DISEÑO INDUSTRIAL DE LA INDIA, POR TIPO, 2013-2018 (MILLONES DE USD) 70
- TABLA 38 MERCADO DE DISEÑO INDUSTRIAL DE LA INDIA, POR TIPO, 2020-2027 (MILLONES DE USD) 71
- TABLA 39 MERCADO DE DISEÑO INDUSTRIAL DE LA INDIA, POR APLICACIÓN, 2013-2018 (MILLONES DE USD) 72
- TABLA 40 MERCADO DE DISEÑO INDUSTRIAL DE LA INDIA, POR APLICACIÓN, 2020-2027 (MILLONES DE USD) 73
- TABLA 41 MERCADO DE DISEÑO INDUSTRIAL DEL SUDESTE ASIÁTICO, POR TIPO, 2013-2018 (MILLONES DE USD) 74
- TABLA 42 MERCADO DE DISEÑO INDUSTRIAL DEL SUDESTE ASIÁTICO, POR TIPO, 2020-2027 (MILLONES DE USD) MILLONES) 75
- TABLA 43 MERCADO DE DISEÑO INDUSTRIAL DEL SUDESTE ASIÁTICO, POR APLICACIÓN, 2013-2018 (MILLONES DE USD) 76
- TABLA 44 MERCADO DE DISEÑO INDUSTRIAL DEL SUDESTE ASIÁTICO, POR APLICACIÓN, 2020-2027 (MILLONES DE USD) 77
- ?
-
13 Lista de figuras
- FIGURA 1 MERCADO GLOBAL DE DISEÑO INDUSTRIAL: ESTRUCTURA DEL MERCADO 15
- FIGURA 2 TAMAÑO DEL MERCADO GLOBAL Y PARTICIPACIÓN DE MERCADO POR REGIÓN (2013 VS 2027) 17
- FIGURA 3 DE ARRIBA HACIA ABAJO Y ENFOQUE DE ABAJO HACIA ARRIBA 22
- FIGURA 4 CADENA DE VALOR: MERCADO GLOBAL DE DISEÑO INDUSTRIAL 27
- FIGURA 5 ANÁLISIS DE LAS CINCO FUERZAS DE PORTER DEL MERCADO GLOBAL DE DISEÑO INDUSTRIAL 28
- FIGURA 6 MERCADO GLOBAL DE DISEÑO INDUSTRIAL, POR TIPO, 2020 A 2027 (MILLONES DE USD) 33
- FIGURA 7 MERCADO GLOBAL DE DISEÑO INDUSTRIAL, POR TIPO, 2020 A 2027 (MILLONES DE USD) 34
- FIGURA 8 MERCADO GLOBAL DE DISEÑO INDUSTRIAL, POR APLICACIÓN, 2020 A 2027 (MILLONES DE USD) 38
- FIGURA 9 MERCADO GLOBAL DE DISEÑO INDUSTRIAL, POR APLICACIÓN, 2020 A 2027 (MILLONES DE USD) 38
- FIGURA 10 MERCADO GLOBAL DE DISEÑO INDUSTRIAL, POR REGIÓN, 2020 A 2027 (MILLONES DE USD) 41
- FIGURA 11 MERCADO GLOBAL DE DISEÑO INDUSTRIAL, POR REGIÓN, 2020 A 2027 (MILLONES DE USD) 41
- FIGURA 12 MERCADO DE DISEÑO INDUSTRIAL EN AMÉRICA DEL NORTE, POR REGIÓN, 2020 A 2027 (MILLONES DE USD) 43
- FIGURA 13 MERCADO DE DISEÑO INDUSTRIAL EN AMÉRICA DEL NORTE, POR REGIÓN, 2020 A 2027 (MILLONES DE USD) 43
- FIGURA 14 MERCADO DE DISEÑO INDUSTRIAL EN AMÉRICA DEL NORTE, POR TIPO, 2020 A 2027 (MILLONES DE USD) 44
- FIGURA 15 MERCADO DE DISEÑO INDUSTRIAL EN AMÉRICA DEL NORTE, POR TIPO, 2020 A 2027 (MILLONES DE USD) 45
- FIGURA 16 MERCADO DE DISEÑO INDUSTRIAL EN AMÉRICA DEL NORTE, POR APLICACIÓN, 2020 A 2027 (MILLONES DE USD) 46
- FIGURA 17 MERCADO DE DISEÑO INDUSTRIAL EN AMÉRICA DEL NORTE, POR APLICACIÓN, 2020 A 2027 (MILLONES DE USD) 47
- FIGURA 18 MERCADO DE DISEÑO INDUSTRIAL DE EE. UU., POR TIPO, 2020 A 2027 (MILLONES DE USD) 48
- FIGURA 19 MERCADO DE DISEÑO INDUSTRIAL DE EE. UU., POR TIPO, 2020 A 2027 (MILLONES DE USD) 49
- FIGURA 20 MERCADO DE DISEÑO INDUSTRIAL DE EE. UU., POR APLICACIÓN, 2020 HASTA 2027 (MILLONES DE USD) 50
- FIGURA 21 MERCADO DE DISEÑO INDUSTRIAL DE EE. UU., POR APLICACIÓN, 2020 A 2027 (MILLONES DE USD) 51
- FIGURA 22 MERCADO DE DISEÑO INDUSTRIAL DE EUROPA, POR TIPO, 2020 A 2027 (MILLONES DE USD) 52
- FIGURA 23 MERCADO DE DISEÑO INDUSTRIAL DE EUROPA, POR TIPO, 2020 A 2027 (MILLONES DE USD) 53
- FIGURA 24 MERCADO DE DISEÑO INDUSTRIAL DE EUROPA, POR APLICACIÓN, 2020 A 2027 (MILLONES DE USD) 54
- FIGURA 25 MERCADO DE DISEÑO INDUSTRIAL DE EUROPA, POR APLICACIÓN, 2020 A 2027 (MILLONES DE USD) 55
- FIGURA 26 ASIA-PACÍFICO MERCADO DE DISEÑO INDUSTRIAL, POR REGIÓN, 2020 A 2027 (MILLONES DE USD) 56
- FIGURA 27 MERCADO DE DISEÑO INDUSTRIAL DE ASIA-PACÍFICO, POR REGIÓN, 2020 A 2027 (MILLONES DE USD) 57
- FIGURA 28 MERCADO DE DISEÑO INDUSTRIAL DE ASIA-PACÍFICO, POR TIPO, 2020 A 2027 (MILLONES DE USD) 58
- FIGURA 29 MERCADO DE DISEÑO INDUSTRIAL DE ASIA-PACÍFICO, POR TIPO, 2020 A 2027 (MILLONES DE USD) 59
- FIGURA 30 MERCADO DE DISEÑO INDUSTRIAL DE ASIA-PACÍFICO, POR APLICACIÓN, 2020 A 2027 (MILLONES DE USD) 60
- FIGURA 31 MERCADO DE DISEÑO INDUSTRIAL DE ASIA-PACÍFICO, POR APLICACIÓN, 2020 A 2027 (USD MILLONES) 61
- FIGURA 32 MERCADO DE DISEÑO INDUSTRIAL DE CHINA, POR TIPO, 2020 A 2027 (USD MILLONES) 62
- FIGURA 33 MERCADO DE DISEÑO INDUSTRIAL DE CHINA, POR TIPO, 2020 A 2027 (USD MILLONES) 63
- FIGURA 34 MERCADO DE DISEÑO INDUSTRIAL DE CHINA, POR APLICACIÓN, 2020 A 2027 (USD MILLONES) 64
- FIGURA 35 MERCADO DE DISEÑO INDUSTRIAL DE CHINA, POR APLICACIÓN, 2020 A 2027 (USD MILLONES) 65
- FIGURA 36 MERCADO DE DISEÑO INDUSTRIAL DE JAPÓN, POR TIPO, 2020 A 2027 (USD MILLONES) 66
- FIGURA 37 MERCADO DE DISEÑO INDUSTRIAL EN JAPÓN, POR TIPO, 2020 A 2027 (MILLONES DE USD) 67
- FIGURA 38 MERCADO DE DISEÑO INDUSTRIAL EN JAPÓN, POR APLICACIÓN, 2020 A 2027 (MILLONES DE USD) 68
- FIGURA 39 MERCADO DE DISEÑO INDUSTRIAL EN JAPÓN, POR APLICACIÓN, 2020 A 2027 (MILLONES DE USD) 69
- FIGURA 40 MERCADO DE DISEÑO INDUSTRIAL EN INDIA, POR TIPO, 2020 A 2027 (MILLONES DE USD) 70
- FIGURA 41 MERCADO DE DISEÑO INDUSTRIAL EN INDIA, POR TIPO, 2020 A 2027 (MILLONES DE USD) 71
- FIGURA 42 MERCADO DE DISEÑO INDUSTRIAL EN INDIA, POR APLICACIÓN, 2020 A 2027 (MILLONES DE USD) MILLONES) 72
- FIGURA 43 MERCADO DE DISEÑO INDUSTRIAL DE LA INDIA, POR APLICACIÓN, 2020 A 2027 (MILLONES DE USD) 73
- FIGURA 44 MERCADO DE DISEÑO INDUSTRIAL DEL SUDESTE ASIÁTICO, POR TIPO, 2020 A 2027 (MILLONES DE USD) 74
- FIGURA 45 MERCADO DE DISEÑO INDUSTRIAL DEL SUDESTE ASIÁTICO, POR TIPO, 2020 A 2027 (MILLONES DE USD) 75
- FIGURA 46 MERCADO DE DISEÑO INDUSTRIAL DEL SUDESTE ASIÁTICO, POR APLICACIÓN, 2020 A 2027 (MILLONES DE USD) 76
- FIGURA 47 MERCADO DE DISEÑO INDUSTRIAL DEL SUDESTE ASIÁTICO, POR APLICACIÓN, 2020 A 2027 (MILLONES DE USD) 77
Customer Stories

“This is really good guys. Excellent work on a tight deadline. I will continue to use you going forward and recommend you to others. Nice job”

“Thanks. It’s been a pleasure working with you, please use me as reference with any other Intel employees.”

“Thanks for sending the report it gives us a good global view of the Betaïne market.”

“Thank you, this will be very helpful for OQS.”

“We found the report very insightful! we found your research firm very helpful. I'm sending this email to secure our future business.”

“I am very pleased with how market segments have been defined in a relevant way for my purposes (such as "Portable Freezers & refrigerators" and "last-mile"). In general the report is well structured. Thanks very much for your efforts.”

“I have been reading the first document or the study, ,the Global HVAC and FP market report 2021 till 2026. Must say, good info! I have not gone in depth at all parts, but got a good indication of the data inside!”

“We got the report in time, we really thank you for your support in this process. I also thank to all of your team as they did a great job.”
