Request Free Sample ×

Kindly complete the form below to receive a free sample of this Report

* Please use a valid business email

Leading companies partner with us for data-driven Insights

clients tt-cursor
Hero Background

3D Machine Vision Market

ID: MRFR/ICT/1009-CR
128 Pages
Ankit Gupta
Last Updated: April 24, 2026

Informe de investigación de mercado de visión artificial 3D: pronóstico global hasta 2030

Compartir
Download PDF ×

We do not share your information with anyone. However, we may send you emails based on your report interest from time to time. You may contact us at any time to opt-out.

3D Machine Vision Market Infographic
Purchase Options
  1. 1 Resumen ejecutivo
    1. 1.1 Resumen del mercado
  2. 2 Introducción al mercado
    1. 2.1 Definición
    2. 2.2 Alcance del estudio
    3. 2.3 Estructura del mercado
  3. 3 Perspectivas del mercado
  4. 4 Metodología de la investigación
    1. 4.1 Proceso de investigación
    2. 4.2 Investigación primaria
    3. 4.3 Investigación secundaria
    4. 4.4 Estimación del tamaño del mercado
    5. 4.5 Modelo de pronóstico
    6. 4.6 Lista de supuestos
  5. 5 Dinámica del mercado
    1. 5.1 Introducción
    2. 5.2 Factores impulsores
      1. 5.2.1 Creciente demanda de sistemas automatizados de control de calidad
      2. 5.2.2 Aumento de las aplicaciones de la visión artificial en la industria automotriz
    3. 5.3 Limitaciones
      1. 5.3.1 Complejidad en la implementación de sistemas de visión artificial 3D
    4. 5.4 Oportunidades
      1. 5.4.1 El surgimiento de la Industria 4.0
  6. 6 Análisis de factores de mercado
    1. 6.1 Análisis de la cadena de valor
      1. 6.1.1 Proveedores de componentes
      2. 6.1.2 Fabricantes de equipos originales (OEM)
      3. 6.1.3 Integradores/ensambladores de sistemas
      4. 6.1.4 Usuarios finales
    2. 6.2 Modelo de las cinco fuerzas de Porter
      1. 6.2.1 Amenaza de nuevos participantes
      2. 6.2.2 Poder de negociación de los proveedores
      3. 6.2.3 Poder de negociación de los compradores
      4. 6.2.4 Amenaza de sustitutos
      5. 6.2.5 Intensidad de la rivalidad
  7. 7 Mercado global de visión artificial 3D, por componente
    1. 7.1 Hardware
      1. 7.1.1 Cámara
      2. 7.1.2 Comunicación Dispositivo
      3. 7.1.3 Armario de control
      4. 7.1.4 Otros
    2. 7.2 Software
  8. 8 Mercado global de visión artificial 3D, por producto
    1. 8.1 Basado en cámaras inteligentes
    2. 8.2 Basado en PC
  9. 9 Mercado global de visión artificial 3D, por aplicación
    1. 9.1 Inspección
    2. 9.2 Medición
    3. 9.3 Orientación
    4. 9.4 Identificación
  10. 10 Mercado global de visión artificial 3D, por usuario final
    1. 10.1 Automotriz
    2. 10.2 Semiconductores
    3. 10.3 Electrónica de consumo
    4. 10.4 Salud
    5. 10.5 Alimentos y envases
    6. 10.6 Otros
  11. 11 Mercado global de visión artificial 3D, por región
    1. 11.1 Estimaciones y pronósticos del mercado, por región 2023-2030
    2. 11.2 Norteamérica
      1. 11.2.1 Estimaciones y pronósticos de mercado por país, 2023-2030
      2. 11.2.2 Estimaciones y pronósticos de mercado por componente, 2023-2030
      3. 11.2.3 Estimaciones y pronósticos de mercado por producto, 2023-2030
      4. 11.2.4 Estimaciones y pronósticos de mercado por aplicación, 2023-2030
      5. 11.2.5 Estimaciones y pronósticos de mercado por usuario final, 2023-2030
      6. 11.2.6 EE. UU.
        1. 11.2.6.1 Estimaciones y pronósticos de mercado por componente, 2023-2030
        2. 11.2.6.2 Estimaciones y pronósticos de mercado por producto, 2023-2030
        3. 11.2.6.3 Estimaciones y pronósticos de mercado, por aplicación, 2023-2030
        4. 11.2.6.4 Estimaciones y pronósticos de mercado, por usuario final, 2023-2030
      7. 11.2.7 Canadá
        1. 11.2.7.1 Estimaciones y pronósticos de mercado, por componente, 2023-2030
        2. 11.2.7.2 Estimaciones y pronósticos de mercado, por producto, 2023-2030
        3. 11.2.7.3 Estimaciones y pronósticos de mercado, por aplicación, 2023-2030
        4. 11.2.7.4 Estimaciones y pronósticos de mercado, por usuario final, 2023-2030
      8. 11.2.8 México
        1. 11.2.8.1 Estimaciones y pronósticos de mercado, por componente, 2023-2030
        2. 11.2.8.2 Estimaciones y pronósticos de mercado, por producto, 2023-2030
        3. 11.2.8.3 Estimaciones y pronósticos de mercado, por aplicación, 2023-2030
        4. 11.2.8.4 Estimaciones y pronósticos de mercado, por usuario final, 2023-2030
    3. 11.3 Europa
      1. 11.3.1 Estimaciones y pronósticos de mercado, por país, 2023-2030
      2. 11.3.2 Estimaciones y pronósticos de mercado, por componente, 2023-2030
      3. 11.3.3 Estimaciones y pronósticos de mercado, por producto, 2023-2030
      4. 11.3.4 Estimaciones y pronósticos de mercado, por aplicación, 2023-2030
      5. 11.3.5 Estimaciones de mercado y Pronóstico, por usuario final, 2023-2030
      6. 11.3.6 Reino Unido
        1. 11.3.6.1 Estimaciones y pronóstico del mercado, por componente, 2023-2030
        2. 11.3.6.2 Estimaciones y pronóstico del mercado, por producto, 2023-2030
        3. 11.3.6.3 Estimaciones y pronóstico del mercado, por aplicación, 2023-2030
        4. 11.3.6.4 Estimaciones y pronóstico del mercado, por usuario final, 2023-2030
      7. 11.3.7 Alemania
        1. 11.3.7.1 Estimaciones y pronóstico del mercado, por componente, 2023-2030
        2. 11.3.7.2 Estimaciones y pronóstico del mercado, por producto, 2023-2030
        3. 11.3.7.3 Estimaciones y Pronóstico, por aplicación, 2023-2030
        4. 11.3.7.4 Estimaciones y pronóstico del mercado, por usuario final, 2023-2030
      8. 11.3.8 Francia
        1. 11.3.8.1 Estimaciones y pronóstico del mercado, por componente, 2023-2030
        2. 11.3.8.2 Estimaciones y pronóstico del mercado, por producto, 2023-2030
        3. 11.3.8.3 Estimaciones y pronóstico del mercado, por aplicación, 2023-2030
        4. 11.3.8.4 Estimaciones y pronóstico del mercado, por usuario final, 2023-2030
      9. 11.3.9 Resto de Europa
        1. 11.3.9.1 Estimaciones y pronóstico del mercado, por componente, 2023-2030
        2. 11.3.9.2 Estimaciones del mercado Estimaciones y pronósticos del mercado, por producto, 2023-2030
        3. 11.3.9.3 Estimaciones y pronósticos del mercado, por aplicación, 2023-2030
        4. 11.3.9.4 Estimaciones y pronósticos del mercado, por usuario final, 2023-2030
    4. 11.4 Asia-Pacífico
      1. 11.4.1 Estimaciones y pronósticos del mercado, por país, 2023-2030
      2. 11.4.2 Estimaciones y pronósticos del mercado, por componente, 2023-2030
      3. 11.4.3 Estimaciones y pronósticos del mercado, por producto, 2023-2030
      4. 11.4.4 Estimaciones y pronósticos del mercado, por aplicación, 2023-2030
      5. 11.4.5 Estimaciones y pronósticos del mercado, por usuario final 2023-2030
      6. 11.4.6 China
        1. 11.4.6.1 Estimaciones y pronósticos de mercado, por producto, 2023-2030
        2. 11.4.6.2 Estimaciones y pronósticos de mercado, por aplicación, 2023-2030
        3. 11.4.6.3 Estimaciones y pronósticos de mercado, por usuario final, 2023-2030
      7. 11.4.7 Japón
        1. 11.4.7.1 Estimaciones y pronósticos de mercado, por componente, 2023-2030
        2. 11.4.7.2 Estimaciones y pronósticos de mercado, por producto, 2023-2030
        3. 11.4.7.3 Estimaciones y pronósticos de mercado, por aplicación, 2023-2030
        4. 11.4.7.4 Estimaciones y pronósticos de mercado, por usuario final 2023-2030
      8. 11.4.8 India
        1. 11.4.8.1 Estimaciones y pronósticos del mercado, por componente, 2023-2030
        2. 11.4.8.2 Estimaciones y pronósticos del mercado, por producto, 2023-2030
        3. 11.4.8.3 Estimaciones y pronósticos del mercado, por aplicación, 2023-2030
        4. 11.4.8.4 Estimaciones y pronósticos del mercado, por usuario final, 2023-2030
      9. 11.4.9 Resto de Asia-Pacífico
        1. 11.4.9.1 Estimaciones y pronósticos del mercado, por componente, 2023-2030
        2. 11.4.9.2 Estimaciones y pronósticos del mercado, por producto, 2023-2030
        3. 11.4.9.3 Estimaciones y Pronóstico, por aplicación, 2023-2030
        4. 11.4.9.4 Estimaciones y pronósticos de mercado, por usuario final, 2023-2030
    5. 11.5 Resto del mundo
      1. 11.5.1 Estimaciones y pronósticos de mercado, por país, 2023-2030
      2. 11.5.2 Estimaciones y pronósticos de mercado, por componente, 2023-2030
      3. 11.5.3 Estimaciones y pronósticos de mercado, por producto, 2023-2030
      4. 11.5.4 Estimaciones y pronósticos de mercado, por aplicación, 2023-2030
      5. 11.5.5 Estimaciones y pronósticos de mercado, por usuario final, 2023-2030
      6. 11.5.6 Oriente Medio y África
        1. 11.5.6.1 Estimaciones y pronósticos de mercado, por componente 2023-2030
        2. 11.5.6.2 Estimaciones y pronósticos de mercado, por producto, 2023-2030
        3. 11.5.6.3 Estimaciones y pronósticos de mercado, por aplicación, 2023-2030
        4. 11.5.6.4 Estimaciones y pronósticos de mercado, por usuario final, 2023-2030
      7. 11.5.7 Sudamérica
        1. 11.5.7.1 Estimaciones y pronósticos de mercado, por componente, 2023-2030
        2. 11.5.7.2 Estimaciones y pronósticos de mercado, por producto, 2023-2030
        3. 11.5.7.3 Estimaciones y pronósticos de mercado, por aplicación, 2023-2030
        4. 11.5.7.4 Estimaciones y pronósticos de mercado, por usuario final 2023–2030
  12. 12 Panorama competitivo
    1. 12.1 Panorama competitivo
    2. 12.2 Análisis comparativo competitivo del mercado de visión artificial 3D
  13. 13 Perfiles de empresas
    1. 13.1 OMRON Corporation
      1. 13.1.1 Panorama de la empresa
      2. 13.1.2 Panorama financiero
      3. 13.1.3 Productos/servicios/soluciones ofrecidos
      4. 13.1.4 Desarrollos clave
      5. 13.1.5 Análisis FODA
      6. 13.1.6 Estrategias clave
    2. 13.2 Canon Inc.
      1. 13.2.1 Panorama de la empresa
      2. 13.2.2 Panorama financiero
      3. 13.2.3 Productos/servicios/soluciones ofrecidos
      4. 13.2.4 Desarrollos clave
      5. 13.2.5 Análisis FODA Análisis
      6. 13.2.6 Estrategias Clave
    3. 13.3 Cognex Corporation
      1. 13.3.1 Descripción General de la Empresa
      2. 13.3.2 Descripción Financiera
      3. 13.3.3 Productos/Servicios/Soluciones Ofrecidas
      4. 13.3.4 Desarrollos Clave
      5. 13.3.5 Análisis FODA
      6. 13.3.6 Estrategias Clave
    4. 13.4 National Instruments
      1. 13.4.1 Descripción General de la Empresa
      2. 13.4.2 Descripción Financiera
      3. 13.4.3 Productos/Servicios/Soluciones Ofrecidas
      4. 13.4.4 Desarrollos Clave
      5. 13.4.5 Análisis FODA
      6. 13.4.6 Estrategias Clave
    5. 13.5 Keyence Corporation
      1. 13.5.1 Descripción General de la Empresa
      2. 13.5.2 Análisis Financiero Descripción general
      3. 13.5.3 Productos/Servicios/Soluciones ofrecidos
      4. 13.5.4 Desarrollos clave
      5. 13.5.5 Análisis FODA
      6. 13.5.6 Estrategias clave
    6. 13.6 Robotic Vision Technologies, Inc.
      1. 13.6.1 Descripción general de la empresa
      2. 13.6.2 Descripción financiera
      3. 13.6.3 Productos/Servicios/Soluciones ofrecidos
      4. 13.6.4 Desarrollos clave
    7. 13.7 Sony Corporation
      1. 13.7.1 Descripción general de la empresa
      2. 13.7.2 Descripción financiera
      3. 13.7.3 Productos/Servicios/Soluciones ofrecidos
      4. 13.7.4 Desarrollos clave
      5. 13.7.5 Análisis FODA
      6. 13.7.6 Estrategias clave
    8. 13.8 Coherente, Inc.
      1. 13.8.1 Descripción general de la empresa
      2. 13.8.2 Descripción financiera
      3. 13.8.3 Productos/servicios/soluciones ofrecidos
      4. 13.8.4 Desarrollos clave
    9. 13.9 Hermary Opto Electronics Inc.
      1. 13.9.1 Descripción general de la empresa
      2. 13.9.2 Descripción financiera
      3. 13.9.3 Productos/servicios/soluciones ofrecidos
      4. 13.9.4 Desarrollos clave
    10. 13.10 Basler AG
      1. 13.10.1 Descripción general de la empresa
      2. 13.10.2 Descripción financiera
      3. 13.10.3 Productos/servicios/soluciones ofrecidos
      4. 13.10.4 Desarrollos clave
  14. 14 Lista de tablas
    1. TABLA 1 LISTA DE SUPUESTOS
    2. TABLA 2 VISIÓN ARTIFICIAL 3D GLOBAL MERCADO, POR COMPONENTE, 2023-2030 (MILLONES DE USD)
    3. TABLA 3 MERCADO MUNDIAL DE VISIÓN ARTIFICIAL 3D, POR HARDWARE, 2023-2030 (MILLONES DE USD)
    4. TABLA 4 MERCADO MUNDIAL DE VISIÓN ARTIFICIAL 3D, POR PRODUCTO, 2023-2030 (MILLONES DE USD)
    5. TABLA 5 MERCADO MUNDIAL DE VISIÓN ARTIFICIAL 3D, POR APLICACIÓN, 2023-2030 (MILLONES DE USD)
    6. TABLA 6 MERCADO MUNDIAL DE VISIÓN ARTIFICIAL 3D, POR USUARIO FINAL, 2023-2030 (MILLONES DE USD)
    7. TABLA 7 MERCADO MUNDIAL DE VISIÓN ARTIFICIAL 3D, POR REGIÓN, 2023-2030 (MILLONES DE USD)
    8. TABLA 8 NORTE AMÉRICA: MERCADO DE VISIÓN ARTIFICIAL 3D, POR PAÍS, 2023-2030 (MILLONES DE USD)
    9. TABLA 9 AMÉRICA DEL NORTE: MERCADO DE VISIÓN ARTIFICIAL 3D, POR COMPONENTE, 2023-2030 (MILLONES DE USD)
    10. TABLA 10 AMÉRICA DEL NORTE: MERCADO DE VISIÓN ARTIFICIAL 3D, POR HARDWARE, 2023-2030 (MILLONES DE USD)
    11. TABLA 11 AMÉRICA DEL NORTE: MERCADO DE VISIÓN ARTIFICIAL 3D, POR PRODUCTO, 2023-2030 (MILLONES DE USD)
    12. TABLA 12 AMÉRICA DEL NORTE: MERCADO DE VISIÓN ARTIFICIAL 3D, POR APLICACIÓN, 2023-2030 (MILLONES DE USD)
    13. TABLA 13 AMÉRICA DEL NORTE: VISIÓN ARTIFICIAL 3D MERCADO POR USUARIO FINAL, 2023-2030 (MILLONES DE USD)
    14. TABLA 14 EE. UU.: MERCADO DE VISIÓN ARTIFICIAL 3D, POR COMPONENTE, 2023-2030 (MILLONES DE USD)
    15. TABLA 15 EE. UU.: MERCADO DE VISIÓN ARTIFICIAL 3D, POR HARDWARE, 2023-2030 (MILLONES DE USD)
    16. TABLA 16 EE. UU.: MERCADO DE VISIÓN ARTIFICIAL 3D, POR PRODUCTO, 2023-2030 (MILLONES DE USD)
    17. TABLA 17 EE. UU.: MERCADO DE VISIÓN ARTIFICIAL 3D, POR APLICACIÓN, 2023-2030 (MILLONES DE USD)
    18. TABLA 18 EE. UU.: MERCADO DE VISIÓN ARTIFICIAL 3D, POR USUARIO FINAL, 2023-2030 (MILLONES DE USD)
    19. TABLA 19 CANADÁ: MERCADO DE VISIÓN ARTIFICIAL 3D, POR COMPONENTE, 2023-2030 (MILLONES DE USD)
    20. TABLA 20 CANADÁ: MERCADO DE VISIÓN ARTIFICIAL 3D, POR HARDWARE, 2023-2030 (MILLONES DE USD)
    21. TABLA 21 CANADÁ: MERCADO DE VISIÓN ARTIFICIAL 3D, POR PRODUCTO, 2023-2030 (MILLONES DE USD)
    22. TABLA 22 CANADÁ: MERCADO DE VISIÓN ARTIFICIAL 3D, POR APLICACIÓN, 2023-2030 (MILLONES DE USD)
    23. TABLA 23 CANADÁ: MERCADO DE VISIÓN ARTIFICIAL 3D, POR USUARIO FINAL, 2023-2030 (MILLONES DE USD)
    24. TABLA 24 MÉXICO: MERCADO DE VISIÓN ARTIFICIAL 3D, POR COMPONENTE, 2023-2030 (MILLONES DE USD)
    25. TABLA 25 MÉXICO: MERCADO DE VISIÓN ARTIFICIAL 3D, POR HARDWARE, 2023-2030 (MILLONES DE USD)
    26. TABLA 26 MÉXICO: MERCADO DE VISIÓN ARTIFICIAL 3D, POR PRODUCTO, 2023-2030 (MILLONES DE USD)
    27. TABLA 27 MÉXICO: MERCADO DE VISIÓN ARTIFICIAL 3D, POR APLICACIÓN, 2023-2030 (MILLONES DE USD)
    28. TABLA 28 MÉXICO: MERCADO DE VISIÓN ARTIFICIAL 3D, POR USUARIO FINAL, 2023-2030 (MILLONES DE USD)
    29. TABLA 29 EUROPA: MERCADO DE VISIÓN ARTIFICIAL 3D, POR PAÍS, 2023-2030 (MILLONES DE USD)
    30. TABLA 30 EUROPA: VISIÓN ARTIFICIAL 3D MERCADO, POR COMPONENTE, 2023-2030 (MILLONES DE USD)
    31. TABLA 31 EUROPA: MERCADO DE VISIÓN ARTIFICIAL 3D, POR HARDWARE, 2023-2030 (MILLONES DE USD)
    32. TABLA 32 EUROPA: MERCADO DE VISIÓN ARTIFICIAL 3D, POR PRODUCTO, 2023-2030 (MILLONES DE USD)
    33. TABLA 33 EUROPA: MERCADO DE VISIÓN ARTIFICIAL 3D, POR APLICACIÓN, 2023-2030 (MILLONES DE USD)
    34. TABLA 34 EUROPA: MERCADO DE VISIÓN ARTIFICIAL 3D, POR USUARIO FINAL, 2023-2030 (MILLONES DE USD)
    35. TABLA 35 REINO UNIDO: MERCADO DE VISIÓN ARTIFICIAL 3D, POR COMPONENTE, 2023-2030 (MILLONES DE USD)
    36. TABLA 36 REINO UNIDO: MERCADO DE VISIÓN ARTIFICIAL 3D, POR HARDWARE, 2023-2030 (MILLONES DE USD)
    37. TABLA 37 REINO UNIDO: MERCADO DE VISIÓN ARTIFICIAL 3D, POR PRODUCTO, 2023-2030 (MILLONES DE USD)
    38. TABLA 38 REINO UNIDO: MERCADO DE VISIÓN ARTIFICIAL 3D, POR APLICACIÓN, 2023-2030 (MILLONES DE USD)
    39. TABLA 39 REINO UNIDO: MERCADO DE VISIÓN ARTIFICIAL 3D, POR USUARIO FINAL, 2023-2030 (MILLONES DE USD)
    40. TABLA 40 ALEMANIA: MERCADO DE VISIÓN ARTIFICIAL 3D, POR COMPONENTE, 2023-2030 (MILLONES DE USD)
    41. TABLA 41 ALEMANIA: MERCADO DE VISIÓN ARTIFICIAL 3D, POR HARDWARE, 2023-2030 (MILLONES DE USD)
    42. TABLA 42 ALEMANIA: MERCADO DE VISIÓN ARTIFICIAL 3D, POR PRODUCTO, 2023-2030 (MILLONES DE USD)
    43. TABLA 43 ALEMANIA: MERCADO DE VISIÓN ARTIFICIAL 3D, POR APLICACIÓN, 2023-2030 (MILLONES DE USD)
    44. TABLA 44 ALEMANIA: MERCADO DE VISIÓN ARTIFICIAL 3D, POR USUARIO FINAL, 2023-2030 (MILLONES DE USD)
    45. TABLA 45 FRANCIA: MERCADO DE VISIÓN ARTIFICIAL 3D, POR COMPONENTE, 2023-2030 (MILLONES DE USD)
    46. TABLA 46 FRANCIA: MERCADO DE VISIÓN ARTIFICIAL 3D, POR HARDWARE, 2023-2030 (MILLONES DE USD)
    47. TABLA 47 FRANCIA: MERCADO DE VISIÓN ARTIFICIAL 3D, POR PRODUCTO, 2023-2030 (MILLONES DE USD)
    48. TABLA 48 FRANCIA: MERCADO DE VISIÓN ARTIFICIAL 3D, POR APLICACIÓN, 2023-2030 (MILLONES DE USD)
    49. TABLA 49 FRANCIA: MERCADO DE VISIÓN ARTIFICIAL 3D, POR USUARIO FINAL, 2023-2030 (MILLONES DE USD)
    50. TABLA 50 RESTO DE EUROPA: MERCADO DE VISIÓN ARTIFICIAL 3D, POR COMPONENTE, 2023-2030 (MILLONES DE USD)
    51. TABLA 51 RESTO DE EUROPA: MERCADO DE VISIÓN ARTIFICIAL 3D, POR HARDWARE, 2023-2030 (MILLONES DE USD)
    52. TABLA 52 RESTO DE EUROPA: MERCADO DE VISIÓN ARTIFICIAL 3D, POR PRODUCTO 2023-2030 (MILLONES DE USD)
    53. TABLA 53 RESTO DE EUROPA: MERCADO DE VISIÓN ARTIFICIAL 3D, POR APLICACIÓN, 2023-2030 (MILLONES DE USD)
    54. TABLA 54 RESTO DE EUROPA: MERCADO DE VISIÓN ARTIFICIAL 3D, POR USUARIO FINAL, 2023-2030 (MILLONES DE USD)
    55. TABLA 55 ASIA-PACÍFICO: MERCADO DE VISIÓN ARTIFICIAL 3D, POR PAÍS, 2023-2030 (MILLONES DE USD)
    56. TABLA 56 ASIA-PACÍFICO: MERCADO DE VISIÓN ARTIFICIAL 3D, POR COMPONENTE, 2023-2030 (MILLONES DE USD)
    57. TABLA 57 ASIA-PACÍFICO: MERCADO DE VISIÓN ARTIFICIAL 3D, POR HARDWARE, 2023-2030 (MILLONES DE USD) MILLONES)
    58. TABLA 58 ASIA-PACÍFICO: MERCADO DE VISIÓN ARTIFICIAL 3D, POR PRODUCTO, 2023-2030 (MILLONES DE USD)
    59. TABLA 59 ASIA-PACÍFICO: MERCADO DE VISIÓN ARTIFICIAL 3D, POR APLICACIÓN, 2023-2030 (MILLONES DE USD)
    60. TABLA 60 ASIA-PACÍFICO: MERCADO DE VISIÓN ARTIFICIAL 3D, POR USUARIO FINAL, 2023-2030 (MILLONES DE USD)
    61. TABLA 61 CHINA: MERCADO DE VISIÓN ARTIFICIAL 3D, POR COMPONENTE, 2023-2030 (MILLONES DE USD)
    62. TABLA 62 CHINA: MERCADO DE VISIÓN ARTIFICIAL 3D, POR HARDWARE, 2023-2030 (MILLONES DE USD)
    63. TABLA 63 CHINA: VISIÓN ARTIFICIAL 3D MERCADO DE VISIÓN ARTIFICIAL 3D, POR PRODUCTO, 2023-2030 (MILLONES DE USD)
    64. TABLA 64 CHINA: MERCADO DE VISIÓN ARTIFICIAL 3D, POR APLICACIÓN, 2023-2030 (MILLONES DE USD)
    65. TABLA 65 CHINA: MERCADO DE VISIÓN ARTIFICIAL 3D, POR USUARIO FINAL, 2023-2030 (MILLONES DE USD)
    66. TABLA 66 JAPÓN: MERCADO DE VISIÓN ARTIFICIAL 3D, POR COMPONENTE, 2023-2030 (MILLONES DE USD)
    67. TABLA 67 JAPÓN: MERCADO DE VISIÓN ARTIFICIAL 3D, POR HARDWARE, 2023-2030 (MILLONES DE USD)
    68. TABLA 68 JAPÓN: MERCADO DE VISIÓN ARTIFICIAL 3D, POR PRODUCTO, 2023-2030 (MILLONES DE USD)
    69. TABLA 69 JAPÓN: MERCADO DE VISIÓN ARTIFICIAL 3D, POR APLICACIÓN, 2023-2030 (MILLONES DE USD)
    70. TABLA 70 JAPÓN: MERCADO DE VISIÓN ARTIFICIAL 3D, POR USUARIO FINAL, 2023-2030 (MILLONES DE USD)
    71. TABLA 71 INDIA: MERCADO DE VISIÓN ARTIFICIAL 3D, POR COMPONENTE, 2023-2030 (MILLONES DE USD)
    72. TABLA 72 INDIA: MERCADO DE VISIÓN ARTIFICIAL 3D, POR HARDWARE, 2023-2030 (MILLONES DE USD)
    73. TABLA 73 INDIA: MERCADO DE VISIÓN ARTIFICIAL 3D, POR PRODUCTO, 2023-2030 (MILLONES DE USD)
    74. TABLA 74 INDIA: MERCADO DE VISIÓN ARTIFICIAL 3D, POR APLICACIÓN, 2023-2030 (MILLONES DE USD)
    75. TABLA 75 INDIA: MERCADO DE VISIÓN ARTIFICIAL 3D, POR USUARIO FINAL, 2023-2030 (MILLONES DE USD)
    76. TABLA 76 RESTO DE ASIA-PACÍFICO: MERCADO DE VISIÓN ARTIFICIAL 3D, POR COMPONENTE, 2023-2030 (MILLONES DE USD)
    77. TABLA 77 RESTO DE ASIA-PACÍFICO: MERCADO DE VISIÓN ARTIFICIAL 3D, POR HARDWARE, 2023-2030 (MILLONES DE USD)
    78. TABLA 78 RESTO DE ASIA-PACÍFICO: MERCADO DE VISIÓN ARTIFICIAL 3D, POR PRODUCTO, 2023-2030 (MILLONES DE USD)
    79. TABLA 79 RESTO DE ASIA-PACÍFICO: MERCADO DE VISIÓN ARTIFICIAL 3D, POR APLICACIÓN 2023-2030 (MILLONES DE USD)
    80. TABLA 80 RESTO DE ASIA-PACÍFICO: MERCADO DE VISIÓN ARTIFICIAL 3D, POR USUARIO FINAL, 2023-2030 (MILLONES DE USD)
    81. TABLA 81 RESTO DEL MUNDO: MERCADO DE VISIÓN ARTIFICIAL 3D, POR PAÍS, 2023-2030 (MILLONES DE USD)
    82. TABLA 82 RESTO DEL MUNDO: MERCADO DE VISIÓN ARTIFICIAL 3D, POR COMPONENTE, 2023-2030 (MILLONES DE USD)
    83. TABLA 83 RESTO DEL MUNDO: MERCADO DE VISIÓN ARTIFICIAL 3D, POR HARDWARE, 2023-2030 (MILLONES DE USD)
    84. TABLA 84 RESTO DEL MUNDO: MERCADO DE VISIÓN ARTIFICIAL 3D, POR PRODUCTO 2023-2030 (MILLONES DE USD)
    85. TABLA 85 RESTO DEL MUNDO: MERCADO DE VISIÓN ARTIFICIAL 3D, POR APLICACIÓN, 2023-2030 (MILLONES DE USD)
    86. TABLA 86 RESTO DEL MUNDO: MERCADO DE VISIÓN ARTIFICIAL 3D, POR USUARIO FINAL, 2023-2030 (MILLONES DE USD)
    87. TABLA 87 ORIENTE MEDIO Y ÁFRICA: MERCADO DE VISIÓN ARTIFICIAL 3D, POR COMPONENTE, 2023-2030 (MILLONES DE USD)
    88. TABLA 88 ORIENTE MEDIO Y ÁFRICA: MERCADO DE VISIÓN ARTIFICIAL 3D, POR HARDWARE, 2023-2030 (MILLONES DE USD)
    89. TABLA 89 ORIENTE MEDIO Y ÁFRICA: MERCADO DE VISIÓN ARTIFICIAL 3D, POR PRODUCTO 2023-2030 (MILLONES DE USD)
    90. TABLA 90 ORIENTE MEDIO Y ÁFRICA: MERCADO DE VISIÓN ARTIFICIAL 3D, POR APLICACIÓN, 2023-2030 (MILLONES DE USD)
    91. TABLA 91 ORIENTE MEDIO Y ÁFRICA: MERCADO DE VISIÓN ARTIFICIAL 3D, POR USUARIO FINAL, 2023-2030 (MILLONES DE USD)
    92. TABLA 92 SUDAMÉRICA: MERCADO DE VISIÓN ARTIFICIAL 3D, POR COMPONENTE, 2023-2030 (MILLONES DE USD)
    93. TABLA 93 SUDAMÉRICA: MERCADO DE VISIÓN ARTIFICIAL 3D, POR HARDWARE, 2023-2030 (MILLONES DE USD)
    94. TABLA 94 SUDAMÉRICA: MERCADO DE VISIÓN ARTIFICIAL 3D, POR PRODUCTO 2023-2030 (MILLONES DE USD)
    95. TABLA 95 SUDAMÉRICA: MERCADO DE VISIÓN ARTIFICIAL 3D, POR APLICACIÓN, 2023-2030 (MILLONES DE USD)
    96. TABLA 96 SUDAMÉRICA: MERCADO DE VISIÓN ARTIFICIAL 3D, POR USUARIO FINAL, 2023-2030 (MILLONES DE USD)
    97. TABLA 97 OMRON CORPORATION: PRODUCTOS/SOLUCIONES/SERVICIOS OFRECIDOS
    98. TABLA 98 OMRON CORPORATION: DESARROLLOS CLAVE
    99. TABLA 99 CANON INC.: PRODUCTOS/SOLUCIONES/SERVICIOS OFRECIDOS
    100. TABLA 100 CANON INC.: DESARROLLOS CLAVE
    101. TABLA 101 COGNEX CORPORATION: PRODUCTOS/SOLUCIONES/SERVICIOS OFRECIDOS
    102. TABLA 102 COGNEX CORPORATION: DESARROLLOS CLAVE
    103. TABLA 103 NATIONAL INSTRUMENTS: PRODUCTOS/SOLUCIONES/SERVICIOS OFRECIDOS
    104. TABLA 104 KEYENCE CORPORATION: PRODUCTOS/SOLUCIONES/SERVICIOS OFRECIDOS
    105. TABLA 105 ROBOTIC VISION TECHNOLOGIES, INC.: PRODUCTOS/SOLUCIONES/SERVICIOS OFRECIDOS
    106. TABLA 106 SONY CORPORATION: PRODUCTOS/SOLUCIONES/SERVICIOS OFRECIDOS
    107. TABLA 107 SONY CORPORATION: DESARROLLOS CLAVE
    108. TABLA 108 COHERENT, INC.: PRODUCTOS/SOLUCIONES/SERVICIOS OFRECIDOS
    109. TABLA 109 HERMARY OPTOELECTRONICS INC.: PRODUCTOS/SOLUCIONES/SERVICIOS OFERTA
    110. TABLA 110 BASLER AG: PRODUCTOS/SOLUCIONES/SERVICIOS OFRECIDOS
  15. 15 Lista de Figuras
    1. FIGURA 1 SINOPSIS DEL MERCADO
    2. FIGURA 2 CUOTA DE MERCADO GLOBAL DE VISIÓN ARTIFICIAL 3D, POR REGIÓN, 2023 (%)
    3. FIGURA 3 MERCADO GLOBAL DE VISIÓN ARTIFICIAL 3D: ESTRUCTURA DEL MERCADO
    4. FIGURA 4 NORTEAMÉRICA: MERCADO DE VISIÓN ARTIFICIAL 3D, POR PAÍS, 2023 VS 2030 (MILLONES DE USD)
    5. FIGURA 5 NORTEAMÉRICA: CUOTA DE MERCADO DE VISIÓN ARTIFICIAL 3D, POR PAÍS, 2023 VS 2030 (%)
    6. FIGURA 6 EUROPA: MERCADO DE VISIÓN ARTIFICIAL 3D, POR PAÍS, 2023 VS 2030 (MILLONES DE USD)
    7. FIGURA 7 EUROPA: CUOTA DE MERCADO DE VISIÓN ARTIFICIAL 3D, POR PAÍS, 2023 VS 2030 (%)
    8. FIGURA 8 ASIA-PACÍFICO: MERCADO DE VISIÓN ARTIFICIAL 3D, POR PAÍS, 2023 VS 2030 (MILLONES DE USD)
    9. FIGURA 9 ASIA-PACÍFICO: CUOTA DE MERCADO DE VISIÓN ARTIFICIAL 3D, POR PAÍS, 2023 VS 2030 (%)
    10. FIGURA 10 RESTO DEL MUNDO: MERCADO DE VISIÓN ARTIFICIAL 3D, POR PAÍS, 2023 VS 2030 (MILLONES DE USD)
    11. FIGURA 11 RESTO DEL MUNDO: CUOTA DE MERCADO DE VISIÓN ARTIFICIAL 3D, POR PAÍS, 2023 VS 2030 (%)
    12. FIGURA 12 PROCESO DE INVESTIGACIÓN DE MRFR
    13. FIGURA 13 DE ARRIBA A ABAJO Y ENFOQUE DE ABAJO A ARRIBA
    14. FIGURA 14 ANÁLISIS DE LA DINÁMICA DEL MERCADO GLOBAL DE VISIÓN ARTIFICIAL 3D
    15. FIGURA 15 CADENA DE VALOR: MERCADO GLOBAL DE VISIÓN ARTIFICIAL 3D
    16. FIGURA 17 MERCADO GLOBAL DE VISIÓN ARTIFICIAL 3D, POR COMPONENTE, 2023 VS 2030 (MILLONES DE USD)
    17. FIGURA 18 MERCADO GLOBAL DE VISIÓN ARTIFICIAL 3D, POR HARDWARE, 2023 VS 2030 (MILLONES DE USD)
    18. FIGURA 19 MERCADO GLOBAL DE VISIÓN ARTIFICIAL 3D, POR PRODUCTO, 2023 VS 2030 (MILLONES DE USD)
    19. FIGURA 20 MERCADO GLOBAL DE VISIÓN ARTIFICIAL 3D, POR APLICACIÓN 2023 VS 2030 (MILLONES DE USD)
    20. FIGURA 21 MERCADO GLOBAL DE VISIÓN ARTIFICIAL 3D, POR USUARIO FINAL, 2023 VS 2030 (MILLONES DE USD)
    21. FIGURA 22 MERCADO GLOBAL DE VISIÓN ARTIFICIAL 3D, POR REGIÓN, 2023 VS 2030 (MILLONES DE USD)
    22. FIGURA 23 NORTEAMÉRICA: MERCADO DE VISIÓN ARTIFICIAL 3D, POR PAÍS, 2023 VS 2030 (MILLONES DE USD)
    23. FIGURA 24 NORTEAMÉRICA: MERCADO DE VISIÓN ARTIFICIAL 3D, POR COMPONENTE, 2023 VS 2030 (MILLONES DE USD)
    24. FIGURA 25 NORTEAMÉRICA: MERCADO DE VISIÓN ARTIFICIAL 3D, POR HARDWARE, 2023 VS 2030 (MILLONES DE USD)
    25. FIGURA 26 NORTEAMÉRICA: MERCADO DE VISIÓN ARTIFICIAL 3D, POR PRODUCTO, 2023 VS 2030 (MILLONES DE USD)
    26. FIGURA 27 NORTEAMÉRICA: MERCADO DE VISIÓN ARTIFICIAL 3D, POR APLICACIÓN, 2023 VS 2030 (MILLONES DE USD)
    27. FIGURA 28 NORTEAMÉRICA: MERCADO DE VISIÓN ARTIFICIAL 3D, POR USUARIO FINAL, 2023 VS 2030 (MILLONES DE USD)
    28. FIGURA 29 EUROPA: MERCADO DE VISIÓN ARTIFICIAL 3D, POR PAÍS, 2023 VS 2030 (MILLONES DE USD)
    29. FIGURA 30 EUROPA: VISIÓN ARTIFICIAL 3D MERCADO, POR COMPONENTE, 2023 VS 2030 (MILLONES DE USD)
    30. FIGURA 31 EUROPA: MERCADO DE VISIÓN ARTIFICIAL 3D, POR HARDWARE, 2023 VS 2030 (MILLONES DE USD)
    31. FIGURA 32 EUROPA: MERCADO DE VISIÓN ARTIFICIAL 3D, POR PRODUCTO, 2023 VS 2030 (MILLONES DE USD)
    32. FIGURA 33 EUROPA: MERCADO DE VISIÓN ARTIFICIAL 3D, POR APLICACIÓN, 2023 VS 2030 (MILLONES DE USD)
    33. FIGURA 34 EUROPA: MERCADO DE VISIÓN ARTIFICIAL 3D, POR USUARIO FINAL, 2023 VS 2030 (MILLONES DE USD)
    34. FIGURA 35 ASIA-PACÍFICO: MERCADO DE VISIÓN ARTIFICIAL 3D, POR PAÍS, 2023 VS 2030 (MILLONES DE USD)
    35. FIGURA 36 ASIA-PACÍFICO: MERCADO DE VISIÓN ARTIFICIAL 3D, POR COMPONENTE, 2023 VS 2030 (MILLONES DE USD)
    36. FIGURA 37 ASIA-PACÍFICO: MERCADO DE VISIÓN ARTIFICIAL 3D, POR HARDWARE, 2023 VS 2030 (MILLONES DE USD)
    37. FIGURA 38 ASIA-PACÍFICO: MERCADO DE VISIÓN ARTIFICIAL 3D, POR PRODUCTO, 2023 VS 2030 (MILLONES DE USD)
    38. FIGURA 39 ASIA-PACÍFICO: MERCADO DE VISIÓN ARTIFICIAL 3D, POR APLICACIÓN, 2023 VS 2030 (MILLONES DE USD)
    39. FIGURA 40 ASIA-PACÍFICO: VISIÓN ARTIFICIAL 3D MERCADO POR USUARIO FINAL, 2023 VS 2030 (MILLONES DE USD)
    40. FIGURA 41 RESTO DEL MUNDO: MERCADO DE VISIÓN ARTIFICIAL 3D POR PAÍS, 2023 VS 2030 (MILLONES DE USD)
    41. FIGURA 42 RESTO DEL MUNDO: MERCADO DE VISIÓN ARTIFICIAL 3D POR COMPONENTE, 2023 VS 2030 (MILLONES DE USD)
    42. FIGURA 43 RESTO DEL MUNDO: MERCADO DE VISIÓN ARTIFICIAL 3D POR HARDWARE, 2023 VS 2030 (MILLONES DE USD)
    43. FIGURA 44 RESTO DEL MUNDO: MERCADO DE VISIÓN ARTIFICIAL 3D POR PRODUCTO, 2023 VS 2030 (MILLONES DE USD)
    44. FIGURA 45 RESTO DEL MUNDO: MERCADO DE VISIÓN ARTIFICIAL 3D, POR APLICACIÓN, 2023 VS 2030 (MILLONES DE USD)
    45. FIGURA 46 RESTO DEL MUNDO: MERCADO DE VISIÓN ARTIFICIAL 3D, POR USUARIO FINAL, 2023 VS 2030 (MILLONES DE USD)
    46. FIGURA 47 CUOTA DE MERCADO DE LOS PRINCIPALES AGENTES, 2023 (%)
    47. FIGURA 48 ANÁLISIS COMPETITIVO DEL MERCADO DE VISIÓN ARTIFICIAL 3D
    48. FIGURA 49 OMRON CORPORATION: RESUMEN FINANCIERO
    49. FIGURA 50 OMRON CORPORATION: ANÁLISIS FODA
    50. FIGURA 51 CANON INC.: RESUMEN FINANCIERO
    51. FIGURA 52 CANON INC.: ANÁLISIS FODA
    52. FIGURA 53 COGNEX CORPORATION: RESUMEN FINANCIERO
    53. FIGURA 54 COGNEX CORPORATION: ANÁLISIS FODA
    54. FIGURA 55 NATIONAL INSTRUMENTS: RESUMEN FINANCIERO
    55. FIGURA 56 NATIONAL INSTRUMENTS: ANÁLISIS FODA
    56. FIGURA 57 KEYENCE CORPORATION: RESUMEN FINANCIERO
    57. FIGURA 58 KEYENCE CORPORATION: ANÁLISIS FODA
    58. FIGURA 59 SONY CORPORATION: RESUMEN FINANCIERO
    59. FIGURA 60 SONY CORPORATION: ANÁLISIS FODA
    60. FIGURA 61 COHERENT, INC.: INFORMACIÓN FINANCIERA INSTANTÁNEA
    61. FIGURA 62 BASLER AG: INSTANTÁNEA FINANCIERA

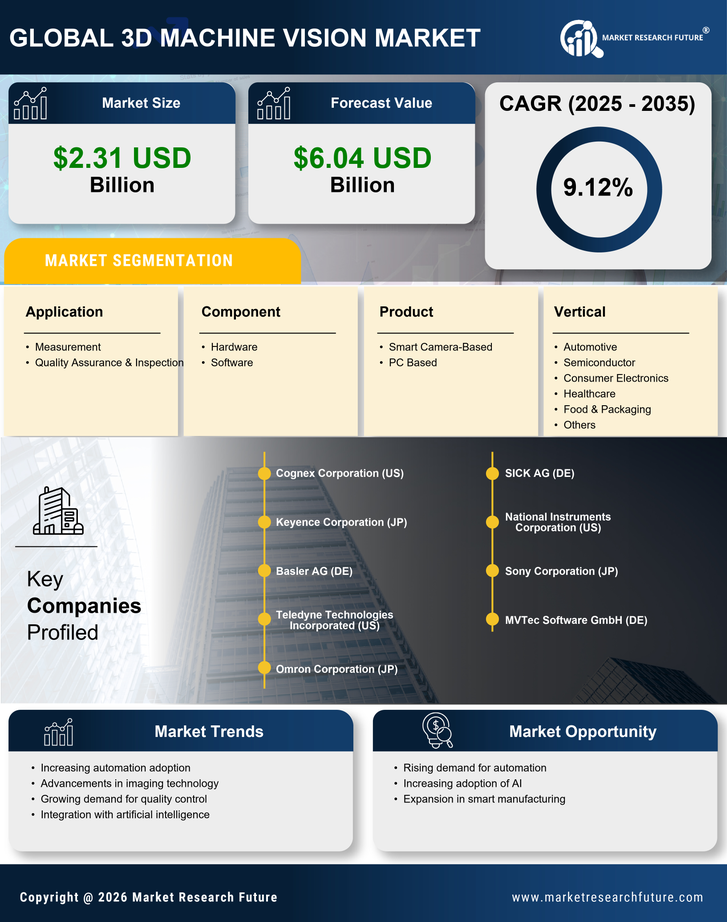
Segmentación del mercado de visión artificial 3DVisión artificial 3D

Perspectiva de los componentes de visión artificial 3D (miles de millones de USD, 2019-2030)

  • Hardware

  • Software

Perspectiva de los productos de visión artificial 3D (miles de millones de USD, 2019-2030)

  • Basados ​​en cámaras inteligentes

  • Basados ​​en PC

Perspectiva de las aplicaciones de visión artificial 3D (miles de millones de USD, 2019-2030)

  • Medición

  • Aseguramiento de la calidad y Inspección

Perspectiva vertical de la visión artificial 3D (miles de millones de USD, 2019-2030)

  • Automotriz

  • Semiconductores

  • Electrónica de consumo

  • Salud

  • Alimentos, envases y otros

Perspectiva regional de la visión artificial 3D (miles de millones de USD, 2019-2030)

  • Perspectiva de América del Norte (miles de millones de USD, 2019-2030)

    • Visión artificial 3D en América del Norte por componente

      • Hardware

      • Software

    • Visión artificial 3D en América del Norte por producto

      • Basada en cámara inteligente

      • Basada en PC

    • Visión artificial 3D en América del Norte por aplicación

      • Medición

      • Aseguramiento de la calidad y Inspección

    • Visión artificial 3D en Norteamérica por sector

      • Automotriz

      • Semiconductores

      • Electrónica de consumo

      • Salud

      • Alimentos, envases y otros

    • Perspectivas de EE. UU. (miles de millones de USD, 2019-2030)

    • Visión artificial 3D en EE. UU. por Componente

      • Hardware

      • Software

    • Visión artificial 3D de EE. UU. por producto

      • Basado en cámara inteligente

      • Basado en PC

    • Visión artificial 3D de EE. UU. por aplicación

      • Medición

      • Garantía de calidad y Inspección

    • Visión artificial 3D en EE. UU. por sector

      • Automotriz

      • Semiconductores

      • Electrónica de consumo

      • Salud

      • Alimentos, envases y otros

    • Perspectivas de Canadá (miles de millones de USD, 2019-2030)

    • Visión artificial 3D en Canadá por Componente

      • Hardware

      • Software

    • Visión artificial 3D de Canadá por producto

      • Basado en cámara inteligente

      • Basado en PC

    • Visión artificial 3D de Canadá por aplicación

      • Medición

      • Garantía de calidad y Inspección

    • CANADÁ Visión Artificial 3D por Sector

      • Automotriz

      • Semiconductores

      • Electrónica de Consumo

      • Salud

      • Alimentos y Empaques, entre otros

  • Perspectivas para Europa (Miles de millones de USD, 2019-2030)

    • Europa Visión Artificial 3D por Componente

      • Hardware

      • Software

    • Visión artificial 3D en Europa por producto

      • Basado en cámara inteligente

      • Basado en PC

    • Visión artificial 3D en Europa por aplicación

      • Medición

      • Garantía de calidad y Inspección

    • Visión artificial 3D en Europa por sector

      • Automoción

      • Semiconductores

      • Electrónica de consumo

      • Salud

      • Alimentos, envases y otros

    • Alemania Perspectivas (miles de millones de USD, 2019-2030)

    • Visión artificial 3D en Alemania por Componente

      • Hardware

      • Software

    • Visión artificial 3D en Alemania por producto

      • Basado en cámara inteligente

      • Basado en PC

    • Visión artificial 3D en Alemania por aplicación

      • Medición

      • Garantía de calidad y Inspección

    • Visión artificial 3D en Alemania por sector

      • Automoción

      • Semiconductores

      • Electrónica de consumo

      • Salud

      • Alimentos, envases y otros

    • Perspectivas para Francia (miles de millones de USD, 2019-2030)

    • Visión artificial 3D en Francia por componente

      • Hardware

      • Software

    • Francia Visión artificial 3D por producto

      • Basado en cámara inteligente

      • Basado en PC

    • Visión artificial 3D en Francia por aplicación

      • Medición

      • Garantía de calidad y Inspección

    • Visión artificial 3D en Francia por sector

      • Automoción

      • Semiconductores

      • Electrónica de consumo

      • Sanidad

      • Alimentos, envases y otros

    • Perspectivas para el Reino Unido (miles de millones de USD, 2019-2030)

    • Visión artificial 3D en el Reino Unido por Componente

      • Hardware

      • Software

    • Visión artificial 3D en el Reino Unido por producto

      • Basado en cámara inteligente

      • Basado en PC

    • Visión artificial 3D en el Reino Unido por aplicación

      • Medición

      • Garantía de calidad y Inspección

    • Visión artificial 3D en el Reino Unido por sector

      • Automoción

      • Semiconductores

      • Electrónica de consumo

      • Sanidad

      • Alimentos, envases y otros

    • ITALIAPerspectivas (miles de millones de USD, 2019-2030)

    • ITALIA Visión artificial 3D por sector Componente

      • Hardware

      • Software

    • Visión artificial 3D en Italia por producto

      • Basado en cámara inteligente

      • Basado en PC

    • Visión artificial 3D en Italia por aplicación

      • Medición

      • Garantía de calidad y Inspección

    • ITALIA Visión Artificial 3D por Vertical

      • Automoción

      • Semiconductores

      • Electrónica de Consumo

      • Sanidad

      • Alimentos y Envases y Otros

    • ESPAÑAPerspectivas (Miles de millones de USD, 2019-2030)

    • España Visión Artificial 3D por Componente

      • Hardware

      • Software

    • Visión artificial 3D en España por producto

      • Basado en cámara inteligente

      • Basado en PC

    • Visión artificial 3D en España por aplicación

      • Medición

      • Control de calidad y Inspección

    • Visión artificial 3D en España por sector

      • Automoción

      • Semiconductores

      • Electrónica de consumo

      • Sanidad

      • Alimentación, embalajes y otros

    • Perspectivas para el resto de Europa (miles de millones de USD, 2019-2030)

    • Visión artificial 3D para el resto de Europa por Componente

      • Hardware

      • Software

    • Resto de Europa: Visión artificial 3D por producto

      • Basado en cámara inteligente

      • Basado en PC

    • Resto de Europa: Visión artificial 3D por aplicación

      • Medición

      • Control de calidad y Inspección

    • Visión artificial 3D en el resto de Europa por sector

      • Automoción

      • Semiconductores

      • Electrónica de consumo

      • Sanidad

      • Alimentos, envases y otros

  • Perspectivas de Asia-Pacífico (miles de millones de USD, 2019-2030)

    • Visión artificial 3D en Asia-Pacífico por Componente

      • Hardware

      • Software

    • Visión artificial 3D en Asia-Pacífico por producto

      • Basado en cámara inteligente

      • Basado en PC

    • Visión artificial 3D en Asia-Pacífico por aplicación

      • Medición

      • Garantía de calidad y Inspección

    • Visión artificial 3D en Asia-Pacífico por sector vertical

      • Automotriz

      • Semiconductores

      • Electrónica de consumo

      • Salud

      • Alimentos, envases y otros

    • Perspectivas de China (miles de millones de USD, 2019-2030)

    • Visión artificial 3D en China por Componente

      • Hardware

      • Software

    • Visión artificial 3D en China por producto

      • Basado en cámara inteligente

      • Basado en PC

    • Visión artificial 3D en China por aplicación

      • Medición

      • Garantía de calidad y Inspección

    • Visión artificial 3D en China por sector

      • Automotriz

      • Semiconductores

      • Electrónica de consumo

      • Salud

      • Alimentos, envases y otros

    • Perspectivas para Japón (miles de millones de USD, 2019-2030)

    • Visión artificial 3D en Japón por Componente

      • Hardware

      • Software

    • Visión artificial 3D en Japón por producto

      • Basado en cámara inteligente

      • Basado en PC

    • Visión artificial 3D en Japón por aplicación

      • Medición

      • Garantía de calidad y Inspección

    • Visión artificial 3D en Japón por sector

      • Automotriz

      • Semiconductores

      • Electrónica de consumo

      • Salud

      • Alimentos, envases y otros

    • Perspectivas de India (miles de millones de USD, 2019-2030)

    • Visión artificial 3D en India por sector Componente

      • Hardware

      • Software

    • Visión artificial 3D en India por producto

      • Basado en cámara inteligente

      • Basado en PC

    • Visión artificial 3D en India por aplicación

      • Medición

      • Garantía de calidad y Inspección

    • Visión artificial 3D en India por sector

      • Automotriz

      • Semiconductores

      • Electrónica de consumo

      • Salud

      • Alimentos, envases y otros

    • Perspectivas de Australia (miles de millones de USD, 2019-2030)

    • Visión artificial 3D en Australia por sector Componente

      • Hardware

      • Software

    • Visión artificial 3D de Australia por producto

      • Basado en cámara inteligente

      • Basado en PC

    • Visión artificial 3D de Australia por aplicación

      • Medición

      • Control de calidad y Inspección

    • Visión artificial 3D en Australia por sector vertical

      • Automotriz

      • Semiconductores

      • Electrónica de consumo

      • Salud

      • Alimentos, embalajes y otros

    • Perspectivas para el resto de Asia-Pacífico (miles de millones de USD, 2019-2030)

    • Visión artificial 3D para el resto de Asia-Pacífico por Componente

      • Hardware

      • Software

    • Resto de Asia-Pacífico: Visión Artificial 3D por Producto

      • Basado en Cámara Inteligente

      • Basado en PC

    • Resto de Asia-Pacífico: Visión Artificial 3D por Aplicación

      • Medición

      • Control de Calidad y Inspección

    • Visión artificial 3D en el resto de Asia-Pacífico por sector vertical

      • Automotriz

      • Semiconductores

      • Electrónica de consumo

      • Salud

      • Alimentos, envases y otros

  • Perspectivas para el resto del mundo (miles de millones de USD, 2019-2030)

    • Visión artificial 3D en el resto del mundo por Componente

      • Hardware

      • Software

    • Visión artificial 3D del resto del mundo por producto

      • Basado en cámara inteligente

      • Basado en PC

    • Visión artificial 3D del resto del mundo por aplicación

      • Medición

      • Aseguramiento de la calidad y Inspección

    • Visión artificial 3D en el resto del mundo por sector

      • Automotriz

      • Semiconductores

      • Electrónica de consumo

      • Salud

      • Alimentos, envases y otros

    • Perspectivas para Oriente Medio (miles de millones de USD, 2019-2030)

    • Visión artificial 3D en Oriente Medio por Componente

      • Hardware

      • Software

    • Visión artificial 3D en Oriente Medio por producto

      • Basado en cámara inteligente

      • Basado en PC

    • Visión artificial 3D en Oriente Medio por aplicación

      • Medición

      • Garantía de calidad y Inspección

    • Visión artificial 3D en Oriente Medio por sector

      • Automoción

      • Semiconductores

      • Electrónica de consumo

      • Salud

      • Alimentos, envases y otros

    • Perspectivas para África (miles de millones de USD, 2019-2030)

    • Visión artificial 3D en África por Componente

      • Hardware

      • Software

    • Visión artificial 3D en África por producto

      • Basado en cámara inteligente

      • Basado en PC

    • Visión artificial 3D en África por aplicación

      • Medición

      • Garantía de calidad y Inspección

    • Visión artificial 3D en África por sector

      • Automotriz

      • Semiconductores

      • Electrónica de consumo

      • Salud

      • Alimentos, embalajes y otros

    • Perspectivas para América Latina (miles de millones de USD, 2019-2030)

    • Visión artificial 3D en América Latina por sector Componente

      • Hardware

      • Software

    • Visión artificial 3D en Latinoamérica por producto

      • Basado en cámara inteligente

      • Basado en PC

    • Visión artificial 3D en Latinoamérica por aplicación

      • Medición

      • Aseguramiento de la calidad y Inspección

    • Visión artificial 3D en Latinoamérica por sector

      • Automotriz

      • Semiconductores

      • Electrónica de consumo

      • Salud

      • Alimentos, envases y otros

Compare Licence

×
Features License Type
Single User Multiuser License Enterprise User
Price $4,950 $5,950 $7,250
Maximum User Access Limit 1 User Upto 10 Users Unrestricted Access Throughout the Organization
Free Customization
Direct Access to Analyst
Deliverable Format
Platform Access
Discount on Next Purchase 10% 15% 15%
Printable Versions