• Cat-intel
  • MedIntelliX
  • Resources
  • About Us
  • English
    Chinese
    French
    Japanese
    Korean
    German
    Spanish

    Plastic Tableware Market Size

    ID: MRFR/CR/8883-CR
    100 Pages
    Snehal Singh
    February 2021

    Plastic Tableware Market Research Report Information By Type (Plates, Bowls, Cutlery, Cups & Glasses and Others), Distribution Channel (Store-Based {Supermarkets & Hypermarkets, Convenience Stores and Others} and Non-Store-Based) and Region (North America, Europe, Asia-Pacific and Rest of the World) - Forecast till 2035

    Share:
    Download PDF ×

    We do not share your information with anyone. However, we may send you emails based on your report interest from time to time. You may contact us at any time to opt-out.

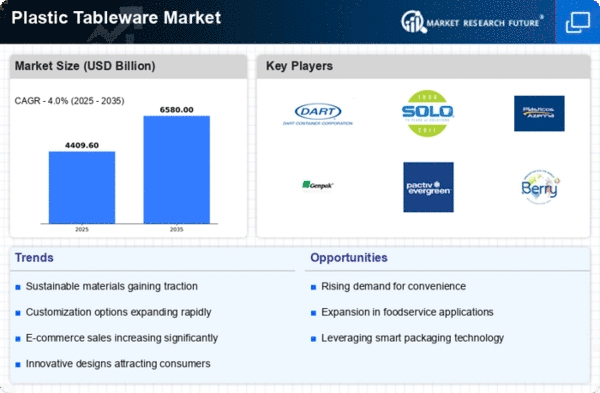
    Plastic Tableware Market Infographic
    $ 4,950.0
    $ 5,950.0
    $ 7,250.0

    Plastic Tableware Size

    Plastic Tableware Market Growth Projections and Opportunities

    The plastic tableware market is subjected to the ever changing marketing conditions which are determined by the interaction of consumer preferences, environmental exploits, and manufacturing technology. Plastic cutlery, encompassing plates, cups, cutlery, and trays, has been used for decades as a convenient item in various contexts, such as picnics and outdoor ceremonies as well as casual indoor dining. This market, in its main, is under control of several forces in form of material advancements that focus on sustainability, and the need for cost-effective and disposable tableware. The consumer likes and dislikes work as a leading force in the formulation of the market polarity of plastic tableware. A wide variety of customers can express their own styles through this market because it has many designs, colors, and sizes that serve different requirements. From individual package plates and cutlery to family size containers and reusable plastic trays, market feeds the demand for multi-function, handy and useful tableware products. Aesthetic factors, that is, the look and feel of the plastic cups, are also among the considerations that consumers make while selecting these goods. The environmental impact now triggers myriad changes in the plastic tableware market. As awareness of plastic pollution and environmental sustainability grows, consumers become more and more aware that single-use plastics are harmful to the environment. This provokes consumers to choose green alternatives and hence market tends to look for bio-degradable, compostable and recyclable materials for plastics. Manufacturers are trying to cope with these trends by designing and manufacturing bio-based plastic tableware items that satisfy eco-conscious values of modern consumers. Advancements in material science technology and manufacturing processes cause a changing scene in plastic tableware industry landscape. The development of new plastics has led to materials which are stronger, heat-resistant, and have superior looks. Manufacturers are paying attention to the new ways that will boost the performance of plastic tableware but will still tackle the concerns regarding environmental problems. The superior technology empowering the production of randomly shaped lightweight plastic tableware helps to satisfy both the functional and aesthetic requirements. Brand image and the quality assessed by the plastic tableware manufacturers are important elements of the dynamics of the competitive environment. Trusted brands not only show up consistently but also manufacture plastic tableware that is more dependable and appealing in design. Nevertheless, the market is prone to new entrants that are affiliated with sustainable practices, unique designs, or improved specific features to tap into consumer attention. Reviews that are positive, certification, and adherence to quality standards are really critical elements in development of brand loyalty.
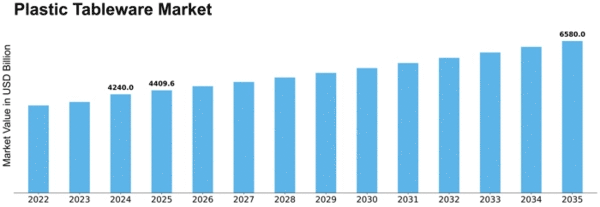
    Plastic Tableware Market Size Graph

    Market Summary

    As per Market Research Future Analysis, the Plastic Tableware Market is anticipated to reach USD 9.323 Billion by 2030, growing at a CAGR of 2.98% from 2022 to 2030. The growth is primarily driven by the foodservice industry's demand for quality dining experiences, with plastic tableware being favored for its convenience and hygiene. The market faced challenges during the COVID-19 pandemic due to lockdowns affecting foodservice operations. However, the recovery is supported by the expansion of restaurants and hotels globally, alongside increasing consumer preference for sanitary dining options. Environmental concerns regarding plastic pollution pose a restraint, yet opportunities arise from the growth of new food service centers. The market is segmented by type into plates, bowls, cutlery, cups & glasses, and others, and by distribution channel into store-based and non-store-based segments, with store-based dominating the market.

    Key Market Trends & Highlights

    The Plastic Tableware Market is witnessing significant growth driven by various factors.

    • Market Size: USD 9.323 Billion by 2030; CAGR: 2.98% (2022-2030)
    • Key Drivers: Growth of foodservice industries including hotels and restaurants.
    • Challenges: COVID-19 pandemic severely impacted market growth.
    • Opportunities: Expansion of new food service centers globally.

    Market Size & Forecast

    Market Size USD 9.323 Billion by 2030
    CAGR 2.98% (2022-2030)
    Major Growth Drivers Foodservice industry expansion
    Key Challenges COVID-19 impact on operations.

    Major Players

    Libbey Inc. (US), Lollicup USA (US), American Greetings Corporation (US), AmerCare (US), Dopla Spa (Italy), Huhtamaki Group (Finland), Solia USA (US), Dart Container Corporation (US), Georgia-Pacific LLC (US), Genpak LLC (US)

    Market Trends

    The ongoing shift towards sustainable practices in consumer behavior appears to be driving innovation in the plastic tableware sector, as manufacturers increasingly explore biodegradable and recyclable materials to meet evolving environmental standards.

    U.S. Environmental Protection Agency

    Plastic Tableware Market Market Drivers

    Rising Demand for Convenience Products

    The Global Plastic Tableware Market Industry experiences a notable surge in demand for convenience products, driven by the fast-paced lifestyle of consumers. As people increasingly seek quick and easy meal solutions, plastic tableware offers a practical alternative to traditional dinnerware. This trend is particularly evident in urban areas where busy schedules necessitate disposable options. The market is projected to reach 25 USD Billion in 2024, reflecting the growing preference for lightweight and portable tableware. This shift towards convenience is likely to sustain the industry's growth, as consumers prioritize efficiency without compromising on aesthetics.

    Market Segment Insights

    Plastic Tableware Market Segmentation Insights

    Get more detailed insights about Plastic Tableware Market Research Report -Forecast till 2027

    Regional Insights

    Key Companies in the Plastic Tableware Market market include

    Industry Developments

      • According to the news, Hong Kong’s Environmental Protection Department has launched a public consultation of two months on the ongoing Scheme on Regulation of Disposable Plastic Tableware.
      • Australia’s supermarket Coles has removed the single-use plastic tableware and replaced it with sustainable alternatives.
      • According to the recent updates, the US region is boosting the imports of kitchenware and plastic tableware.

    Report Overview

    The report's overview shows the development of the Plastic tableware market across the world. The effective role of key market drivers and the widespread marketing opportunities is propelling the market's growth rate. The key players check the other growth hampering factors to run the business smoothly. The awareness of plastic pollution and a plastic-free environment affected the Plastic tableware market. But the replacement of biodegradable plastics further lifted the market to regain its growth rate. The COVID-19 challenging situation was a tough period for the Plastic tableware market, but the strategies implemented by the key players helped the market restore its growth rate.

    The various segments of the market reach the highest CAGR because of the largest share value in the market. The regional report shows the development of the Plastic tableware market Forecast in various regions with the key growth drivers of the regions. If its growth consistency continues, the market is estimated to witness a good CAGR during the review period.

    Future Outlook

    Plastic Tableware Market Future Outlook

    The Plastic Tableware Market is projected to grow at a 4.37% CAGR from 2024 to 2035, driven by sustainability trends, convenience, and rising consumer demand.

    New opportunities lie in:

    • Develop biodegradable plastic tableware to meet eco-conscious consumer preferences.
    • Expand distribution channels in emerging markets to capture new customer segments.
    • Innovate designs for reusable plastic tableware to enhance user experience and brand loyalty.

    By 2035, the Plastic Tableware Market is expected to achieve substantial growth, reflecting evolving consumer preferences and sustainability initiatives.

    Market Segmentation

    Plastic Tableware Market Segmentation Insights

    By Type
    • Plates
    • Bowls
    • Cutlery
    • Cups & Glasses
    • Others
    By Distribution Channel
    • Store-Based
    • Supermarkets & Hypermarkets
    • Convenience Stores
    • Others
    • Non-Store-Based

    Report Scope

    {"0"=>{"market_size"=>"USD 9,323.2 Million"}, "1"=>{"cagr"=>"2.98% (2020-2027)"}, "2"=>{"base_year"=>"2019"}, "3"=>{"forecast_period"=>"2020-2027"}, "4"=>{"historical_data"=>"2018"}, "5"=>{"forecast_units"=>"Value (USD Million)"}, "6"=>{"report_coverage"=>"Revenue Forecast, Competitive Landscape, Growth Factors, and Trends"}, "7"=>{"segments_covered"=>"By Type, Distribution Channel, and Region"}, "8"=>{"geographies_covered"=>"North America, Europe, Asia-Pacific, and Rest of the World (RoW)"}, "9"=>{"key_vendors"=>"Libbey Inc. (US), Lollicup USA (US), American Greetings Corporation (US), AmerCare (US), Dopla Spa (Italy), Huhtamaki Group (Finland), Solia USA (US), Dart Container Corporation (US), Georgia-Pacific LLC (US), and Genpak LLC (US)"}, "10"=>{"key_market_opportunities"=>"Growing Trend Of Customized Plastic Tableware, Shifting Inclination Towards The Use Of Biodegradable Plastics"}, "11"=>{"key_market_drivers"=>"Growth Of The Foodservice Industry, High Consumer Preference For Convenience Products, Growth Of The Organized Retail Sector In Asia-Pacific"}}

    Market Highlights

    Author

    Snehal Singh
    Assistant Manager - Research

    She holds an experience of about 6+ years in market research and business consulting, working under the spectrum of information communication technology, telecommunications and semiconductor domains. aarti conceptualizes and implements a scalable business strategy and provides strategic leadership to the clients. her expertise lies in market estimation, competitive intelligence, pipeline analysis, customer assessment, etc.

    Leave a Comment

    Latest Comments

    John Doe
    john@example.com

    This is a great article! Really helped me understand the topic better.

    Posted on July 23, 2025, 10:15 AM
    Jane Smith
    jane@domain.com

    Thanks for sharing this. I’ve bookmarked it for later reference.

    Posted on July 22, 2025, 7:45 PM

    FAQs

    What USD value does the plastic tableware market reach during the forecast period?

    The Plastic Tableware Market Value is worth USD 9,323.2 Million during the forecast period.

    Which region holds the dominating share value of the plastic tableware market?

    The Asia Pacific region holds the dominating share value of the Plastic Tableware Market Forecast.

    Who are the prominent key players of the plastic tableware market?

    The prominent key players of the Plastic Tableware Market are Libbey Inc. (US), Lollicup USA (US), American Greetings Corporation (US), AmerCare (US), Dopla Spa (Italy), Huhtamaki Group (Finland), Solia USA (US), Dart Container Corporation (US), Georgia-Pacific LLC (US), and Genpak LLC (US)

    At what CAGR is the plastic tableware market projected to grow during the forecast period?

    The plastic tableware market projected to grow at a 2.98% CAGR between 2020-200.

    1. Executive Summary
      1. MARKET ATTRACTIVENESS ANALYSIS 14
        1. GLOBAL PLASTIC TABLEWARE MARKET, BY PRODUCT TYPE 15
        2. GLOBAL PLASTIC TABLEWARE MARKET, BY DISTRIBUTION CHANNEL 16
        3. GLOBAL PLASTIC TABLEWARE MARKET, BY REGION 17
    2. Market Introduction
      1. DEFINITION 18
      2. Scope of the Study 18
      3. RESEARCH OBJECTIVE 18
      4. MARKET STRUCTURE 19
      5. KEY BUYING CRITERIA 19
    3. Research Methodology
      1. RESEARCH PROCESS 20
      2. PRIMARY RESEARCH 21
      3. SECONDARY RESEARCH 22
      4. MARKET SIZE ESTIMATION 23
      5. FORECAST MODEL 24
      6. LIST OF ASSUMPTIONS 25
    4. MARKET DYNAMICS
      1. INTRODUCTION 26
      2. DRIVERS 27
        1. GROWTH OF THE FOODSERVICE INDUSTRY 27
        2. HIGH CONSUMER PREFERENCE FOR CONVENIENCE PRODUCTS 27
        3. GROWTH OF THE ORGANIZED RETAIL SECTOR IN ASIA-PACIFIC 28
        4. DRIVERS IMPACT ANALYSIS 28
      3. RESTRAINT 29
        1. BAN ON PLASTIC USE IN VARIOUS COUNTRIES 29
        2. RESTRAINT IMPACT ANALYSIS 30
      4. OPPORTUNITIES 30
        1. GROWING TREND OF CUSTOMIZED PLASTIC TABLEWARE 30
        2. SHIFTING INCLINATION TOWARDS THE USE OF BIODEGRADABLE PLASTICS 30
      5. CHALLENGE 31
        1. INCREASING DEMAND FOR ECO-FRIENDLY TABLEWARE PRODUCTS 31
    5. MARKET FACTOR ANALYSIS
      1. VALUE CHAIN ANALYSIS 32
        1. RAW MATERIAL PROCUREMENT 33
        2. PROCESSING 33
        3. PACKAGING 33
      2. SUPPLY CHAIN ANALYSIS 34
      3. PORTER’S FIVE FORCES MODEL 35
        1. THREAT OF NEW ENTRANTS 36
        2. BARGAINING POWER OF SUPPLIERS 36
        3. THREAT OF SUBSTITUTES 36
        4. BARGAINING POWER OF BUYERS 36
        5. INTENSITY OF RIVALRY 36
    6. IMPACT OF THE COVID-19 OUTBREAK ON THE GLOBAL PLASTIC TABLEWARE MARKET
    7. GLOBAL PLASTIC TABLEWARE MARKET, BY PRODUCT TYPE
      1. OVERVIEW 38
        1. GLOBAL PLASTIC TABLEWARE MARKET ESTIMATES & FORECAST, BY PRODUCT TYPE, 2020-2027 39
      2. PLATES 39
        1. PLATES: MARKET ESTIMATES & FORECAST, BY REGION, 2020-2027 39
      3. BOWLS 40
        1. BOWLS: MARKET ESTIMATES & FORECAST, BY REGION, 2020-2027 40
      4. CUTLERY 40
        1. CUTLERY: MARKET ESTIMATES & FORECAST, BY REGION, 2020-2027 41
      5. CUPS & GLASSES 41
        1. CUPS & GLASSES: MARKET ESTIMATES & FORECAST, BY REGION, 2020-2027 41
      6. OTHERS 42
        1. OTHERS: MARKET ESTIMATES & FORECAST, BY REGION, 2020-2027 42
    8. GLOBAL PLASTIC TABLEWARE MARKET, BY DISTRIBUTION CHANNEL
      1. OVERVIEW 43
        1. GLOBAL PLASTIC TABLEWARE MARKET ESTIMATES & FORECAST, BY DISTRIBUTION CHANNEL, 2020-2027 44
      2. STORE-BASED 44
        1. STORE-BASED: MARKET ESTIMATES & FORECAST, BY REGION, 2020-2027 44
      3. NON-STORE-BASED 45
        1. NON-STORE-BASED: MARKET ESTIMATES & FORECAST, BY REGION, 2020-2027 45
    9. GLOBAL PLASTIC TABLEWARE MARKET, BY REGION
      1. OVERVIEW 46
      2. NORTH AMERICA 48
        1. US 50
        2. CANADA 51
        3. MEXICO 52
      3. EUROPE 53
        1. UK 55
        2. GERMANY 56
        3. FRANCE 57
        4. ITALY 58
        5. SPAIN 59
        6. REST OF EUROPE 60
      4. ASIA-PACIFIC 61
        1. CHINA 63
        2. INDIA 64
        3. JAPAN 65
        4. AUSTRALIA & NEW ZEALAND 66
        5. REST OF ASIA-PACIFIC 67
      5. REST OF THE WORLD 68
        1. SOUTH AMERICA 70
        2. MIDDLE EAST 71
        3. AFRICA 72
    10. Competitive Landscape
      1. INTRODUCTION 73
      2. COMPETITIVE BENCHMARKING 74
      3. KEY DEVELOPMENTS & GROWTH STRATEGIES 74
        1. AGREEMENTS 74
    11. COMPANY PROFILES
      1. LIBBEY, INC. 75
        1. COMPANY OVERVIEW 75
        2. FINANCIAL OVERVIEW 76
        3. PRODUCTS OFFERED 77
        4. KEY DEVELOPMENTS 77
        5. SWOT ANALYSIS 77
        6. KEY STRATEGIES 77
      2. LOLLICUP USA 78
        1. COMPANY OVERVIEW 78
        2. FINANCIAL OVERVIEW 78
        3. PRODUCTS OFFERED 78
        4. KEY DEVELOPMENTS 78
        5. KEY STRATEGIES 78
      3. AMERICAN GREETINGS CORPORATION 79
        1. COMPANY OVERVIEW 79
        2. FINANCIAL OVERVIEW 79
        3. PRODUCTS OFFERED 79
        4. KEY DEVELOPMENTS 79
        5. KEY STRATEGIES 79
      4. AMERCARE 80
        1. COMPANY OVERVIEW 80
        2. FINANCIAL OVERVIEW 80
        3. PRODUCTS OFFERED 80
        4. KEY DEVELOPMENTS 80
        5. SWOT ANALYSIS 81
        6. KEY STRATEGIES 81
      5. DOPLA SPA 82
        1. COMPANY OVERVIEW 82
        2. FINANCIAL OVERVIEW 82
        3. PRODUCTS OFFERED 82
        4. KEY DEVELOPMENTS 82
        5. KEY STRATEGIES 82
      6. HUHTAMAKI GROUP 83
        1. COMPANY OVERVIEW 83
        2. FINANCIAL OVERVIEW 83
        3. PRODUCTS OFFERED 84
        4. KEY DEVELOPMENTS 84
        5. SWOT ANALYSIS 84
        6. KEY STRATEGIES 85
      7. SOLIA USA 86
        1. COMPANY OVERVIEW 86
        2. FINANCIAL OVERVIEW 86
        3. PRODUCTS OFFERED 86
        4. KEY DEVELOPMENTS 87
        5. KEY STRATEGIES 87
      8. DART CONTAINER CORPORATION 88
        1. COMPANY OVERVIEW 88
        2. FINANCIAL OVERVIEW 88
        3. PRODUCTS OFFERED 89
        4. KEY DEVELOPMENTS 89
        5. KEY STRATEGIES 89
      9. GEORGIA-PACIFIC LLC 90
        1. COMPANY OVERVIEW 90
        2. FINANCIAL OVERVIEW 90
        3. PRODUCTS OFFERED 90
        4. KEY DEVELOPMENTS 90
        5. SWOT ANALYSIS 91
        6. KEY STRATEGIES 91
      10. GENPAK LLC 92
        1. COMPANY OVERVIEW 92
        2. FINANCIAL OVERVIEW 92
        3. PRODUCTS OFFERED 92
        4. KEY DEVELOPMENTS 92
        5. SWOT ANALYSIS 93
        6. KEY STRATEGIES 93
    12. REFERENCES
    13. List of Tables and Figures
      1. 13 LIST OF TABLES
      2. TABLE 1 PRIMARY INTERVIEWS 21
      3. TABLE 2 LIST OF ASSUMPTIONS 25
      4. TABLE 3 GLOBAL PLASTIC TABLEWARE MARKET ESTIMATES & FORECAST, BY PRODUCT TYPE, 2020-2027 (USD MILLION) 39
      5. TABLE 4 PLATES: MARKET ESTIMATES & FORECAST, BY REGION, 2020-2027 (USD MILLION) 39
      6. TABLE 5 BOWLS: MARKET ESTIMATES & FORECAST, BY REGION, 2020-2027 (USD MILLION) 40
      7. TABLE 6 CUTLERY: MARKET ESTIMATES & FORECAST, BY REGION, 2020-2027 (USD MILLION) 41
      8. TABLE 7 CUPS & GLASSES: MARKET ESTIMATES & FORECAST, BY REGION, 2020-2027 (USD MILLION) 41
      9. TABLE 8 OTHERS: MARKET ESTIMATES & FORECAST, BY REGION, 2020-2027 (USD MILLION) 42
      10. TABLE 9 GLOBAL PLASTIC TABLEWARE MARKET ESTIMATES & FORECAST, BY DISTRIBUTION CHANNEL, 2020-2027 (USD MILLION) 44
      11. TABLE 10 STORE-BASED: MARKET ESTIMATES & FORECAST, BY REGION, 2020-2027 (USD MILLION) 44
      12. TABLE 11 NON-STORE-BASED: MARKET ESTIMATES & FORECAST, BY REGION, 2020-2027 (USD MILLION) 45
      13. TABLE 12 GLOBAL PLASTIC TABLEWARE MARKET ESTIMATES & FORECAST, BY REGION, 2020-2027 (USD MILLION) 47
      14. TABLE 13 NORTH AMERICA: PLASTIC TABLEWARE MARKET ESTIMATES & FORECAST, BY COUNTRY, 2020-2027 (USD MILLION) 48
      15. TABLE 14 NORTH AMERICA: PLASTIC TABLEWARE MARKET, BY PRODUCT TYPE, 2020-2027 (USD MILLION) 49
      16. TABLE 15 NORTH AMERICA: PLASTIC TABLEWARE MARKET, BY DISTRIBUTION CHANNEL, 2020-2027 (USD MILLION) 49
      17. TABLE 16 US: PLASTIC TABLEWARE MARKET, BY PRODUCT TYPE, 2020-2027 (USD MILLION) 50
      18. TABLE 17 US: PLASTIC TABLEWARE MARKET, BY DISTRIBUTION CHANNEL, 2020-2027 (USD MILLION) 50
      19. TABLE 18 CANADA: PLASTIC TABLEWARE MARKET, BY PRODUCT TYPE, 2020-2027 (USD MILLION) 51
      20. TABLE 19 CANADA: PLASTIC TABLEWARE MARKET, BY DISTRIBUTION CHANNEL, 2020-2027 (USD MILLION) 51
      21. TABLE 20 MEXICO: PLASTIC TABLEWARE MARKET, BY PRODUCT TYPE, 2020-2027 (USD MILLION) 52
      22. TABLE 21 MEXICO: PLASTIC TABLEWARE MARKET, BY DISTRIBUTION CHANNEL, 2020-2027 (USD MILLION) 52
      23. TABLE 22 EUROPE: MARKET ESTIMATES & FORECAST, BY COUNTRY, 2020-2027 (USD MILLION) 53
      24. TABLE 23 EUROPE: PLASTIC TABLEWARE MARKET, BY PRODUCT TYPE, 2020-2027 (USD MILLION) 54
      25. TABLE 24 EUROPE: PLASTIC TABLEWARE MARKET, BY DISTRIBUTION CHANNEL, 2020-2027 (USD MILLION) 54
      26. TABLE 25 UK: PLASTIC TABLEWARE MARKET, BY PRODUCT TYPE, 2020-2027 (USD MILLION) 55
      27. TABLE 26 UK: PLASTIC TABLEWARE MARKET, BY DISTRIBUTION CHANNEL, 2020-2027 (USD MILLION) 55
      28. TABLE 27 GERMANY: PLASTIC TABLEWARE MARKET, BY PRODUCT TYPE, 2020-2027 (USD MILLION) 56
      29. TABLE 28 GERMANY: PLASTIC TABLEWARE MARKET, BY DISTRIBUTION CHANNEL, 2020-2027 (USD MILLION) 56
      30. TABLE 29 FRANCE: PLASTIC TABLEWARE MARKET, BY PRODUCT TYPE, 2020-2027 (USD MILLION) 57
      31. TABLE 30 FRANCE: PLASTIC TABLEWARE MARKET, BY DISTRIBUTION CHANNEL, 2020-2027 (USD MILLION) 57
      32. TABLE 31 ITALY: PLASTIC TABLEWARE MARKET, BY PRODUCT TYPE, 2020-2027 (USD MILLION) 58
      33. TABLE 32 ITALY: PLASTIC TABLEWARE MARKET, BY DISTRIBUTION CHANNEL, 2020-2027 (USD MILLION) 58
      34. TABLE 33 SPAIN: PLASTIC TABLEWARE MARKET, BY PRODUCT TYPE, 2020-2027 (USD MILLION) 59
      35. TABLE 34 SPAIN: PLASTIC TABLEWARE MARKET, BY DISTRIBUTION CHANNEL, 2020-2027 (USD MILLION) 59
      36. TABLE 35 REST OF EUROPE: PLASTIC TABLEWARE MARKET, BY PRODUCT TYPE, 2020-2027 (USD MILLION) 60
      37. TABLE 36 REST OF EUROPE: PLASTIC TABLEWARE MARKET, BY DISTRIBUTION CHANNEL, 2020-2027 (USD MILLION) 60
      38. TABLE 37 ASIA-PACIFIC: MARKET ESTIMATES & FORECAST, BY COUNTRY, 2020-2027 (USD MILLION) 61
      39. TABLE 38 ASIA-PACIFIC: PLASTIC TABLEWARE MARKET, BY PRODUCT TYPE, 2020-2027 (USD MILLION) 62
      40. TABLE 39 ASIA-PACIFIC: PLASTIC TABLEWARE MARKET, BY DISTRIBUTION CHANNEL, 2020-2027 (USD MILLION) 62
      41. TABLE 40 CHINA: PLASTIC TABLEWARE MARKET, BY PRODUCT TYPE, 2020-2027 (USD MILLION) 63
      42. TABLE 41 CHINA: PLASTIC TABLEWARE MARKET, BY DISTRIBUTION CHANNEL, 2020-2027 (USD MILLION) 63
      43. TABLE 42 INDIA: PLASTIC TABLEWARE MARKET, BY PRODUCT TYPE, 2020-2027 (USD MILLION) 64
      44. TABLE 43 INDIA: PLASTIC TABLEWARE MARKET, BY DISTRIBUTION CHANNEL, 2020-2027 (USD MILLION) 64
      45. TABLE 44 JAPAN: PLASTIC TABLEWARE MARKET, BY PRODUCT TYPE, 2020-2027 (USD MILLION) 65
      46. TABLE 45 JAPAN: PLASTIC TABLEWARE MARKET, BY DISTRIBUTION CHANNEL, 2020-2027 (USD MILLION) 65
      47. TABLE 46 AUSTRALIA & NEW ZEALAND: PLASTIC TABLEWARE MARKET, BY PRODUCT TYPE, 2020-2027 (USD MILLION) 66
      48. TABLE 47 AUSTRALIA & NEW ZEALAND: PLASTIC TABLEWARE MARKET, BY DISTRIBUTION CHANNEL, 2020-2027 (USD MILLION) 66
      49. TABLE 48 REST OF ASIA-PACIFIC: PLASTIC TABLEWARE MARKET, BY PRODUCT TYPE, 2020-2027 (USD MILLION) 67
      50. TABLE 49 REST OF ASIA-PACIFIC: PLASTIC TABLEWARE MARKET, BY DISTRIBUTION CHANNEL, 2020-2027 (USD MILLION) 67
      51. TABLE 50 REST OF THE WORLD: MARKET ESTIMATES & FORECAST, BY REGION, 2020-2027 (USD MILLION) 68
      52. TABLE 51 REST OF THE WORLD: PLASTIC TABLEWARE MARKET, BY PRODUCT TYPE, 2020-2027 (USD MILLION) 69
      53. TABLE 52 REST OF THE WORLD: PLASTIC TABLEWARE MARKET, BY DISTRIBUTION CHANNEL, 2020-2027 (USD MILLION) 69
      54. TABLE 53 SOUTH AMERICA: PLASTIC TABLEWARE MARKET, BY PRODUCT TYPE, 2020-2027 (USD MILLION) 70
      55. TABLE 54 SOUTH AMERICA: PLASTIC TABLEWARE MARKET, BY DISTRIBUTION CHANNEL, 2020-2027 (USD MILLION) 70
      56. TABLE 55 MIDDLE EAST: PLASTIC TABLEWARE MARKET, BY PRODUCT TYPE, 2020-2027 (USD MILLION) 71
      57. TABLE 56 MIDDLE EAST: PLASTIC TABLEWARE MARKET, BY DISTRIBUTION CHANNEL, 2020-2027 (USD MILLION) 71
      58. TABLE 57 AFRICA: PLASTIC TABLEWARE MARKET, BY PRODUCT TYPE, 2020-2027 (USD MILLION) 72
      59. TABLE 58 AFRICA: PLASTIC TABLEWARE MARKET, BY DISTRIBUTION CHANNEL, 2020-2027 (USD MILLION) 72
      60. TABLE 59 AGREEMENTS 74
      61. TABLE 60 LIBBEY, INC.: PRODUCTS OFFERED 77
      62. TABLE 61 LOLLICUP USA: PRODUCTS OFFERED 78
      63. TABLE 62 AMERICAN GREETINGS CORPORATION: PRODUCTS OFFERED 79
      64. TABLE 63 AMERCARE: PRODUCTS OFFERED 80
      65. TABLE 64 DOPLA SPA: PRODUCTS OFFERED 82
      66. TABLE 65 DOPLA SPA: KEY DEVELOPMENTS 82
      67. TABLE 66 HUHTAMAKI GROUP: PRODUCTS OFFERED 84
      68. TABLE 67 SOLIA USA: PRODUCTS OFFERED 86
      69. TABLE 68 DART CONTAINER CORPORATION: PRODUCTS OFFERED 89
      70. TABLE 69 GEORGIA-PACIFIC LLC: PRODUCTS OFFERED 90
      71. TABLE 70 GENPAK LLC: PRODUCTS OFFERED 92 14 LIST OF FIGURES
      72. FIGURE 1 MARKET SYNOPSIS 13
      73. FIGURE 2 MARKET ATTRACTIVENESS ANALYSIS: GLOBAL PLASTIC TABLEWARE MARKET, 2020 14
      74. FIGURE 3 GLOBAL PLASTIC TABLEWARE MARKET ANALYSIS, BY PRODUCT TYPE 15
      75. FIGURE 4 GLOBAL PLASTIC TABLEWARE MARKET ANALYSIS, BY DISTRIBUTION CHANNEL 16
      76. FIGURE 5 GLOBAL PLASTIC TABLEWARE MARKET ANALYSIS, BY REGION, 2020 17
      77. FIGURE 6 GLOBAL PLASTIC TABLEWARE MARKET: STRUCTURE 19
      78. FIGURE 7 KEY BUYING CRITERIA FOR PLASTIC TABLEWARE 19
      79. FIGURE 8 RESEARCH PROCESS 20
      80. FIGURE 9 TOP-DOWN AND Bottom-up ApproachES 23
      81. FIGURE 10 MARKET DYNAMICS OVERVIEW 26
      82. FIGURE 11 DRIVERS IMPACT ANALYSIS: GLOBAL PLASTIC TABLEWARE MARKET 28
      83. FIGURE 12 RESTRAINT IMPACT ANALYSIS: GLOBAL PLASTIC TABLEWARE MARKET 30
      84. FIGURE 13 VALUE CHAIN: GLOBAL PLASTIC TABLEWARE MARKET 32
      85. FIGURE 14 GLOBAL PLASTIC TABLEWARE MARKET: SUPPLY CHAIN ANALYSIS 34
      86. FIGURE 15 Porter's Five Forces Analysis OF THE GLOBAL PLASTIC TABLEWARE MARKET 35
      87. FIGURE 16 GLOBAL PLASTIC TABLEWARE MARKET, BY PRODUCT TYPE, 2020 (% SHARE) 38
      88. FIGURE 17 GLOBAL PLASTIC TABLEWARE MARKET, BY PRODUCT TYPE, 2020-2027 (USD MILLION) 38
      89. FIGURE 18 GLOBAL PLASTIC TABLEWARE MARKET SHARE, BY DISTRIBUTION CHANNEL, 2020 (% SHARE) 43
      90. FIGURE 19 GLOBAL PLASTIC TABLEWARE MARKET SIZE, BY DISTRIBUTION CHANNEL, 2020-2027 (USD MILLION) 43
      91. FIGURE 20 GLOBAL PLASTIC TABLEWARE MARKET, BY REGION, 2020-2027 (USD MILLION) 46
      92. FIGURE 21 GLOBAL PLASTIC TABLEWARE MARKET, BY REGION, 2020 (% SHARE) 46
      93. FIGURE 22 NORTH AMERICA: PLASTIC TABLEWARE MARKET SHARE, BY COUNTRY, 2020 (% SHARE) 48
      94. FIGURE 23 EUROPE: PLASTIC TABLEWARE MARKET SHARE, BY COUNTRY, 2020 (% SHARE) 53
      95. FIGURE 24 ASIA-PACIFIC: PLASTIC TABLEWARE MARKET SHARE, BY COUNTRY, 2020 (% SHARE) 61
      96. FIGURE 25 REST OF THE WORLD: PLASTIC TABLEWARE MARKET SHARE, BY REGION, 2020 (% SHARE) 68
      97. FIGURE 26 LIBBEY, INC.: FINANCIAL OVERVIEW SNAPSHOT 76
      98. FIGURE 27 LIBBEY, INC.: SWOT ANALYSIS 77
      99. FIGURE 28 AMERCARE: SWOT ANALYSIS 81
      100. FIGURE 29 HUHTAMAKI GROUP: FINANCIAL OVERVIEW SNAPSHOT 83
      101. FIGURE 30 HUHTAMAKI GROUP: SWOT ANALYSIS 84
      102. FIGURE 31 GEORGIA-PACIFIC LLC: SWOT ANALYSIS 91
      103. FIGURE 32 GENPAK LLC: SWOT ANALYSIS 93

    Plastic Tableware Market Segmentation

    Market Segmentation Overview

    • Detailed segmentation data will be available in the full report
    • Comprehensive analysis by multiple parameters
    • Regional and country-level breakdowns
    • Market size forecasts by segment
    Infographic

    Free Sample Request

    Kindly complete the form below to receive a free sample of this Report

    Get Free Sample

    Customer Strories

    “I am very pleased with how market segments have been defined in a relevant way for my purposes (such as "Portable Freezers & refrigerators" and "last-mile"). In general the report is well structured. Thanks very much for your efforts.”

    Victoria Milne

    Founder
    Case Study
    Chemicals and Materials