• Cat-intel
  • MedIntelliX
  • Resources
  • About Us
  • English
    Chinese
    French
    Japanese
    Korean
    German
    Spanish

    Molecular Modeling Market Analysis

    ID: MRFR/HC/9146-HCR
    131 Pages
    Rahul Gotadki
    October 2025

    Molecular Modeling Market Research Report Information By Product (Software, Services), By Application (Drug Development, Drug Discovery), By End User (Pharmaceutical & Biotechnology Companies, Research & Academic Centers), And By Region (North America, Europe, Asia-Pacific, And Rest Of The World) –Market Forecast Till 2035.

    Share:
    Download PDF ×

    We do not share your information with anyone. However, we may send you emails based on your report interest from time to time. You may contact us at any time to opt-out.

    Molecular Modeling Market Infographic
    $ 4,950.0
    $ 5,950.0
    $ 7,250.0

    Market Analysis

    In-depth Analysis of Molecular Modeling Market Industry Landscape

    The Molecular Modeling Market dynamics are shaped by the convergence of computational technologies, drug discovery advancements, and the increasing importance of predictive modeling in molecular research. Stakeholders in pharmaceuticals, biotechnology, and research institutions must understand these dynamics to leverage molecular modeling tools effectively for drug design, molecular simulations, and understanding biological systems. This is so because it the changes in computational technologies contribute to dynamics. The advancement of high performance computers combined with the development in algorithms and software, provide a better accuracy level as well as efficiency for molecular modeling simulation. This moves makes users interested to adopt those tools are their applications within lifelogical science research . Healthcare industries that grapple to develop the niche for personalized medicine are guided significantly by molecular modeling, and thus dynamics in market stead. Techniques of modeling are aimed at adaptation the treatments individually to genetic profiles, prediction drug responses and optimization therapeutic effects contributing thereby into paradigm shift towards precision medicine. The dynamics are the application of molecular modeling in virtual screening and hit identification. In the initial phases, researcher utilizes computational tools that allow them to virtually screen millions of chemicals from some chemical libraries which will help in identifying potential drug candidates and shrink a list down for compounds needed for tests as well. The use of simulations in order to understand biomolecular interactions is what that gives the shape to market dynamics. Advanced technique through the use of molecular dynamics simulations enables researchers to investigate the dynamic behavior of biological molecules from an atomic level perspective, offering avenues into protein folding models, ligand binding mechanisms and insights as regards to mechanics in regard tot interactions amongst these relevant biomolecular units. This covers dynamics such as greater collaboration in molecular modeling services. Pharmaceutical firms and research institutes partner up with specialized service provider, five to acquire profoundness of acumen as well a discussion for computational resources that help in the creation of such series refers collaborative world which helps hendred efficiently rercahces being we also mdieshare knowledge. Dynamics include regulatory compliance within drug discovery. Due to the significance of molecular modeling in pharmacokinetics, it follows that adherence to regulatory guidelines is imperative. Aligning the modeling results with experimental data increases the credit rating and acceptance of in silico studies by regulatory agencies while submitting. The market drivers comprise the increase in computational toxicology and ADMET prediction. The early determination of the ADMET profiles and potential toxicity facilitated by molecular modeling helps avoid late-stage failures. Market dynamics involve ethical considerations in AI-driven modeling. As AI and ML algorithms become integral to molecular modeling, ethical frameworks are evolving to address concerns related to bias, transparency, and responsible use of computational approaches in scientific research.

    Market Summary

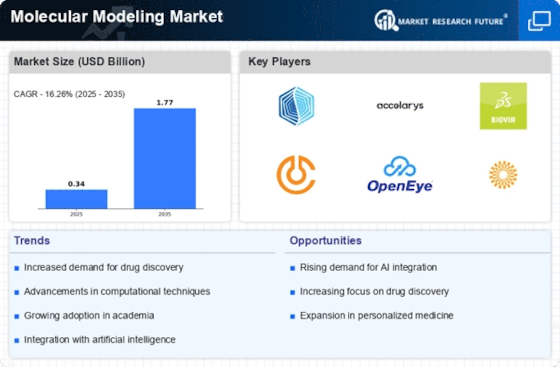
    The Global Molecular Modeling Market is projected to grow from 0.34 USD Billion in 2024 to 1.49 USD Billion by 2035.

    Key Market Trends & Highlights

    Molecular Modeling Key Trends and Highlights

    • The market is expected to experience a compound annual growth rate (CAGR) of 14.47 percent from 2025 to 2035.
    • By 2035, the market valuation is anticipated to reach 1.49 USD Billion, indicating robust growth potential.
    • In 2024, the market is valued at 0.34 USD Billion, reflecting the current investment landscape in molecular modeling.
    • Growing adoption of advanced computational techniques due to increasing demand for drug discovery is a major market driver.

    Market Size & Forecast

    2024 Market Size 0.34 (USD Billion)
    2035 Market Size 1.49 (USD Billion)
    CAGR (2025-2035) 14.47%
    Largest Regional Market Share in 2024 latin_america)

    Major Players

    Simulations Plus, Inc (US), Cambridge Crystallographic Data Centre (England), Optibrium (UK), Cresset (UK), BioSolvelT GmbH (Germany), OpenEye Scientific Software (US), Chemical Computing Group (Canada), Acellera Ltd (London), Dassault Systèmes (France), Schrödinger, LLC (US), Certara, L.P (US)

    Market Trends

    Technological advancements in drug design are driving the market growth

    Molecular modeling is a powerful technique used for drug design. Developing new drugs with therapeutic applications is an important process in the pharmaceutical industry. In drug designing and discovery, experimental and computational techniques represent complementary approaches. However, molecular modeling is a safe and easy-to-use tool that helps investigate, interpret, explain, and identify molecular properties using three-dimensional structures. 

    For instance, 3D modeling software is a powerful tool that helps many professionals create complex 3D graphics and visualize their work. During drug designing, molecular modeling tries to predict the structure of the intermolecular complex formed between two or more constituent molecules. Molecular modeling techniques are used in various fields of computational chemistry, computational biology, and material science to study molecular systems ranging from large biological molecules to small chemical systems. This factor drives the Market CAGR in the forecast period.

    The increasing prevalence of chronic diseases is also expected to propel the growth of better and more advanced therapeutics. In such conditions, the market for molecular modeling is expected to grow during the forecast period. Furthermore, cancer-causing infections, such as hepatitis and human papillomavirus (HPV), account for approximately 30% of cancer cases in low- and lower-middle-income countries. The increasing prevalence of chronic diseases and the added advantage of drug development in providing less expensive drugs are paving the Molecular Modeling market revenue growth.

    The ongoing advancements in computational techniques and the increasing demand for drug discovery are driving transformative changes in the molecular modeling landscape, fostering innovation and collaboration across various scientific disciplines.

    U.S. National Institutes of Health (NIH)

    Molecular Modeling Market Market Drivers

    Market Growth Projections

    The Global Molecular Modeling Market Industry is projected to experience substantial growth over the next decade, with a market valuation of 0.34 USD Billion in 2024 and an anticipated increase to 1.49 USD Billion by 2035. This growth trajectory suggests a compound annual growth rate (CAGR) of 14.47% from 2025 to 2035, reflecting the increasing adoption of molecular modeling techniques across various sectors. The market's expansion is likely driven by advancements in technology, rising demand for drug discovery, and the integration of artificial intelligence, positioning molecular modeling as a pivotal component in scientific research and development.

    Rising Demand for Drug Discovery

    The Global Molecular Modeling Market Industry experiences a notable surge in demand driven by the pharmaceutical sector's need for efficient drug discovery processes. Molecular modeling techniques facilitate the identification and optimization of drug candidates, significantly reducing time and costs associated with traditional methods. In 2024, the market is valued at 0.34 USD Billion, reflecting the industry's growing reliance on computational methods to enhance drug efficacy and safety. As the industry evolves, it is projected that by 2035, the market could reach 1.49 USD Billion, indicating a robust growth trajectory fueled by advancements in molecular simulations and predictive modeling.

    Advancements in Computational Power

    The Global Molecular Modeling Market Industry benefits immensely from advancements in computational power, which enhance the capabilities of molecular modeling software. The integration of high-performance computing and cloud-based solutions allows researchers to conduct complex simulations and analyses that were previously unattainable. This technological evolution not only accelerates research timelines but also improves the accuracy of molecular predictions. As computational resources become more accessible, the market is expected to grow at a CAGR of 14.47% from 2025 to 2035, underscoring the potential for innovative applications across various scientific disciplines.

    Emergence of Artificial Intelligence

    The integration of artificial intelligence (AI) into the Global Molecular Modeling Market Industry represents a transformative shift in how molecular simulations are conducted. AI algorithms can analyze vast datasets, identify patterns, and predict molecular behavior with unprecedented accuracy. This synergy between AI and molecular modeling not only streamlines the research process but also enhances the predictive power of simulations. As AI technologies continue to evolve, their application in molecular modeling is expected to drive market growth, fostering innovations in drug design and materials science.

    Increased Focus on Personalized Medicine

    The Global Molecular Modeling Market Industry is increasingly influenced by the shift towards personalized medicine, which emphasizes tailored therapeutic approaches based on individual patient profiles. Molecular modeling plays a crucial role in understanding the interactions between drugs and biological systems, enabling the design of customized treatment regimens. This trend is particularly relevant in oncology and rare diseases, where precision medicine is gaining traction. The growing emphasis on personalized healthcare solutions is likely to propel the market forward, as stakeholders seek to leverage molecular modeling to enhance treatment outcomes and patient satisfaction.

    Growing Investment in Research and Development

    The Global Molecular Modeling Market Industry is witnessing a surge in investment directed towards research and development initiatives. Governments and private entities are increasingly allocating funds to support innovative projects that leverage molecular modeling for various applications, including drug development and materials science. This influx of capital is anticipated to accelerate technological advancements and foster collaborations between academia and industry. As a result, the market is poised for significant growth, with stakeholders recognizing the value of molecular modeling in driving scientific breakthroughs and enhancing competitive advantage.

    Market Segment Insights

    Molecular Modeling Product Insights

    Based on product, the Molecular Modeling market segmentation includes software and services. The software segment dominated the market; the market growth of this segment is attributed to the growing number of software tools developed for molecular modeling and visualization. Additionally, a growing number of companies engaged in developing molecular modeling software are expected to contribute to the molecular modeling market growth of the segment.

    Figure 1 Molecular Modeling Market, by Product, 2022 & 2032 (USD billion)

    Source Secondary Research, Primary Research, MRFR Database, and Analyst Review

    Molecular Modeling Application Insights

    Based on application, the Molecular Modeling market segmentation includes drug development and drug discovery. The drug development segment dominated the market; the increasing prevalence of various diseases and growing resistance against existing treatment drugs are increasing the demand for identifying new drug targets. The average cost of developing new drug molecules and the time to carry out research technologies are considerably high. Owing to this, many pharmaceutical companies are adopting molecular modeling techniques for drug development. This factor influences the growth of this segment in the molecular modeling market.

    Molecular Modeling End User Insights

    Based on end users, the Molecular Modeling market segmentation includes pharmaceutical & biotechnology companies, research & academic centers. The pharmaceutical & biotechnology companies segment dominated the market due to the rising R&D activities in drug discovery and development is the increasing application of molecular modeling by pharmaceutical and biotechnology companies, which is expected to propel the market growth of this segment.

    Get more detailed insights about Molecular Modeling Market Research Report-Forecast till 2032

    Regional Insights

    By Region, the study provides market insights into North America, Europe, Asia-Pacific, and the Rest of the World. The North American molecular modeling market area will dominate this market, owing to the presence of prominent research institutes and academic organizations promoting open access for research scientists contributes to the growth of the market in this Region.

    Further, the major countries studied in the market report are The U.S., Canada, German, France, the UK, Italy, Spain, China, Japan, India, Australia, South Korea, and Brazil.

    Figure 2 MOLECULAR MODELING MARKET SHARE BY REGION 2022 (%)

    MOLECULAR MODELING MARKET SHARE BY REGION 2022

    Source Secondary Research, Primary Research, MRFR Database, and Analyst Review

    Europe's Molecular Modeling market accounts for the second-largest market share. This is due to the rise in research funding and an increasing number of clinical trials related to theoretical methods and computational techniques used to model or mimic the behavior of molecules.

    Further, the German Molecular Modeling market held the largest market share, and the UK Molecular Modeling market was the fastest-growing market in the European Region.

    The Asia-Pacific Molecular Modeling Market is expected to grow at the fastest CAGR from 2023 to 2032. This is due to the factors such as increasing disposable income, a growing number of research institutes, an increasing number of contract research organizations, and improving healthcare infrastructure. Moreover, China’s Molecular Modeling market held the largest market share, and the Indian Molecular Modeling market was the fastest-growing market in the Asia-Pacific region.

    Key Players and Competitive Insights

    Leading market players are investing heavily in research and development to expand their product lines, which will help the molecular modeling market grow even more. Market participants are also undertaking various strategic activities to expand their footprint, with important market developments including new product launches, contractual agreements, mergers and acquisitions, higher investments, and collaboration with other organizations. The molecular modeling industry must offer cost-effective items to expand and survive in a more competitive and rising market climate.

    Manufacturing locally to minimize operational costs is one of the key business tactics manufacturers use in the Molecular Modeling industry to benefit clients and increase the market sector. The Molecular Modeling industry has offered some of the most significant medical advantages in recent years.

    Major players in the Molecular Modeling market, Americas, Europe, Asia-Pacific, Middle East and Africa Simulations Plus, Inc (US), Cambridge Crystallographic Data Centre (England), Optibrium (UK), Cresset (UK), BioSolvelT GmbH. (Germany), OpenEye Scientific Software (US), Chemical Computing Group (Canada), Acellera Ltd (London), Dassault Systèmes (France), Schrödinger, LLC (US), Certara, L.P (US)., and others are attempting to increase market demand by investing in research and development operations.

    Simulations Plus, Inc. develops absorption, distribution, metabolism, excretion, and toxicity modeling and simulation software for the pharmaceutical and biotechnology, industrial chemicals, cosmetics, food ingredients, and herbicide industries. Simulation Plus (US) released Version 9.8.1 of Gastro Plus. This version added several important new capabilities, including improvements to population simulations, dissolution, absorption, PBPK models, and drug-drug interactions.

    Open Eye Scientific Software is an American software company founded by Anthony Nicholls in 1997. It develops large-scale molecular modeling applications and toolkits. Open Eye Scientific (US) announced the release of Open Eye Applications and Toolkits in 2020. It is designed to reduce the run-time of large-scale conformer generation and consists of an enhanced fragment library with more than 500,000 fragments.

    Key Companies in the Molecular Modeling Market market include

    Industry Developments

    January 2021 Cresset (UK) launched version V2.6 of Cresset workflow components for the KNIME and Pipeline Pilot environments for all desktop solutions. Spark components have been significantly enhanced by including the new 'docking' feature in this version.

    December 2020 Open Eye Scientific (US) announced the release of Open Eye Applications and Toolkits 2020. It is designed to reduce the run-time of large-scale conformer generation and consists of an enhanced fragment library with more than 500,000 fragments.

    November 2020 Cresset (UK) released a new version of Spark V10.6. This latest release includes a new docking functionality to enable users to find novel results not previously mapped by an existing starter or reference molecule.

    Future Outlook

    Molecular Modeling Market Future Outlook

    The Global Molecular Modeling Market is projected to grow at a 14.47% CAGR from 2024 to 2035, driven by advancements in drug discovery, personalized medicine, and computational technologies.

    New opportunities lie in:

    • Develop AI-driven molecular modeling software for enhanced predictive accuracy.
    • Invest in cloud-based platforms for collaborative research and data sharing.
    • Create specialized training programs for professionals in molecular modeling techniques.

    By 2035, the market is expected to achieve substantial growth, reflecting its critical role in scientific innovation.

    Market Segmentation

    Molecular Modeling Regional Outlook

    North America
    • US
    • Canada

    Molecular modeling End User Outlook

    • Pharmaceutical & Biotechnology Companies
    • Research & Academic Centers

    Molecular modeling Products Outlook

    • Software
    • Services

    Molecular Modeling Application Outlook

    • Drug Development
    • Drug Discovery

    Report Scope

    Report Attribute/Metric Details
    Market Size2022 USD 0.25 billion
    Market Size 2023 USD 0.289825 billion
    Market Size2032 USD 0.94558 billion
    Compound Annual Growth Rate (CAGR) 16.26%(2023-2032)
    Base Year 2022
    Market Forecast Period 2023-2032
    Historical Data 2018- 2022
    Market Forecast Units Value (USD Billion)
    Report Coverage Revenue Forecast, Market Competitive Landscape, Growth Factors, and Trends
    Segments Covered Product, Application,End User, and Region
    Geographies Covered North America, Europe, AsiaPacific, and the Rest of the World
    Countries Covered The U.S., Canada, German, France, UK, Italy, Spain, China, Japan, India, Australia, South Korea, and Brazil
    Key Companies Profiled  Americas, Europe, Asia-Pacific, Middle East, and Africa Simulations Plus, Inc (US), Cambridge Crystallographic Data Centre (England), Optibrium (UK), Cresset (UK), BioSolvelT GmbH. (Germany), OpenEye Scientific Software (US), Chemical Computing Group (Canada), Acellera Ltd (London), Dassault Systèmes (France), and Schrödinger, LLC (US), Certara, L.P (US)
    Key Market Opportunities Introduction of molecular modeling software and services in developing economies
    Key Market Dynamics Increasing prevalence of various chronic diseases leading to drug development.

    Market Highlights

    Author

    Rahul Gotadki
    Assistant Manager

    She holds an experience of about 6+ years in market research and business consulting, working under the spectrum of information communication technology, telecommunications and semiconductor domains. aarti conceptualizes and implements a scalable business strategy and provides strategic leadership to the clients. her expertise lies in market estimation, competitive intelligence, pipeline analysis, customer assessment, etc.

    Leave a Comment

    Latest Comments

    John Doe
    john@example.com

    This is a great article! Really helped me understand the topic better.

    Posted on July 23, 2025, 10:15 AM
    Jane Smith
    jane@domain.com

    Thanks for sharing this. I’ve bookmarked it for later reference.

    Posted on July 22, 2025, 7:45 PM

    FAQs

    How much is the Molecular Modeling market?

    The Molecular Modeling market size was valued at USD 0.25 Billion in 2022.

    What is the growth rate of the Molecular Modeling market?

    The market is projected to grow at a CAGR of 16.26%during 2023-2032.

    Which Region held the largest market share in the Molecular Modeling market?

    North America had the largest share of the market

    Who are the key players in the Molecular Modeling market?

    The key players in the market are Americas, Europe, Asia-Pacific, Middle East and Africa Simulations Plus, Inc (US), Cambridge Crystallographic Data Centre (England), Optibrium (UK), Cresset (UK), BioSolvelT GmbH. (Germany), OpenEye Scientific Software (US), Chemical Computing Group (Canada), Acellera Ltd (London), Dassault Systèmes (France), and Schrödinger, LLC (US), Certara, L.P (US).

    Which Product led the Molecular Modeling market?

    The Software Molecular Modeling category dominated the market in 2022.

    Which End User had the largest market share in the Molecular Modeling market?

    The Pharmaceutical & Biotechnology Companies had the largest share of the market.

    1. LIST OF CONTENTS
    2. Executive Summary 15
    3. Market Introduction 16
      1. DEFINITION 16
      2. Scope of the Study 16
      3. RESEARCH OBJECTIVE 16
      4. MARKET STRUCTURE 16
      5. ASSUMPTIONS & LIMITATIONS 17
    4. Research Methodology 18
      1. DATA MINING 18
      2. SECONDARY RESEARCH 19
      3. PRIMARY RESEARCH 19
      4. BREAKDOWN OF PRIMARY RESPONDENTS 20
      5. FORECASTING TECHNIQUES 21
      6. Research Methodology FOR MARKET SIZE ESTIMATION 22
        1. Bottom-up Approach 23
        2. TOP-DOWN APPROACH 23
      7. DATA TRIANGULATION 24
      8. VALIDATION 24
    5. MARKET DYNAMICS 25
      1. OVERVIEW 25
      2. DRIVERS 26
        1. INCREASING PREVALENCE OF VARIOUS CHRONIC DISEASES LEADING TO DRUG DEVELOPMENT 26
        2. TECHNOLOGICAL ADVANCEMENTS IN DRUG DESIGN 26
        3. INCREASING INVESTMENTS IN RESEARCH & DEVELOPMENT BY PHARMACEUTICAL AND BIOTECHNOLOGY COMPANIES 26
      3. RESTRAINTS 27
        1. HIGH COST OF MOLECULAR MODELLING SOFTWARE 27
        2. LACK OF SKILLED HEALTHCARE IT PROFESSIONALS IN LOW AND MIDDLE-INCOME ECONOMIES 27
      4. OPPORTUNITIES 28
        1. INTRODUCTION OF MOLECULAR MODELLING SOFTWARE AND SERVICES IN DEVELOPING ECONOMIES 28
    6. MARKET FACTOR ANALYSIS 29
      1. VALUE CHAIN ANALYSIS 29
        1. INPUTS 30
        2. SOFTWARE DEVELOPMENT PROCESSES 30
        3. OUTPUT 30
        4. MARKETING AND DISTRIBUTION 30
        5. POST-SELLING SERVICES 30
      2. PORTER’S FIVE FORCES MODEL 31
        1. THREAT OF NEW ENTRANTS 32
        2. BARGAINING POWER OF SUPPLIERS 32
        3. BARGAINING POWER OF BUYERS 32
        4. THREAT OF SUBSTITUTES 32
        5. INTENSITY OF RIVALRY 32
      3. COVID-19 IMPACT 33
        1. OVERVIEW 33
        2. IMPACT ON MARKET GROWTH 33
        3. IMPACT ON THE DRUG DESIGN PROCESS 33
        4. IMPACT ON MARKET GROWTH 33
    7. GLOBAL MOLECULAR MODELLING MARKET BY PRODUCT 34
      1. INTRODUCTION 34
      2. SOFTWARE 35
      3. SERVICES 35
    8. GLOBAL: MOLECULAR MODELLING MARKET BY APPLICATION 36
      1. INTRODUCTION 36
      2. DRUG DEVELOPMENT 37
      3. DRUG DISCOVERY 37
      4. OTHERS 39
    9. GLOBAL MOLECULAR MODELLING MARKET BY END USER 40
      1. INTRODUCTION 40
      2. PHARMACEUTICAL & BIOTECHNOLOGY COMPANIES 41
      3. RESEARCH & ACADEMIC CENTERS 41
      4. OTHERS 42
    10. GLOBAL MOLECULAR MODELLING MARKET, BY REGION 43
      1. INTRODUCTION 43
      2. AMERICAS 44
        1. NORTH AMERICA 47
        2. SOUTH AMERICA 51
      3. EUROPE 52
        1. WESTERN EUROPE 54
        2. EASTERN EUROPE 62
      4. ASIA-PACIFIC 64
        1. CHINA 66
        2. INDIA 67
        3. JAPAN 68
        4. AUSTRALIA 69
        5. SOUTH KOREA 70
        6. REST OF ASIA-PACIFIC 71
      5. MIDDLE EAST & AFRICA 72
        1. MIDDLE EAST 74
        2. AFRICA 75
    11. Competitive Landscape 76
      1. OVERVIEW 76
      2. COMPETITIVE BENCHMARKING 77
      3. MAJOR GROWTH STRATEGY IN THE GLOBAL MOLECULAR MODELING MARKET 78
      4. THE LEADING PLAYER IN TERMS OF NUMBER OF DEVELOPMENTS IN THE
    12. GLOBAL MOLECULAR MODELING MARKET 79
      1. KEY DEVELOPMENT ANALYSIS 79
      2. KEY DEVELOPMENTS & GROWTH STRATEGIES 80
        1. PRODUCT LAUNCH/PRODUCT APPROVAL 80
        2. MERGER/ACQUISITION 81
        3. PARTNERSHIP/AGREEMENT/COLLABORATION 81
        4. EXPANSION/INVESTMENT 82
    13. COMPANY PROFILES 83
      1. SIMULATIONS PLUS, INC. 83
        1. COMPANY OVERVIEW 83
        2. FINANCIAL OVERVIEW 84
        3. PRODUCTS/SERVICES OFFERED 85
        4. KEY DEVELOPMENTS 85
        5. SWOT ANALYSIS 86
        6. KEY STRATEGY 86
      2. CAMBRIDGE CRYSTALLOGRAPHIC DATA CENTRE 87
        1. COMPANY OVERVIEW 87
        2. FINANCIAL OVERVIEW 87
        3. PRODUCTS/SERVICES OFFERED 87
        4. KEY DEVELOPMENTS 87
        5. SWOT ANALYSIS 88
        6. KEY STRATEGY 88
      3. OPTIBRIUM 89
        1. COMPANY OVERVIEW 89
        2. FINANCIAL OVERVIEW 89
        3. PRODUCTS/SERVICES OFFERING 89
        4. KEY DEVELOPMENTS 89
        5. SWOT ANALYSIS 90
        6. KEY STRATEGY 90
      4. CRESSET 91
        1. COMPANY OVERVIEW 91
        2. FINANCIAL OVERVIEW 91
        3. PRODUCTS/SERVICES OFFERING 91
        4. KEY DEVELOPMENTS 92
        5. SWOT ANALYSIS 93
        6. KEY STRATEGY 93
      5. BIOSOLVEIT GMBH 94
        1. COMPANY OVERVIEW 94
        2. FINANCIAL OVERVIEW 94
        3. PRODUCTS/SERVICES OFFERING 94
        4. KEY DEVELOPMENTS 95
        5. SWOT ANALYSIS 95
        6. KEY STRATEGY 96
      6. OPENEYE SCIENTIFIC SOFTWARE 97
        1. COMPANY OVERVIEW 97
        2. FINANCIAL OVERVIEW 97
        3. PRODUCTS OFFERING 97
        4. KEY DEVELOPMENTS 98
        5. SWOT ANALYSIS 98
        6. KEY STRATEGY 99
      7. CHEMICAL COMPUTING GROUP 100
        1. COMPANY OVERVIEW 100
        2. FINANCIAL OVERVIEW 100
        3. PRODUCTS OFFERING 100
        4. KEY DEVELOPMENTS 100
        5. SWOT ANALYSIS 101
        6. KEY STRATEGY 101
      8. ACELLERA LTD 102
        1. COMPANY OVERVIEW 102
        2. FINANCIAL OVERVIEW 102
        3. PRODUCTS OFFERING 102
        4. KEY DEVELOPMENTS 102
        5. SWOT ANALYSIS 103
        6. KEY STRATEGY 103
      9. DASSAULT SYSTÈMES 104
        1. COMPANY OVERVIEW 104
        2. FINANCIAL OVERVIEW 105
        3. PRODUCTS/SERVICES OFFERED 106
        4. KEY DEVELOPMENTS 106
        5. SWOT ANALYSIS 106
        6. KEY STRATEGIES 107
      10. SCHRÖDINGER, LLC 108
        1. COMPANY OVERVIEW 108
        2. FINANCIAL OVERVIEW 108
        3. PRODUCTS/SERVICES OFFERED 108
        4. KEY DEVELOPMENTS 108
        5. SWOT ANALYSIS 109
        6. KEY STRATEGIES 109
      11. CERTARA L.P. 110
        1. COMPANY OVERVIEW 110
        2. FINANCIAL OVERVIEW 110
        3. PRODUCTS/SERVICES OFFERED 110
        4. KEY DEVELOPMENTS 110
        5. SWOT ANALYSIS 111
        6. KEY STRATEGIES 111
    14. APPENDIX 112
      1. REFERENCES 112
      2. RELATED REPORTS 112
    15. TABLE CONTENTS
    16. TABLE 1 LIST OF ASSUMPTIONS & LIMITATIONS 17
    17. TABLE 2 PRIMARY INTERVIEWS AND INFORMATION GATHERING PROCESS 20
    18. TABLE 3 GLOBAL: MOLECULAR MODELLING MARKET, BY PRODUCT, 2023-2032 (USD MILLION) 34
    19. TABLE 4 GLOBAL: MOLECULAR MODELLING MARKET, BY SOFTWARE, BY REGION, 2022–2030 (USD MILLION) 35
    20. TABLE 5 GLOBAL: MOLECULAR MODELLING MARKET, BY SERVICES, BY REGION, 2022–2030 (USD MILLION) 35
    21. TABLE 6 GLOBAL: MOLECULAR MODELLING MARKET, BY APPLICATION, 2020 & 2030 (USD MILLION) 36
    22. TABLE 7 GLOBAL: MOLECULAR MODELLING MARKET, BY APPLICATION, 2022–2030 (USD MILLION) 36
    23. TABLE 8 GLOBAL: MOLECULAR MODELLING MARKET, BY DRUG DEVELOPMENT, BY REGION, 2022–2030 (USD MILLION) 37
    24. TABLE 9 GLOBAL: MOLECULAR MODELLING MARKET, BY DRUG DISCOVERY, BY REGION, 2022–2030 (USD MILLION) 37
    25. TABLE 10 GLOBAL: MOLECULAR MODELLING MARKET, FOR DRUG DISCOVERY, BY TYPE, 2022–2030 (USD MILLION) 38
    26. TABLE 11 GLOBAL: MOLECULAR MODELLING MARKET, FOR DIRECT DRUG DESIGN, BY REGION, 2022–2030 (USD MILLION) 38
    27. TABLE 12 GLOBAL: MOLECULAR MODELLING MARKET, FOR INDIRECT DRUG DESIGN, BY REGION, 2022–2030 (USD MILLION) 38
    28. TABLE 13 GLOBAL: MOLECULAR MODELLING MARKET, FOR MOLECULAR MIMICRY, BY REGION, 2022–2030 (USD MILLION) 39
    29. TABLE 14 GLOBAL: MOLECULAR MODELLING MARKET, BY OTHERS, BY REGION, 2022–2030 (USD MILLION) 39
    30. TABLE 15 GLOBAL: MOLECULAR MODELLING MARKET, BY END USER, 2020 & 2030 (USD MILLION) 40
    31. TABLE 16 GLOBAL: MOLECULAR MODELLING MARKET, BY END USER, 2023-2032 (USD MILLION) 40
    32. TABLE 17 GLOBAL: MOLECULAR MODELLING MARKET, BY PHARMACEUTICAL & BIOTECHNOLOGY COMPANIES,
    33. BY REGION, 2022–2030 (USD MILLION) 41
    34. TABLE 18 GLOBAL: MOLECULAR MODELLING MARKET, BY RESEARCH & ACADEMIC CENTERS, BY REGION,
    35. 2022–2030 (USD MILLION) 41
    36. TABLE 19 GLOBAL: MOLECULAR MODELLING MARKET, BY OTHERS, BY REGION, 2022–2030 (USD MILLION) 42
    37. TABLE 20 GLOBAL: MOLECULAR MODELLING MARKET, BY REGION 2020 & 2030 (USD MILLION) 43
    38. TABLE 21 GLOBAL: MOLECULAR MODELLING MARKET, BY REGION 2022–2030 (USD MILLION) 43
    39. TABLE 22 GLOBAL: MOLECULAR MODELLING MARKET SHARE, BY REGION, 2020 (%) 44
    40. TABLE 23 AMERICAS: MOLECULAR MODELLING MARKET, BY REGION, 2022–2030 (USD MILLION) 44
    41. TABLE 24 AMERICAS: MOLECULAR MODELLING MARKET SHARE, BY REGION 2020 (%) 45
    42. TABLE 25 AMERICAS: MOLECULAR MODELLING MARKET, BY PRODUCT, 2022–2030 (USD MILLION) 45
    43. TABLE 26 AMERICAS: MOLECULAR MODELLING MARKET, BY APPLICATION, 2022–2030 (USD MILLION) 45
    44. TABLE 27 AMERICAS: MOLECULAR MODELLING MARKET, BY DRUG DISCOVERY TYPE, 2022–2030 (USD MILLION) 46
    45. TABLE 28 AMERICAS: MOLECULAR MODELLING MARKET, BY END USER , 2022–2030 (USD MILLION) 46
    46. TABLE 29 NORTH AMERICA: MOLECULAR MODELLING MARKET, BY COUNTRY, 2022–2030 (USD MILLION) 47
    47. TABLE 30 NORTH AMERICA: MOLECULAR MODELLING MARKET SHARE, BY COUNTRY, 2020 (%) 47
    48. TABLE 31 NORTH AMERICA: MOLECULAR MODELLING MARKET, BY PRODUCT, 2022–2030 (USD MILLION) 47
    49. TABLE 32 NORTH AMERICA: MOLECULAR MODELLING MARKET, BY APPLICATION, 2022–2030 (USD MILLION) 48
    50. TABLE 33 NORTH AMERICA: MOLECULAR MODELLING MARKET, BY DRUG DISCOVERY TYPE, 2022–2030 (USD MILLION) 48
    51. TABLE 34 NORTH AMERICA: MOLECULAR MODELLING MARKET, BY END USER, 2022–2030 (USD MILLION) 48
    52. TABLE 35 US: MOLECULAR MODELLING MARKET, BY PRODUCT, 2022–2030 (USD MILLION) 49
    53. TABLE 36 US: MOLECULAR MODELLING MARKET, BY APPLICATION, 2022–2030 (USD MILLION) 49
    54. TABLE 37 US: MOLECULAR MODELLING MARKET, BY DRUG DISCOVERY TYPE, 2022–2030 (USD MILLION) 49
    55. TABLE 38 US: MOLECULAR MODELLING MARKET, BY END USER, 2022–2030 (USD MILLION) 49
    56. TABLE 39 CANADA: MOLECULAR MODELLING MARKET, BY PRODUCT, 2022–2030 (USD MILLION) 50
    57. TABLE 40 CANADA: MOLECULAR MODELLING MARKET, BY APPLICATION, 2022–2030 (USD MILLION) 50
    58. TABLE 41 CANADA: MOLECULAR MODELLING MARKET, BY DRUG DISCOVERY TYPE, 2022–2030 (USD MILLION) 50
    59. TABLE 42 CANADA: MOLECULAR MODELLING MARKET, BY END USER, 2022–2030 (USD MILLION) 50
    60. TABLE 43 SOUTH AMERICA: MOLECULAR MODELLING MARKET, BY PRODUCT, 2022–2030 (USD MILLION) 51
    61. TABLE 44 SOUTH AMERICA: MOLECULAR MODELLING MARKET, BY APPLICATION, 2022–2030 (USD MILLION) 51
    62. TABLE 45 SOUTH AMERICA: MOLECULAR MODELLING MARKET, BY DRUG DISCOVERY TYPE, 2022–2030 (USD MILLION) 51
    63. TABLE 46 SOUTH AMERICA: MOLECULAR MODELLING MARKET, BY END USER , 2022–2030 (USD MILLION) 51
    64. TABLE 47 EUROPE: MOLECULAR MODELLING MARKET, BY REGION, 2022–2030 (USD MILLION) 52
    65. TABLE 48 EUROPE: MOLECULAR MODELLING MARKET SHARE, BY REGION 2020 (%) 52
    66. TABLE 49 EUROPE: MOLECULAR MODELLING MARKET, BY PRODUCT, 2022–2030 (USD MILLION) 53
    67. TABLE 50 EUROPE: MOLECULAR MODELLING MARKET, BY APPLICATION, 2023-2032 (USD MILLION) 53
    68. TABLE 51 EUROPE: MOLECULAR MODELLING MARKET, BY DRUG DISCOVERY TYPE, 2023-2032 (USD MILLION) 53
    69. TABLE 52 EUROPE: MOLECULAR MODELLING MARKET, BY END USER , 2023-2032 (USD MILLION) 53
    70. TABLE 53 WESTERN EUROPE: MOLECULAR MODELLING MARKET, BY COUNTRY, 2022–2030 (USD MILLION) 54
    71. TABLE 54 WESTERN EUROPE: MOLECULAR MODELLING MARKET SHARE, BY COUNTRY, 2020 (%) 54
    72. TABLE 55 WESTERN EUROPE: MOLECULAR MODELLING MARKET, BY PRODUCT, 2022–2030 (USD MILLION) 54
    73. TABLE 56 WESTERN EUROPE: MOLECULAR MODELLING MARKET, BY APPLICATION, 2022–2030 (USD MILLION) 55
    74. TABLE 57 WESTERN EUROPE: MOLECULAR MODELLING MARKET, BY DRUG DISCOVERY TYPE, 2022–2030 (USD MILLION) 55
    75. TABLE 58 WESTERN EUROPE: MOLECULAR MODELLING MARKET, BY END USER , 2022–2030 (USD MILLION) 55
    76. TABLE 59 GERMANY: MOLECULAR MODELLING MARKET, BY PRODUCT, 2022–2030 (USD MILLION) 56
    77. TABLE 60 GERMANY: MOLECULAR MODELLING MARKET, BY APPLICATION, 2022–2030 (USD MILLION) 56
    78. TABLE 61 GERMANY: MOLECULAR MODELLING MARKET, BY DRUG DISCOVERY TYPE, 2022–2030 (USD MILLION) 56
    79. TABLE 62 GERMANY: MOLECULAR MODELLING MARKET, BY END USER, 2022–2030 (USD MILLION) 56
    80. TABLE 63 FRANCE: MOLECULAR MODELLING MARKET, BY PRODUCT, 2022–2030 (USD MILLION) 57
    81. TABLE 64 FRANCE: MOLECULAR MODELLING MARKET, BY APPLICATION, 2022–2030 (USD MILLION) 57
    82. TABLE 65 FRANCE: MOLECULAR MODELLING MARKET, BY DRUG DISCOVERY TYPE, 2022–2030 (USD MILLION) 57
    83. TABLE 66 FRANCE: MOLECULAR MODELLING MARKET, BY END USER , 2022–2030 (USD MILLION) 57
    84. TABLE 67 UK MOLECULAR MODELLING MARKET, BY PRODUCT, 2022–2030 (USD MILLION) 58
    85. TABLE 68 UK MOLECULAR MODELLING MARKET, BY APPLICATION, 2023-2032 (USD MILLION) 58
    86. TABLE 69 UK: MOLECULAR MODELLING MARKET, BY DRUG DISCOVERY TYPE, 2022–2030 (USD MILLION) 58
    87. TABLE 70 UK: MOLECULAR MODELLING MARKET, BY END USER, 2022–2030 (USD MILLION) 58
    88. TABLE 71 ITALY: MOLECULAR MODELLING MARKET, BY PRODUCT, 2022–2030 (USD MILLION) 59
    89. TABLE 72 ITALY: MOLECULAR MODELLING MARKET, BY APPLICATION, 2022–2030 (USD MILLION) 59
    90. TABLE 73 ITALY: MOLECULAR MODELLING MARKET, BY DRUG DISCOVERY TYPE, 2022–2030 (USD MILLION) 59
    91. TABLE 74 ITALY: MOLECULAR MODELLING MARKET, BY END USER, 2022–2030 (USD MILLION) 59
    92. TABLE 75 SPAIN: MOLECULAR MODELLING MARKET, BY PRODUCT, 2022–2030 (USD MILLION) 60
    93. TABLE 76 SPAIN: MOLECULAR MODELLING MARKET, BY APPLICATION, 2022–2030 (USD MILLION) 60
    94. TABLE 77 SPAIN: MOLECULAR MODELLING MARKET, BY DRUG DISCOVERY TYPE, 2022–2030 (USD MILLION) 60
    95. TABLE 78 SPAIN: MOLECULAR MODELLING MARKET, BY END USER, 2023-2032 (USD MILLION) 60
    96. TABLE 79 REST OF WESTERN EUROPE: MOLECULAR MODELLING MARKET, BY PRODUCT, 2022–2030 (USD MILLION) 61
    97. TABLE 80 REST OF WESTERN EUROPE: MOLECULAR MODELLING MARKET, BY APPLICATION, 2022–2030 (USD MILLION) 61
    98. TABLE 81 REST OF WESTERN EUROPE: MOLECULAR MODELLING MARKET, BY DRUG DISCOVERY TYPE, 2022–2030 (USD MILLION) 61
    99. TABLE 82 REST OF WESTERN EUROPE: MOLECULAR MODELLING MARKET, BY END USER, 2022–2030 (USD MILLION) 62
    100. TABLE 83 EASTERN EUROPE: MOLECULAR MODELLING MARKET, BY PRODUCT, 2022–2030 (USD MILLION) 62
    101. TABLE 84 EASTERN EUROPE: MOLECULAR MODELLING MARKET, BY APPLICATION, 2022–2030 (USD MILLION) 62
    102. TABLE 85 EASTERN EUROPE: MOLECULAR MODELLING MARKET, BY DRUG DISCOVERY TYPE, 2022–2030 (USD MILLION) 63
    103. TABLE 86 EASTERN EUROPE: MOLECULAR MODELLING MARKET, BY END USER, 2022–2030 (USD MILLION) 63
    104. TABLE 87 ASIA-PACIFIC: MOLECULAR MODELLING MARKET, BY COUNTRY, 2022–2030 (USD MILLION) 64
    105. TABLE 88 ASIA-PACIFIC: MOLECULAR MODELLING MARKET SHARE, BY COUNTRY 2020 (%) 64
    106. TABLE 89 ASIA-PACIFIC: MOLECULAR MODELLING MARKET, BY PRODUCT, 2023-2032 (USD MILLION) 65
    107. TABLE 90 ASIA-PACIFIC: MOLECULAR MODELLING MARKET, BY APPLICATION, 2023-2032 (USD MILLION) 65
    108. TABLE 91 ASIA-PACIFIC: MOLECULAR MODELLING MARKET, BY DRUG DISCOVERY TYPE, 2023-2032 (USD MILLION) 65
    109. TABLE 92 ASIA-PACIFIC: MOLECULAR MODELLING MARKET, BY END USER, 2023-2032 (USD MILLION) 65
    110. TABLE 93 CHINA: MOLECULAR MODELLING MARKET, BY PRODUCT, 2023-2032 (USD MILLION) 66
    111. TABLE 94 CHINA: MOLECULAR MODELLING MARKET, BY APPLICATION, 2023-2032 (USD MILLION) 66
    112. TABLE 95 CHINA: MOLECULAR MODELLING MARKET, BY DRUG DISCOVERY TYPE, 2023-2032 (USD MILLION) 66
    113. TABLE 96 CHINA: MOLECULAR MODELLING MARKET, BY END USER, 2023-2032 (USD MILLION) 66
    114. TABLE 97 INDIA: MOLECULAR MODELLING MARKET, BY PRODUCT, 2023-2032 (USD MILLION) 67
    115. TABLE 98 INDIA: MOLECULAR MODELLING MARKET, BY APPLICATION, 2023-2032 (USD MILLION) 67
    116. TABLE 99 INDIA: MOLECULAR MODELLING MARKET, BY DRUG DISCOVERY TYPE, 2023-2032 (USD MILLION) 67
    117. TABLE 100 INDIA: MOLECULAR MODELLING MARKET, BY END USER, 2023-2032 (USD MILLION) 67
    118. TABLE 101 JAPAN: MOLECULAR MODELLING MARKET, BY PRODUCT, 2023-2032 (USD MILLION) 68
    119. TABLE 102 JAPAN: MOLECULAR MODELLING MARKET, BY APPLICATION, 2023-2032 (USD MILLION) 68
    120. TABLE 103 JAPAN: MOLECULAR MODELLING MARKET, BY DRUG DISCOVERY TYPE, 2023-2032 (USD MILLION) 68
    121. TABLE 104 JAPAN: MOLECULAR MODELLING MARKET, BY END USER, 2023-2032 (USD MILLION) 68
    122. TABLE 105 AUSTRALIA: MOLECULAR MODELLING MARKET, BY PRODUCT, 2023-2032 (USD MILLION) 69
    123. TABLE 106 AUSTRALIA: MOLECULAR MODELLING MARKET, BY APPLICATION, 2023-2032 (USD MILLION) 69
    124. TABLE 107 AUSTRALIA: MOLECULAR MODELLING MARKET, BY DRUG DISCOVERY TYPE, 2023-2032 (USD MILLION) 69
    125. TABLE 108 AUSTRALIA: MOLECULAR MODELLING MARKET, BY END USER, 2023-2032 (USD MILLION) 69
    126. TABLE 109 SOUTH KOREA: MOLECULAR MODELLING MARKET, BY PRODUCT, 2023-2032 (USD MILLION) 70
    127. TABLE 110 SOUTH KOREA: MOLECULAR MODELLING MARKET, BY APPLICATION, 2023-2032 (USD MILLION) 70
    128. TABLE 111 SOUTH KOREA: MOLECULAR MODELLING MARKET, BY DRUG DISCOVERY TYPE, 2023-2032 (USD MILLION) 70
    129. TABLE 112 SOUTH KOREA: MOLECULAR MODELLING MARKET, BY END USER, 2023-2032 (USD MILLION) 70
    130. TABLE 113 REST OF ASIA-PACIFIC: MOLECULAR MODELLING MARKET, BY PRODUCT, 2023-2032 (USD MILLION) 71
    131. TABLE 114 REST OF ASIA-PACIFIC: MOLECULAR MODELLING MARKET, BY APPLICATION, 2023-2032 (USD MILLION) 71
    132. TABLE 115 REST OF ASIA-PACIFIC: MOLECULAR MODELLING MARKET, BY DRUG DISCOVERY TYPE, 2023-2032 (USD MILLION) 71
    133. TABLE 116 REST OF ASIA-PACIFIC: MOLECULAR MODELLING MARKET, BY END USER, 2023-2032 (USD MILLION) 71
    134. TABLE 117 MIDDLE EAST & AFRICA: MOLECULAR MODELLING MARKET, BY COUNTRY, 2022–2030 (USD MILLION) 72
    135. TABLE 118 MIDDLE EAST & AFRICA: MOLECULAR MODELLING MARKET SHARE, BY COUNTRY 2020 (%) 72
    136. TABLE 119 MIDDLE EAST & AFRICA: MOLECULAR MODELLING MARKET, BY PRODUCT, 2023-2032 (USD MILLION) 73
    137. TABLE 120 MIDDLE EAST & AFRICA: MOLECULAR MODELLING MARKET, BY APPLICATION, 2022 – 2030 (USD MILLION) 73
    138. TABLE 121 MIDDLE EAST & AFRICA: MOLECULAR MODELLING MARKET, BY DRUG DISCOVERY TYPE, 2023-2032 (USD MILLION) 73
    139. TABLE 122 MIDDLE EAST & AFRICA: MOLECULAR MODELLING MARKET, BY END USER, 2023-2032 (USD MILLION) 73
    140. TABLE 123 MIDDLE EAST: MOLECULAR MODELLING MARKET, BY PRODUCT, 2023-2032 (USD MILLION) 74
    141. TABLE 124 MIDDLE EAST: MOLECULAR MODELLING MARKET, BY APPLICATION, 2023-2032 (USD MILLION) 74
    142. TABLE 125 MIDDLE EAST: MOLECULAR MODELLING MARKET, BY DRUG DISCOVERY TYPE, 2023-2032 (USD MILLION) 74
    143. TABLE 126 MIDDLE EAST: MOLECULAR MODELLING MARKET, BY END USER, 2023-2032 (USD MILLION) 74
    144. TABLE 127 AFRICA: MOLECULAR MODELLING MARKET, BY PRODUCT, 2023-2032 (USD MILLION) 75
    145. TABLE 128 AFRICA: MOLECULAR MODELLING MARKET, BY APPLICATION, 2023-2032 (USD MILLION) 75
    146. TABLE 129 AFRICA: MOLECULAR MODELLING MARKET, BY DRUG DISCOVERY TYPE, 2023-2032 (USD MILLION) 75
    147. TABLE 130 AFRICA: MOLECULAR MODELLING MARKET, BY END USER, 2023-2032 (USD MILLION) 75
    148. TABLE 131 MAJOR MANUFACTURERS IN THE GLOBAL MOLECULAR MODELING MARKET 76
    149. TABLE 132 MOST ACTIVE PLAYER IN THE GLOBAL MOLECULAR MODELING MARKET 79
    150. TABLE 133 PRODUCT LAUNCH/PRODUCT APPROVAL 80
    151. TABLE 134 MERGER/ACQUISITION 81
    152. TABLE 135 PARTNERSHIP/AGREEMENT/COLLABORATION 81
    153. TABLE 136 EXPANSION/INVESTMENT 82
    154. TABLE 137 SIMULATIONS PLUS, INC.: PRODUCTS/SERVICES OFFERED 85
    155. TABLE 138 SIMULATIONS PLUS, INC.: KEY DEVELOPMENTS 85
    156. TABLE 139 SIMULATIONS PLUS, INC.: PRODUCTS/SERVICES OFFERING 87
    157. TABLE 140 SIMULATIONS PLUS, INC.: KEY DEVELOPMENTS 87
    158. TABLE 141 OPTIBRIUM: PRODUCTS/SERVICES OFFERING 89
    159. TABLE 142 OPTIBRIUM: KEY DEVELOPMENTS 89
    160. TABLE 143 CRESSET: PRODUCTS/SERVICES OFFERING 91
    161. TABLE 144 CRESSET: KEY DEVELOPMENTS 92
    162. TABLE 145 BIOSOLVEIT GMBH: PRODUCTS/SERVICES OFFERING 94
    163. TABLE 146 BIOSOLVEIT GMBH: KEY DEVELOPMENTS OFFERING 95
    164. TABLE 147 OPENEYE SCIENTIFIC SOFTWARE: PRODUCTS/SERVICES OFFERING 97
    165. TABLE 148 OPENEYE SCIENTIFIC SOFTWARE: KEY DEVELOPMENTS OFFERING 98
    166. TABLE 149 CHEMICAL COMPUTING GROUP: PRODUCTS/SERVICES OFFERING 100
    167. TABLE 150 ACELLERA LTD: PRODUCTS/SERVICES OFFERING 102
    168. TABLE 151 ACELLERA LTD: KEY DEVELOPMENTS 102
    169. TABLE 152 DASSAULT SYSTEMES: PRODUCTS/SERVICES OFFERED 106
    170. TABLE 153 SCHRÖDINGER, LLC: PRODUCTS/SERVICES OFFERED 108
    171. TABLE 154 CERTARA LP: PRODUCTS/SERVICES OFFERED 110
    172. List of Tables and Figures
      1. LIST OF FIGURES
      2. FIGURE 1 MARKET SYNOPSIS 15
      3. FIGURE 2 MOLECULAR MODELLING MARKET STRUCTURE 16
      4. FIGURE 3 BOTTOM-UP AND TOP-DOWN APPROACHES 22
      5. FIGURE 4 MARKET DYNAMICS: MOLECULAR MODELLING MARKET 25
      6. FIGURE 5 DRIVERS: IMPACT ANALYSIS 27
      7. FIGURE 6 RESTRAINTS: IMPACT ANALYSIS 28
      8. FIGURE 7 VALUE CHAIN: MOLECULAR MODELING MARKET 29
      9. FIGURE 8 PORTER’S FIVE FORCES ANALYSIS: MOLECULAR MODELING MARKET 31
      10. FIGURE 9 GLOBAL MOLECULAR MODELLING MARKET, BY PRODUCT, 2020 & 2030 (USD MILLION) 34
      11. FIGURE 10 BENCHMARKING OF MAJOR COMPETITORS 77
      12. FIGURE 11 MAJOR STRATEGY ADOPTED BY KEY PLAYERS IN THE GLOBAL MOLECULAR MODELING MARKET 78
      13. FIGURE 12 GLOBAL MOLECULAR MODELLING MARKET: Competitive Landscape 79
      14. FIGURE 13 SIMULATIONS PLUS, INC.: FINANCIAL OVERVIEW SNAPSHOT 84
      15. FIGURE 14 SIMULATIONS PLUS, INC.: SWOT ANALYSIS 86
      16. FIGURE 15 CAMBRIDGE CRYSTALLOGRAPHIC DATA CENTRE: SWOT ANALYSIS 88
      17. FIGURE 16 OPTIBRIUM: SWOT ANALYSIS 90
      18. FIGURE 17 CRESSET: SWOT ANALYSIS 93
      19. FIGURE 18 BIOSOLVEIT GMBH: SWOT ANALYSIS 95
      20. FIGURE 19 OPENEYE SCIENTIFIC SOFTWARE: SWOT ANALYSIS 98
      21. FIGURE 20 CHEMICAL COMPUTING GROUP: SWOT ANALYSIS 101
      22. FIGURE 21 ACELLERA LTD: SWOT ANALYSIS 103
      23. FIGURE 22 DASSAULT SYSTÈMES: SWOT ANALYSIS 105
      24. FIGURE 23 DASSAULT SYSTEMES: SWOT ANALYSIS 106
      25. FIGURE 24 SCHRÖDINGER, LLC: SWOT ANALYSIS 109
      26. FIGURE 25 CERTARA LP: SWOT ANALYSIS 111

    Molecular Modeling Market Segmentation

    Molecular Modeling Product Outlook (USD Billion, 2018-2032)

    • Software
    • Services

    Molecular Modeling Application Outlook (USD Billion, 2018-2032)

    • Drug Development
    • Drug Discovery

    Molecular Modeling End User Outlook (USD Billion, 2018-2032)

    • Pharmaceutical & Biotechnology Companies
    • Research & Academic Centers

    Molecular Modeling Regional Outlook (USD Billion, 2018-2032)

    • North America Outlook (USD Billion, 2018-2032)

      • North America Molecular Modeling by Product
        • Software
        • Services
      • North America Molecular Modeling by Application
        • Drug Development
        • Drug Discovery
      • North America Molecular Modeling by End User
    • Pharmaceutical & Biotechnology Companies
    • Research & Academic Centers
      • US Outlook (USD Billion, 2018-2032)

      • US Molecular Modeling by Product
        • Software
        • Services
    • US Molecular Modeling by Application
        • Drug Development
        • Drug Discovery
      • US Molecular Modeling by End User
    • Pharmaceutical & Biotechnology Companies
    • Research & Academic Centers
      • CANADA Outlook (USD Billion, 2018-2032)

      • CANADA Molecular Modeling by Product
        • Software
        • Services
      • CANADA Molecular Modeling by Application
        • Drug Development
        • Drug Discovery
      • CANADA Molecular Modeling by End User
    • Pharmaceutical & Biotechnology Companies
    • Research & Academic Centers
    • Europe Outlook (USD Billion, 2018-2032)

      • Europe Molecular Modeling by Product
        • Software
        • Services
      • Europe Molecular Modeling by Application
        • Drug Development
        • Drug Discovery
      • Europe Molecular Modeling by End User
    • Pharmaceutical & Biotechnology Companies
    • Research & Academic Centers
      • Germany Outlook (USD Billion, 2018-2032)

      • Germany Molecular Modeling by Product
        • Software
        • Services
      • Germany Molecular Modeling Application

        • Drug Development
        • Drug Discovery
      • Germany Molecular Modeling by End User
    • Pharmaceutical & Biotechnology Companies
    • Research & Academic Centers
      • France Outlook (USD Billion, 2018-2032)

      • France Molecular Modeling by Product
        • Software
        • Services
      • France Molecular Modeling by Application
        • Drug Development
        • Drug Discovery
      • France Molecular Modeling by End User
    • Pharmaceutical & Biotechnology Companies
    • Research & Academic Centers
      • UK Outlook (USD Billion, 2018-2032)

      • UK Molecular Modeling by Product
        • Software
        • Services
      • UK Molecular Modeling by Application
        • Drug Development
        • Drug Discovery
      • UK Molecular Modeling by End User
    • Pharmaceutical & Biotechnology Companies
    • Research & Academic Centers
      • ITALY Outlook (USD Billion, 2018-2032)

      • ITALY Molecular Modeling by Product
        • Software
        • Services
      • ITALY Molecular Modeling by Application
        • Drug Development
        • Drug Discovery
      • ITALY Molecular Modeling by End User
    • Pharmaceutical & Biotechnology Companies
    • Research & Academic Centers
      • SPAIN Outlook (USD Billion, 2018-2032)

      • Spain Molecular Modeling by Product
        • Software
        • Services
      • Spain Molecular Modeling by Application
        • Drug Development
        • Drug Discovery
        • Photodetectors
      • Spain Molecular Modeling by End User
    • Pharmaceutical & Biotechnology Companies
    • Research & Academic Centers
      • Rest Of Europe Outlook (USD Billion, 2018-2032)

      • Rest Of Europe Molecular Modeling by Product
        • Software
        • Services
      • REST OF EUROPE Molecular Modeling by Application
        • Drug Development
        • Drug Discovery
        • Photodetectors
      • REST OF EUROPE Molecular Modeling by End User
    • Pharmaceutical & Biotechnology Companies
    • Research & Academic Centers
    • Asia-Pacific Outlook (USD Billion, 2018-2032)

      • Asia-Pacific Molecular Modeling by Product
        • Software
        • Services
      • Asia-Pacific Molecular Modeling by Application
        • Drug Development
        • Drug Discovery
      • Asia-Pacific Molecular Modeling by End User
    • Pharmaceutical & Biotechnology Companies
    • Research & Academic Centers
      • China Outlook (USD Billion, 2018-2032)

      • China Molecular Modeling by Product
        • Software
        • Services
      • China Molecular Modeling by Application
        • Drug Development
        • Drug Discovery
      • China Molecular Modeling by End User
    • Pharmaceutical & Biotechnology Companies
    • Research & Academic Centers
      • Japan Outlook (USD Billion, 2018-2032)

      • Japan Molecular Modeling by Product
        • Software
        • Services
      • Japan Molecular Modeling by Application
        • Drug Development
        • Drug Discovery
      • Japan Molecular Modeling by End User
    • Pharmaceutical & Biotechnology Companies
    • Research & Academic Centers
      • India Outlook (USD Billion, 2018-2032)

      • India Molecular Modeling by Product
        • Software
        • Services
      • India Molecular Modeling by Application
        • Drug Development
        • Drug Discovery
      • India Molecular Modeling by End User

    • Pharmaceutical & Biotechnology Companies
    • Research & Academic Centers
      • Australia Outlook (USD Billion, 2018-2032)

      • Australia Molecular Modeling by Product
        • Software
        • Services
      • Australia Molecular Modeling by Application
        • Drug Development
        • Drug Discovery
      • Australia Molecular Modeling by End User
    • Pharmaceutical & Biotechnology Companies
    • Research & Academic Centers
      • Rest of Asia-Pacific Outlook (USD Billion, 2018-2032)

      • Rest of Asia-Pacific Molecular Modeling by Product
        • Software
        • Services
      • Rest of Asia-Pacific Molecular Modeling by Application
        • Drug Development
        • Drug Discovery
      • Rest of Asia-Pacific Molecular Modeling by End User
    • Pharmaceutical & Biotechnology Companies
    • Research & Academic Centers
    • Rest of the World Outlook (USD Billion, 2018-2032)

      • Rest of the World Molecular Modeling by Product
        • Software
        • Services
      • Rest of the World Molecular Modeling by Application
        • Drug Development
        • Drug Discovery
      • Rest of the World Molecular Modeling by End User
    • Pharmaceutical & Biotechnology Companies
    • Research & Academic Centers
      • Middle East Outlook (USD Billion, 2018-2032)

      • Middle East Molecular Modeling by Product
        • Software
        • Services
      • Middle East Molecular Modeling by Application
        • Drug Development
        • Drug Discovery
      • Middle East Molecular Modeling by End User
    • Pharmaceutical & Biotechnology Companies
    • Research & Academic Centers
      • Africa Outlook (USD Billion, 2018-2032)

      • Africa Molecular Modeling by Product
        • Software
        • Services
      • Africa Molecular Modeling by Application
        • Drug Development
        • Drug Discovery
        • Photodetectors
      • Africa Molecular Modeling by End User
    • Pharmaceutical & Biotechnology Companies
    • Research & Academic Centers
      • Latin America Outlook (USD Billion, 2018-2032)

      • Latin America Molecular Modeling by Product
        • Software
        • Services
      • Latin America Molecular Modeling by Application
        • Drug Development
        • Drug Discovery
      • Latin America Molecular Modeling by End User
    • Pharmaceutical & Biotechnology Companies
    • Research & Academic Centers
    Infographic

    Free Sample Request

    Kindly complete the form below to receive a free sample of this Report

    Get Free Sample

    Customer Strories

    “I am very pleased with how market segments have been defined in a relevant way for my purposes (such as "Portable Freezers & refrigerators" and "last-mile"). In general the report is well structured. Thanks very much for your efforts.”

    Victoria Milne

    Founder
    Case Study
    Chemicals and Materials