• Cat-intel
  • MedIntelliX
  • Resources
  • About Us
  • Hero Background
    English
    Chinese
    French
    Japanese
    Korean
    German
    Spanish

    Immersive Technology in Retail Industry Market Analysis

    ID: MRFR/ICT/10615-HCR
    128 Pages
    Shubham Munde
    October 2025

    Immersive Technology in Retail Industry Market Research Report Information By Component Hardware (Head-Mounted Display, Gesture Tracking Devices, Projectors & Display Walls), Software/Platform, Services (Professional and Managed)), Technology (Mixed Reality, Virtual Reality, Augmented Reality (AR) and 360 Film), Application (Training & Learning, Emergency Services, Product Development a...

    Share:
    Download PDF ×

    We do not share your information with anyone. However, we may send you emails based on your report interest from time to time. You may contact us at any time to opt-out.

    Immersive Technology in Retail Industry Market Infographic
    $ 4,950.0
    $ 5,950.0
    $ 7,250.0

    Market Analysis

    In-depth Analysis of Immersive Technology in Retail Industry Market Industry Landscape

    Demand for individualized shopping drives immersive technology market development in retail. The deployment of this technology allows companies to distinguish themselves from competitors by offering distinctive shopping experiences. For instance, an augmented reality solution lets people sample things before buying them using their smartphones or specialized AR devices.

    Also important in retail is the incorporation of immersive technology into brick-and-mortar establishments. Retailers are using immersive technology to create interactive, experience-based environments. For instance, AR technology can allow customers to scan products using their mobile phones for additional information about particular items, pricing details or even custom recommendations. Moreover, need for better product visualization and customization has supported uptake of these tools within retailers’ sector. AR and VR solutions enable customers to visualize products in 3D, explore different color and design options, and customize products according to their preferences. Through enhanced product visualization and customization, they enable decision-making abilities among customers thus improving customer confidence and satisfaction levels when it comes to buying decisions. The rise of experiential shopping is also driving immersive technology adoption. Retailers are shifting from transactional to experiential, focusing on memorable consumer encounters. By employing immersive technologies such as AR/VR in creating interactive installations, gamified shopping experiences etc., customers will be lured into physical stores who end up staying there longer before making purchasing decisions. Additionally, e-commerce influence on the market is rising with online purchasing driving adoption of these tools in retail sector. Immersive technologies like AR and VR can be included within e-commerce platforms so that buyers get a more engaging online shopping experience. Such brands could provide users with options like visualizing goods directly inside their homes or visiting virtual showrooms thus connecting online and offline shopping which improve customer experiences and increase e-commerce sales.

    Market Summary

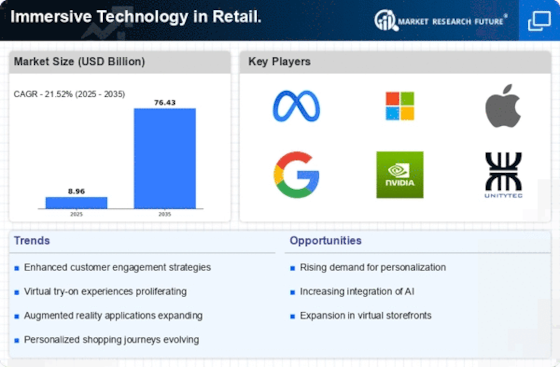
    As per Market Research Future Analysis, the Immersive Technology in Retail Market is projected to grow from USD 10.88 Billion in 2025 to USD 76.43 Billion by 2035, with a CAGR of 21.52% during the forecast period. The market was valued at USD 8.96 Billion in 2024. Key drivers include increased sales and conversion rates, innovative marketing, customer engagement, and the rising acceptance of e-commerce.

    Key Market Trends & Highlights

    The market is witnessing significant trends driven by technological advancements and consumer preferences.

    • Immersive technologies like AR and VR enhance customer interaction, leading to increased sales.
    • AR solutions are particularly popular in fashion and beauty, improving purchase likelihood and reducing returns.
    • Retailers can personalize shopping experiences through data analysis, boosting customer loyalty.
    • The North America market held 45.80% share in 2022, driven by a strong e-commerce ecosystem.

    Market Size & Forecast

    2024 Market Size USD 8.96 Billion.
    2035 Market Size USD 76.43 Billion
    CAGR 21.52%

    Major Players

    Key players include Acer Inc., Atheer, Inc., AVEVA Group PLC, Barco NV, Blippar Ltd., Carl Zeiss AG, Google LLC, HTC Corporation, Lockheed Martin Corporation, Magic Leap, Inc., and Unity Software Inc.

    Market Trends

    Increased sales and conversion rates is driving the market growth

    Customers are now able to interact with products in ways that were previously not feasible through traditional brick-and-mortar or e-commerce purchasing because to immersive technologies like augmented reality (AR) and virtual reality (VR). Customers can virtually place furniture in their living rooms or try on clothes without physically visiting a store thanks to augmented reality (AR) apps. In addition to assisting clients in making more informed decisions about their purchases, this improved product visualization fosters a stronger emotional bond with the goods.

    Customers are therefore more inclined to buy a product when they can clearly see how it will fit, look, or be useful in their own life.

    Retailers may customize the shopping experience to each customer's tastes thanks to immersive technology. Retailers may provide individualized product recommendations and immersive experiences that appeal to certain customers by evaluating customer data and behavior. For instance, an AR app can suggest cosmetics based on a user's skin tone and fashion choices. This degree of personalization builds consumer engagement and loyalty in addition to increasing the likelihood of earning a transaction.

    Shopping becomes a more active experience thanks to immersive technologies. Customers can actively investigate things, look at specifics, and even tailor specific features to suit their preferences. Customers can alter the color, style, or configuration of furniture pieces in real-time in a VR showroom, for example, which makes the buying experience exciting and fun. Customers are more likely to engage with a company for longer periods of time and purchase products as a result of interactive experiences.

    Retailers have the chance to seamlessly cross-sell and upsell products thanks to immersive technology. Retailers can recommend upgrades or related products when buyers interact with a product in an immersive setting, hence raising the average transaction value. For instance, if a consumer is trying on virtual shoes, the system may suggest complementary accessories or extra products that will increase sales. Thus, driving the Immersive Technology in Retail Industry market revenue.

    .webp

    The integration of immersive technologies in retail is reshaping consumer experiences, fostering deeper engagement and personalization that appears to be pivotal in driving future growth within the sector.

    U.S. Department of Commerce

    Immersive Technology in Retail Industry Market Market Drivers

    Technological Advancements

    The Global Immersive Technology in Retail Industry is propelled by rapid technological advancements, particularly in augmented reality (AR) and virtual reality (VR). These technologies enhance customer engagement by providing immersive shopping experiences. For instance, retailers like IKEA utilize AR applications to allow customers to visualize furniture in their homes before purchasing. This trend indicates a growing consumer preference for interactive shopping experiences, which could lead to a market valuation of 8.94 USD Billion in 2024. As these technologies evolve, they are expected to become more accessible, further driving adoption across various retail sectors.

    Market Segment Insights

    Immersive Technology in Retail Industry Component Insights

    The Immersive Technology in Retail Industry market segmentation, based on component, includes Hardware (Head-Mounted Display (HMD), Gesture Tracking Devices (GTD), Projectors & Display Walls (PDW)), Software/Platform, Services (Professional and Managed). The hardware segment dominated the market in 2022. The price of immersive hardware has traditionally been a major deterrent to adoption. Immersive technology is now more affordable for a wider range of shops because to continued hardware cost decreases. Lower hardware prices enable smaller businesses to experiment with immersive solutions without breaking the bank, in addition to attracting larger shops..webp

    Immersive Technology in Retail Industry Technology Insights

    The Immersive Technology in Retail Industry market segmentation, based on technology, includes Mixed Reality (MR), Virtual Reality (VR), Augmented Reality (AR) and 360 Film. The augmented reality (AR) segment dominated the market in 2022. AR-powered virtual try-on solutions are particularly popular in the fashion and beauty sectors. Customers can see how clothing, accessories, or cosmetics will look on them without physically trying them on. This feature increases the likelihood of making a purchase, reduces returns, and enhances the overall shopping experience.

    Immersive Technology in Retail Industry Application Insights

    The Immersive Technology in Retail Industry market segmentation, based on application, includes Training & Learning, Emergency Services, Product Development and Sales & Marketing. The sales & marketing category generated the most income in 2022. Immersive technology allows retailers to present their products in a more captivating and interactive manner. This enhanced product presentation can include 360-degree views, product animations, and detailed 3D models. Such immersive visualizations make it easier for marketing teams to create compelling product content that attracts potential customers and drives sales.

    Figure 2: Immersive Technology in Retail Industry Market, by application, 2022 & 2032 (USD Billion)

    Source: Secondary Research, Primary Research, Market Research Future Database and Analyst Review

    Get more detailed insights about Immersive Technology in Retail Industry Market Research Report – Forecast till 2034

    Regional Insights

    By region, the study provides the market insights into North America, Europe, Asia-Pacific and Rest of the World. The North America Immersive Technology in Retail Industry Market dominated this market in 2022 (45.80%). A strong e-commerce ecosystem exists in the North American market, and immersive technology enhances the convenience of online buying. To give customers immersive and interesting online buying experiences, retailers are integrating AR and VR into their e-commerce platforms. Further, the U.S.

    Immersive Technology in Retail Industry market held the largest market share, and the Canada Immersive Technology in Retail Industry market was the fastest growing market in the North America region.

    Further, the major countries studied in the market report are The U.S., Canada, German, France, the UK, Italy, Spain, China, Japan, India, Australia, South Korea, and Brazil.

    Figure 3: IMMERSIVE TECHNOLOGY IN RETAIL INDUSTRY MARKET SHARE BY REGION 2022 (USD Billion)

    IMMERSIVE TECHNOLOGY IN RETAIL INDUSTRY MARKET SIZE BY REGION.

    Source: Secondary Research, Primary Research, Market Research Future Database and Analyst Review

    Europe Immersive Technology in Retail Industry market accounts for the second-largest market share. In Europe, both technology and art are highly regarded. Due to this cultural openness, consumers and businesses in Europe are more receptive to immersive technology in retail because it frequently mixes creativity and innovation. Further, the German Immersive Technology in Retail Industry market held the largest market share, and the UK Immersive Technology in Retail Industry market was the fastest growing market in the European region.

    The Asia-Pacific Immersive Technology in Retail Industry Market is expected to grow at the fastest CAGR from 2023 to 2032. Asia-Pacific is renowned for having a mobile-first culture and a high smartphone penetration rate. For this mobile-savvy demographic, immersive technological solutions, like AR shopping apps, are especially well suited. Moreover, China’s Immersive Technology in Retail Industry market held the largest market share, and the Indian Immersive Technology in Retail Industry market was the fastest growing market in the Asia-Pacific region.

    Key Players and Competitive Insights

    Leading market players are investing heavily in research and development in order to expand their product lines, which will help the Immersive Technology in Retail Industry market, grow even more. Market participants are also undertaking a variety of strategic activities to expand their footprint, with important market developments including new product launches, contractual agreements, mergers and acquisitions, higher investments, and collaboration with other organizations. To expand and survive in a more competitive and rising market climate, Immersive Technology in Retail Industry industry must offer cost-effective items.

    Manufacturing locally to minimize operational costs is one of the key business tactics used by manufacturers in the Immersive Technology in Retail Industry industry to benefit clients and increase the market sector. In recent years, the Immersive Technology in Retail Industry industry has offered some of the most significant advantages to medicine.

    Major players in the Immersive Technology in Retail Industry market, including Acer Inc., Atheer, Inc., AVEVA Group PLC, Barco NV, Blippar Ltd., Carl Zeiss AG, CM Labs Simulations Inc., EON Reality, Inc., FAAC Incorporated, Google, LLC, HCL Technologies Limited, Honeywell International, Inc., HTC Corporation, Immersive Media Company, Immersive Technologies Pty Limited, Lockheed Martin Corporation, Magic Leap, Inc., NCTech Limited, Oculus (Facebook Technologies, LLC.), Samsung Group, Sony Corporation, Unity Software Inc., Varjo Technologies Oy, VI-grade GmbH, Zeality Inc. and others, are attempting to increase market demand by investing in research and development operations.

    Lockheed Martin Corp. (Lockheed Martin) is a company that produces aerospace and security goods. The business is engaged in the study, creation, manufacture, and integration of high-tech systems, goods, and services. Additionally, it provides services in management, technical, engineering, science, logistics, system integration, and cybersecurity. Military and rotary-wing aircraft, airlifters, ground vehicles, missiles and guided weapons, radar systems, sensors, unmanned systems, and naval systems are among the company's product offerings. For military aircraft, ground vehicles, missile defense systems, satellites, and space transportation systems, Lockheed Martin offers support and upgrade services.

    Both business clients and the US government are served by it. The Americas, Africa, Europe, Asia-Pacific, and the Middle East are all regions in which the organization conducts business. The US city of Bethesda, Maryland, is home to Lockheed Martin's headquarters.

    Magic Leap Inc. (Magic Leap) is a technology company that develops computer software and user interfaces. The company creates light field display technologies for virtual animations and virtual reality experiences. It is possible to buy the Magic Leap One Creator Edition headset. You may experience both the real and virtual worlds thanks to a cutting-edge computing platform called Magic Leap. For web developers, it makes it possible to create and play games as well as browse spatially and extract content. It collaborates with academic institutions, tech firms, and businesses that make motion pictures and television shows.

    The retail, sports, healthcare, and entertainment sectors in the United States. Magic Leap is headquartered in Plantation, Florida, a US city.

    Key Companies in the Immersive Technology in Retail Industry Market market include

    Industry Developments

    • Q2 2025: XR meets Retail Media: The Immersive Frontier of RMNs in 2025 In 2025, major UK retailers including Tesco and Boots launched in-store immersive technology pilots: Tesco deployed AR shelf tags for real-time product information, while Boots introduced smart mirrors for virtual makeup try-on and skin analysis. These initiatives mark a significant step in integrating XR-powered engagement zones and mixed reality displays into physical retail environments.

    Future Outlook

    Immersive Technology in Retail Industry Market Future Outlook

    The Immersive Technology in Retail Industry is projected to grow at a 21.52% CAGR from 2025 to 2035, driven by advancements in AR/VR, consumer engagement, and personalized shopping experiences..webp

    New opportunities lie in:

    • Develop immersive AR applications for enhanced product visualization in-store.
    • Leverage VR for virtual shopping experiences to reach remote customers.
    • Integrate AI with immersive tech for personalized marketing strategies.

    By 2035, the market is expected to be a cornerstone of retail innovation and consumer engagement.

    Market Segmentation

    Immersive Technology in Retail Industry Regional Outlook

    • China
    • Japan
    • India
    • Australia
    • South Korea
    • Rest of Asia-Pacific

    Immersive Technology in Retail Industry Component Outlook

    Hardware
    • Head-Mounted Display (HMD)
    • Gesture Tracking Devices (GTD)
    • Projectors & Display Walls (PDW)

    Immersive Technology in Retail Industry Technology Outlook

    • Mixed Reality (MR)
    • Virtual Reality (VR)
    • Augmented Reality (AR)
    • 360 Film

    Immersive Technology in Retail Industry Application Outlook

    • Training & Learning
    • Emergency Services
    • Product Development
    • Sales & Marketing

    Report Scope

    Report Attribute/Metric Details
    Market Size 2024 8.95 (USD Billion)
    Market Size 2025 10.88 (USD Billion)
    Market Size 2035 76.43 (USD Billion)
    Compound Annual Growth Rate (CAGR) 21.52% (2025 - 2035)
    Report Coverage Revenue Forecast, Competitive Landscape, Growth Factors, and Trends
    Base Year 2024
    Market Forecast Period 2025 - 2035
    Historical Data 2019 - 2023
    Market Forecast Units USD Billion
    Segments Covered Component, Technology, Application, and Region
    Geographies Covered North America, Europe, Asia Pacific, and the Rest of the World
    Countries Covered The U.S., Canada, German, France, UK, Italy, Spain, China, Japan, India, Australia, South Korea, and Brazil
    Key Companies Profiled Acer Inc., Atheer, Inc., AVEVA Group PLC, Barco NV, Blippar Ltd., Carl Zeiss AG, CM Labs Simulations Inc., EON Reality, Inc., FAAC Incorporated, Google, LLC, HCL Technologies Limited, Honeywell International, Inc., HTC Corporation, Immersive Media Company, Immersive Technologies Pty Limited, Lockheed Martin Corporation, Magic Leap, Inc., NCTech Limited, Oculus (Facebook Technologies, LLC.), Samsung Group, Sony Corporation, Unity Software Inc., Varjo Technologies Oy, VI-grade GmbH, Zeality Inc.
    Key Market Opportunities Increasing productivity of consumer goods and services
    Key Market Dynamics Increase in sales and growth in purchasing power.

    Market Highlights

    Author

    Shubham Munde
    Research Analyst Level II

    She holds an experience of about 6+ years in market research and business consulting, working under the spectrum of information communication technology, telecommunications and semiconductor domains. aarti conceptualizes and implements a scalable business strategy and provides strategic leadership to the clients. her expertise lies in market estimation, competitive intelligence, pipeline analysis, customer assessment, etc.

    Leave a Comment

    Latest Comments

    John Doe
    john@example.com

    This is a great article! Really helped me understand the topic better.

    Posted on July 23, 2025, 10:15 AM
    Jane Smith
    jane@domain.com

    Thanks for sharing this. I’ve bookmarked it for later reference.

    Posted on July 22, 2025, 7:45 PM

    FAQs

    How much is the Immersive Technology in Retail Industry market?

    The global Immersive Technology in Retail Industry market size was valued at USD 8.95 Billion in 2024.

    What is the growth rate of the Immersive Technology in Retail Industry market?

    The global market is projected to grow at a CAGR of 21.52% during the forecast period, 2025-2034.

    Which region held the largest market share in the Immersive Technology in Retail Industry market?

    North America had the largest share in the market

    Who are the key players in the Immersive Technology in Retail Industry market?

    The key players in the market are Acer Inc., Atheer, Inc., AVEVA Group PLC, Barco NV, Blippar Ltd., Carl Zeiss AG, CM Labs Simulations Inc., EON Reality, Inc., FAAC Incorporated, Google, LLC, HCL Technologies Limited, Honeywell International, Inc., HTC Corporation, Immersive Media Company, Immersive Technologies Pty Limited, Lockheed Martin Corporation, Magic Leap, Inc., NCTech Limited, Oculus (Facebook Technologies, LLC.), Samsung Group, Sony Corporation, Unity Software Inc., Varjo Technologies Oy, VI-grade GmbH, Zeality Inc.

    Which Technology led the Immersive Technology in Retail Industry market?

    The Augmented Reality (AR) category dominated the market in 2024.

    Which Application had the largest market share in the Immersive Technology in Retail Industry market?

    The Sales & Marketing had the largest share in the market.

    1. Executive summary
    2. Market Introduction
      1. 2.1.
      2. Definition
      3. Scope of the Study
        1. Research Objective
        2. Limitations
      4. 2.2.2.
      5. Assumptions
    3. Research Methodology
      1. 3.1.
      2. Overview
      3. Data Mining
      4. Secondary Research
      5. Primary Research
        1. Breakdown of Primary Respondents
      6. 3.4.1.
      7. Primary Interviews and Information Gathering Process
      8. Forecasting Modality
      9. Market Size Estimation
        1. Top-Down Approach
      10. 3.6.1.
      11. Bottom-Up Approach
      12. Data Triangulation
      13. 3.8.
      14. Validation
    4. Market Dynamics
      1. Overview
      2. Drivers
      3. Restraints
      4. 4.4.
      5. Opportunities
    5. Market Factor Analysis
      1. Value Chain Analysis
        1. Bargaining Power of Suppliers
        2. Threat of New Entrants
        3. Threat
        4. Intensity of Rivalry
      2. 5.2.
      3. Porter’s Five Forces Analysis
      4. 5.2.2.
      5. Bargaining Power of Buyers
      6. of Substitutes
      7. COVID-19 Impact Analysis
        1. Market Impact Analysis
        2. Regional Impact
        3. Opportunity
      8. and Threat Analysis
    6. GLOBAL Immersive Technology in Education sector MARKET,
      1. BY Component
      2. Overview
      3. Hardware
        1. Head-Mounted Display (HMD)
        2. Projectors & Display Walls (PDW)
      4. 6.2.2.
      5. Gesture Tracking Devices (GTD)
      6. 6.3.
      7. Software/Platform
      8. Services
        1. Professional
        2. Managed
      9. 7.
    7. GLOBAL Immersive Technology in Education sector MARKET, BY Technology
      1. 7.1.
      2. Overview
      3. Mixed Reality (MR)
      4. Virtual Reality (VR)
      5. 7.4.
      6. Augmented Reality (AR)
      7. 360 Film
    8. GLOBAL Immersive Technology
    9. in Education sector MARKET, BY Application
      1. Overview
      2. Training
      3. & Learning
      4. Emergency Services
      5. Product Development
      6. 8.5.
      7. Sales & Marketing
    10. GLOBAL Immersive Technology in Education sector MARKET,
      1. by Region
      2. Overview
      3. North America
        1. U.S.
        2. Canada
        3. Germany
        4. France
        5. U.K
        6. Italy
        7. Rest of Europe
      4. 9.3.
      5. Europe
      6. 9.3.5.
      7. Spain
      8. Asia-Pacific
        1. China
        2. India
        3. South Korea
        4. Australia
        5. Rest of Asia-Pacific
        6. Middle East
        7. Africa
        8. Latin America
      9. 9.4.3.
      10. Japan
      11. 9.5.
      12. Rest of the World
      13. 10.
      14. Competitive Landscape
      15. Overview
      16. Competitive Analysis
      17. 10.3.
      18. Market Share Analysis
      19. Major Growth Strategy in the Global Immersive Technology
      20. in Education sector Market,
      21. Competitive Benchmarking
      22. Leading
      23. Players in Terms of Number of Developments in the Global Immersive Technology in
      24. Education sector Market,
      25. Key developments and Growth Strategies
        1. Merger & Acquisitions
      26. 10.7.1.
      27. New Component Launch/Technology Application
      28. 10.7.3.
      29. Joint Ventures
      30. Major Players Financial Matrix
        1. Sales & Operating
        2. Major Players R&D Expenditure. 2022
      31. Income, 2022
    11. Company
      1. ProfileS
      2. ACER INC.
        1. Company Overview
        2. Financial Overview
        3. Key Developments
        4. SWOT Analysis
      3. 11.1.3.
      4. Product Offered
      5. 11.1.6.
      6. Key Strategies
      7. Atheer, Inc.
        1. Company Overview
        2. Product Offered
        3. Key Developments
        4. Key Strategies
      8. 11.2.2.
      9. Financial Overview
      10. 11.2.5.
      11. SWOT Analysis
      12. AVEVA Group PLC
        1. Financial Overview
        2. Product Offered
        3. SWOT Analysis
        4. Key Strategies
        5. Company Overview
        6. Financial Overview
        7. Key Developments
        8. SWOT Analysis
      13. 11.3.1.
      14. Company Overview
      15. 11.3.4.
      16. Key Developments
      17. 11.4.
      18. Barco NV
      19. 11.4.3.
      20. Product Offered
      21. 11.4.6.
      22. Key Strategies
      23. Blippar Ltd.
        1. Company Overview
        2. Product Offered
        3. Key Developments
        4. Key Strategies
      24. 11.5.2.
      25. Financial Overview
      26. 11.5.5.
      27. SWOT Analysis
      28. Carl Zeiss AG
        1. Financial Overview
        2. Product Offered
        3. SWOT Analysis
        4. Key Strategies
        5. Company Overview
        6. Financial Overview
        7. Key Developments
        8. SWOT Analysis
      29. 11.6.1.
      30. Company Overview
      31. 11.6.4.
      32. Key Developments
      33. 11.7.
      34. CM Labs Simulations Inc.
      35. 11.7.3.
      36. Product Offered
      37. 11.7.6.
      38. Key Strategies
      39. EON Reality, Inc.
        1. Company Overview
        2. Product Offered
        3. Key Developments
        4. Key Strategies
      40. 11.8.2.
      41. Financial Overview
      42. 11.8.5.
      43. SWOT Analysis
      44. FAAC Incorporated
        1. Financial Overview
        2. Product Offered
        3. SWOT Analysis
        4. Key Strategies
        5. Company Overview
        6. Financial Overview
        7. Key Developments
        8. SWOT Analysis
      45. 11.9.1.
      46. Company Overview
      47. 11.9.4.
      48. Key Developments
      49. 11.10.
      50. Google, LLC
      51. 11.10.3.
      52. Product Offered
      53. 11.10.6.
      54. Key Strategies
      55. HCL Technologies Limited
        1. Company Overview
        2. Product Offered
        3. Key Developments
        4. Key Strategies
      56. 11.11.2.
      57. Financial Overview
      58. 11.11.5.
      59. SWOT Analysis
      60. Honeywell International,
        1. Company Overview
        2. Financial Overview
        3. Key Developments
        4. SWOT Analysis
      61. Inc.
      62. 11.12.3.
      63. Product Offered
      64. 11.12.6.
      65. Key Strategies
      66. HTC Corporation
        1. Company Overview
        2. Product Offered
        3. Key Developments
        4. Key Strategies
      67. 11.13.2.
      68. Financial Overview
      69. 11.13.5.
      70. SWOT Analysis
      71. Immersive Media Company
        1. Financial Overview
        2. Product Offered
        3. SWOT Analysis
        4. Key Strategies
        5. Company Overview
        6. Product Offered
        7. Key Developments
        8. Key Strategies
      72. 11.14.1.
      73. Company Overview
      74. 11.14.4.
      75. Key Developments
      76. 11.15.
      77. Immersive Technologies Pty Limited
      78. 11.15.2.
      79. Financial Overview
      80. 11.15.5.
      81. SWOT Analysis
      82. Lockheed Martin Corporation
        1. Financial Overview
        2. Product Offered
        3. SWOT Analysis
        4. Key Strategies
        5. Company Overview
        6. Financial Overview
        7. Key Developments
        8. SWOT Analysis
      83. 11.16.1.
      84. Company Overview
      85. 11.16.4.
      86. Key Developments
      87. 11.17.
      88. Magic Leap, Inc.
      89. 11.17.3.
      90. Product Offered
      91. 11.17.6.
      92. Key Strategies
      93. NCTech Limited
        1. Company Overview
        2. Product Offered
        3. Key Developments
        4. Key Strategies
      94. 11.18.2.
      95. Financial Overview
      96. 11.18.5.
      97. SWOT Analysis
      98. Oculus (Facebook Technologies,
        1. Company Overview
        2. Financial Overview
        3. Key Developments
        4. SWOT Analysis
      99. LLC.)
      100. 11.19.3.
      101. Product Offered
      102. 11.19.6.
      103. Key Strategies
      104. Samsung Group
        1. Company Overview
        2. Product Offered
        3. Key Developments
        4. Key Strategies
      105. 11.20.2.
      106. Financial Overview
      107. 11.20.5.
      108. SWOT Analysis
      109. Sony Corporation
        1. Financial Overview
        2. Product Offered
        3. SWOT Analysis
        4. Key Strategies
        5. Company Overview
        6. Financial Overview
        7. Key Developments
        8. SWOT Analysis
      110. 11.21.1.
      111. Company Overview
      112. 11.21.4.
      113. Key Developments
      114. 11.22.
      115. Unity Software Inc.
      116. 11.22.3.
      117. Product Offered
      118. 11.22.6.
      119. Key Strategies
      120. Varjo Technologies Oy
        1. Company Overview
        2. Product Offered
        3. Key Developments
        4. Key Strategies
      121. 11.23.2.
      122. Financial Overview
      123. 11.23.5.
      124. SWOT Analysis
      125. VI-grade GmbH
        1. Financial Overview
        2. Product Offered
        3. SWOT Analysis
        4. Key Strategies
        5. Company Overview
        6. Financial Overview
        7. Key Developments
        8. SWOT Analysis
      126. 11.24.1.
      127. Company Overview
      128. 11.24.4.
      129. Key Developments
      130. 11.25.
      131. Zeality Inc.
      132. 11.25.3.
      133. Product Offered
      134. 11.25.6.
      135. Key Strategies
    12. Appendix
      1. References
      2. Related Reports
      3. LIST
    13. OF TABLES
    14. Global Immersive Technology in Education sector Market, Synopsis,
    15. Global Immersive Technology in Education sector Market, Estimates
      1. & Forecast, 2018-2032 (USD BILLION)
    16. GLOBAL Immersive Technology
    17. in Education sector MARKET, BY Component, 2018-2032 (USD BILLION)
      1. TABLE 4
    18. GLOBAL Immersive Technology in Education sector MARKET, BY TECHNOLOGY, 2018-2032
      1. (USD BILLION)
    19. GLOBAL Immersive Technology in Education sector MARKET,
      1. BY APPLICATION, 2018-2032 (USD BILLION)
    20. North America Immersive Technology
    21. in Education sector MARKET, BY Component, 2018-2032 (USD BILLION)
      1. TABLE 7
    22. North America Immersive Technology in Education sector MARKET, BY TECHNOLOGY, 2018-2032
      1. (USD BILLION)
    23. North America Immersive Technology in Education sector
    24. MARKET, BY APPLICATION, 2018-2032 (USD BILLION)
    25. North America Immersive
    26. Technology in Education sector MARKET, BY Country, 2018-2032 (USD BILLION)
      1. TABLE
    27. U.S. Immersive Technology in Education sector MARKET, BY Component, 2018-2032
      1. (USD BILLION)
    28. U.S. Immersive Technology in Education sector MARKET,
      1. BY TECHNOLOGY, 2018-2032 (USD BILLION)
    29. U.S. Immersive Technology in
    30. Education sector MARKET, BY APPLICATION, 2018-2032 (USD BILLION)
      1. TABLE 13
    31. Canada Immersive Technology in Education sector MARKET, BY Component, 2018-2032
      1. (USD BILLION)
    32. Canada Immersive Technology in Education sector MARKET,
      1. BY TECHNOLOGY, 2018-2032 (USD BILLION)
    33. Canada Immersive Technology
    34. in Education sector MARKET, BY APPLICATION, 2018-2032 (USD BILLION)
      1. TABLE 16
    35. Europe Immersive Technology in Education sector MARKET, BY Component, 2018-2032
      1. (USD BILLION)
    36. Europe Immersive Technology in Education sector MARKET,
      1. BY TECHNOLOGY, 2018-2032 (USD BILLION)
    37. Europe Immersive Technology
    38. in Education sector MARKET, BY APPLICATION, 2018-2032 (USD BILLION)
      1. TABLE 19
    39. Europe Immersive Technology in Education sector MARKET, BY Country, 2018-2032 (USD
      1. BILLION)
    40. Germany Immersive Technology in Education sector MARKET, BY Component,
    41. Germany Immersive Technology in Education
    42. sector MARKET, BY TECHNOLOGY, 2018-2032 (USD BILLION)
    43. Germany Immersive Technology
    44. in Education sector MARKET, BY APPLICATION, 2018-2032 (USD BILLION)
      1. TABLE 23
    45. France Immersive Technology in Education sector MARKET, BY Component, 2018-2032
      1. (USD BILLION)
    46. France Immersive Technology in Education sector MARKET,
      1. BY TECHNOLOGY, 2018-2032 (USD BILLION)
    47. France Immersive Technology
    48. in Education sector MARKET, BY APPLICATION, 2018-2032 (USD BILLION)
      1. TABLE 26
    49. Italy Immersive Technology in Education sector MARKET, BY Component, 2018-2032 (USD
      1. BILLION)
    50. Italy Immersive Technology in Education sector MARKET, BY TECHNOLOGY,
    51. Italy Immersive Technology in Education
    52. sector MARKET, BY APPLICATION, 2018-2032 (USD BILLION)
    53. Spain Immersive Technology
    54. in Education sector MARKET, BY Component, 2018-2032 (USD BILLION)
      1. TABLE 30
    55. Spain Immersive Technology in Education sector MARKET, BY TECHNOLOGY, 2018-2032
      1. (USD BILLION)
    56. Spain Immersive Technology in Education sector MARKET,
      1. BY APPLICATION, 2018-2032 (USD BILLION)
    57. U.K Immersive Technology in
    58. Education sector MARKET, BY Component, 2018-2032 (USD BILLION)
      1. TABLE 33
    59. U.K Immersive Technology in Education sector MARKET, BY TECHNOLOGY, 2018-2032 (USD
      1. BILLION)
    60. U.K Immersive Technology in Education sector MARKET, BY APPLICATION,
    61. Rest of Europe Immersive Technology in
    62. Education sector MARKET, BY Component, 2018-2032 (USD BILLION)
      1. TABLE 36
    63. Rest of Europe Immersive Technology in Education sector MARKET, BY TECHNOLOGY, 2018-2032
      1. (USD BILLION)
    64. Rest of Europe Immersive Technology in Education sector
    65. MARKET, BY APPLICATION, 2018-2032 (USD BILLION)
    66. Asia Pacific Immersive
    67. Technology in Education sector MARKET, BY Component, 2018-2032 (USD BILLION)
      1. TABLE
    68. Asia Pacific Immersive Technology in Education sector MARKET, BY TECHNOLOGY,
    69. Asia Pacific Immersive Technology in Education
    70. sector MARKET, BY APPLICATION, 2018-2032 (USD BILLION)
    71. Asia Pacific Immersive
    72. Technology in Education sector MARKET, BY Country, 2018-2032 (USD BILLION)
      1. TABLE
    73. Japan Immersive Technology in Education sector MARKET, BY Component, 2018-2032
      1. (USD BILLION)
    74. Japan Immersive Technology in Education sector MARKET,
      1. BY TECHNOLOGY, 2018-2032 (USD BILLION)
    75. Japan Immersive Technology
    76. in Education sector MARKET, BY APPLICATION, 2018-2032 (USD BILLION)
      1. TABLE 45
    77. China Immersive Technology in Education sector MARKET, BY Component, 2018-2032 (USD
      1. BILLION)
    78. China Immersive Technology in Education sector MARKET, BY TECHNOLOGY,
    79. China Immersive Technology in Education
    80. sector MARKET, BY APPLICATION, 2018-2032 (USD BILLION)
    81. India Immersive Technology
    82. in Education sector MARKET, BY Component, 2018-2032 (USD BILLION)
      1. TABLE 49
    83. India Immersive Technology in Education sector MARKET, BY TECHNOLOGY, 2018-2032
      1. (USD BILLION)
    84. India Immersive Technology in Education sector MARKET,
      1. BY APPLICATION, 2018-2032 (USD BILLION)
    85. Australia Immersive Technology
    86. in Education sector MARKET, BY Component, 2018-2032 (USD BILLION)
      1. TABLE 52
    87. Australia Immersive Technology in Education sector MARKET, BY TECHNOLOGY, 2018-2032
      1. (USD BILLION)
    88. Australia Immersive Technology in Education sector
    89. MARKET, BY APPLICATION, 2018-2032 (USD BILLION)
    90. south korea Immersive
    91. Technology in Education sector MARKET, BY Component, 2018-2032 (USD BILLION)
      1. TABLE
    92. south korea Immersive Technology in Education sector MARKET, BY TECHNOLOGY, 2018-2032
      1. (USD BILLION)
    93. south korea Immersive Technology in Education sector
    94. MARKET, BY APPLICATION, 2018-2032 (USD BILLION)
    95. Rest of asia-pacific
    96. Immersive Technology in Education sector MARKET, BY Component, 2018-2032 (USD BILLION)
      1. TABLE
    97. Rest of asia-pacific Immersive Technology in Education sector MARKET, BY TECHNOLOGY,
    98. Rest of asia-pacific Immersive Technology
    99. in Education sector MARKET, BY APPLICATION, 2018-2032 (USD BILLION)
      1. TABLE 60
    100. Rest of WOrld Immersive Technology in Education sector MARKET, BY Component, 2018-2032
      1. (USD BILLION)
    101. Rest of WOrld Immersive Technology in Education sector
    102. MARKET, BY TECHNOLOGY, 2018-2032 (USD BILLION)
    103. Rest of WOrld Immersive
    104. Technology in Education sector MARKET, BY APPLICATION, 2018-2032 (USD BILLION)
      1. TABLE
    105. Rest of WOrld Immersive Technology in Education sector MARKET, BY Country, 2018-2032
      1. (USD BILLION)
    106. Middle east Immersive Technology in Education sector
    107. MARKET, BY Component, 2018-2032 (USD BILLION)
    108. Middle east Immersive
    109. Technology in Education sector MARKET, BY TECHNOLOGY, 2018-2032 (USD BILLION)
      1. TABLE
    110. Middle east Immersive Technology in Education sector MARKET, BY APPLICATION,
    111. Africa Immersive Technology in Education
    112. sector MARKET, BY Component, 2018-2032 (USD BILLION)
    113. Africa Immersive Technology
    114. in Education sector MARKET, BY TECHNOLOGY, 2018-2032 (USD BILLION)
      1. TABLE 69
    115. Africa Immersive Technology in Education sector MARKET, BY APPLICATION, 2018-2032
      1. (USD BILLION)
    116. Latin america Immersive Technology in Education sector
    117. MARKET, BY Component, 2018-2032 (USD BILLION)
    118. Latin america Immersive
    119. Technology in Education sector MARKET, BY TECHNOLOGY, 2018-2032 (USD BILLION)
      1. TABLE
    120. Latin america Immersive Technology in Education sector MARKET, BY APPLICATION,
    121. LIST OF FIGURES
    122. Research Process
      1. FIGURE
    123. Market Structure for the Global Immersive Technology in Education sector Market
      1. FIGURE
    124. Market Dynamics for the Global Immersive Technology in Education sector Market
      1. FIGURE
    125. Global Immersive Technology in Education sector Market, Share (%), BY Component,
    126. Global Immersive Technology in Education sector Market, Share
      1. (%), BY TECHNOLOGY, 2022
    127. Global Immersive Technology in Education
    128. sector Market, Share (%), BY APPLICATION, 2022
    129. Global Immersive Technology
    130. in Education sector Market, Share (%), by Region, 2022
    131. north AMERICA: Immersive
    132. Technology in Education sector MARKET, SHARE (%), BY REGION, 2022
      1. FIGURE 9
    133. Europe: Immersive Technology in Education sector MARKET, SHARE (%), BY REGION, 2022
      1. FIGURE
    134. Asia-Pacific: Immersive Technology in Education sector MARKET, SHARE (%), BY
      1. REGION, 2022
    135. Rest of the world: Immersive Technology in Education
    136. sector MARKET, SHARE (%), BY REGION, 2022
    137. Global Immersive Technology
      1. in Education sector Market: Company Share Analysis, 2022 (%)
    138. ACER INC.: FINANCIAL
      1. OVERVIEW SNAPSHOT
    139. ACER INC.: SWOT ANALYSIS
    140. Atheer, Inc.: FINANCIAL
      1. OVERVIEW SNAPSHOT
    141. Atheer, Inc., Inc.: SWOT ANALYSIS
      1. FIGURE 17
      2. AVEVA Group PLC.: FINANCIAL OVERVIEW SNAPSHOT
    142. AVEVA Group PLC: SWOT
      1. ANALYSIS
    143. Barco NV: FINANCIAL OVERVIEW SNAPSHOT
    144. Barco NV: SWOT ANALYSIS
      1. FIGURE
    145. Blippar Ltd.: FINANCIAL OVERVIEW SNAPSHOT
    146. Blippar Ltd.: SWOT
      1. ANALYSIS
    147. Carl Zeiss AG: FINANCIAL OVERVIEW SNAPSHOT
      1. FIGURE 24
      2. Carl Zeiss AG: SWOT ANALYSIS
    148. CM Labs Simulations Inc.: FINANCIAL OVERVIEW
      1. SNAPSHOT
    149. CM Labs Simulations Inc.: SWOT ANALYSIS
    150. EON Reality, Inc.:
      1. FINANCIAL OVERVIEW SNAPSHOT
    151. EON Reality, Inc.: SWOT ANALYSIS
      1. FIGURE
    152. FAAC Incorporated: FINANCIAL OVERVIEW SNAPSHOT
    153. FAAC Incorporated:
    154. SWOT ANALYSIS
    155. Google, LLC: FINANCIAL OVERVIEW SNAPSHOT
      1. FIGURE
    156. Google, LLC.: SWOT ANALYSIS
    157. HCL Technologies Limited: FINANCIAL OVERVIEW
      1. SNAPSHOT
    158. HCL Technologies Limited: SWOT ANALYSIS
    159. Honeywell International,
      1. Inc.: FINANCIAL OVERVIEW SNAPSHOT
    160. Honeywell International, Inc.:
    161. SWOT ANALYSIS
    162. HTC Corporation: FINANCIAL OVERVIEW SNAPSHOT
      1. FIGURE
    163. HTC Corporation: SWOT ANALYSIS
    164. Immersive Media Company: FINANCIAL
      1. OVERVIEW SNAPSHOT
    165. Immersive Media Company.: SWOT ANALYSIS
      1. FIGURE
    166. Immersive Technologies Pty Limited: FINANCIAL OVERVIEW SNAPSHOT
      1. FIGURE 42
      2. Immersive Technologies Pty Limited, LLC: SWOT ANALYSIS
    167. Lockheed Martin Corporation:
      1. FINANCIAL OVERVIEW SNAPSHOT
    168. Lockheed Martin Corporation: SWOT ANALYSIS
    169. NCTech Limited: FINANCIAL OVERVIEW SNAPSHOT
      1. FIGURE 46
      2. NCTech Limited: SWOT ANALYSIS
    170. Oculus (Facebook Technologies, LLC.):
      1. FINANCIAL OVERVIEW SNAPSHOT
    171. Oculus (Facebook Technologies, LLC.):
    172. SWOT ANALYSIS
    173. Samsung Group: FINANCIAL OVERVIEW SNAPSHOT
      1. FIGURE
    174. Samsung Group: SWOT ANALYSIS
    175. Sony Corporation: FINANCIAL OVERVIEW
      1. SNAPSHOT
    176. Sony Corporation: SWOT ANALYSIS
    177. Unity Software Inc.:
      1. FINANCIAL OVERVIEW SNAPSHOT
    178. Unity Software Inc.: SWOT ANALYSIS
      1. FIGURE
    179. Varjo Technologies Oy: FINANCIAL OVERVIEW SNAPSHOT
    180. Varjo Technologies
      1. Oy: SWOT ANALYSIS
    181. VI-grade GmbH: FINANCIAL OVERVIEW SNAPSHOT
      1. FIGURE
    182. VI-grade GmbH: SWOT ANALYSIS
    183. VI-grade GmbH: FINANCIAL OVERVIEW SNAPSHOT
      1. FIGURE
    184. VI-grade GmbH: SWOT ANALYSIS
      1. \r\n \r\n

    Immersive Technology in Retail Industry Market Segmentation

    Immersive Technology in Retail Industry Component Outlook (USD Billion, 2018-2032)

    • Hardware

      • Head-Mounted Display (HMD)
      • Gesture Tracking Devices (GTD)
      • Projectors & Display Walls (PDW)
    • Software/Platform
    • Services

      • Professional
      • Managed

    Immersive Technology in Retail Industry Technology Outlook (USD Billion, 2018-2032)

    • Mixed Reality (MR)
    • Virtual Reality (VR)
    • Augmented Reality (AR)
    • 360 Film

    Immersive Technology in Retail Industry Application Outlook (USD Billion, 2018-2032)

    • Training & Learning
    • Emergency Services
    • Product Development
    • Sales & Marketing

    Immersive Technology in Retail Industry Regional Outlook (USD Billion, 2018-2032)

    • North America Outlook (USD Billion, 2018-2032)

      • Immersive Technology in Retail Industry by Component
        • Hardware

          • Head-Mounted Display (HMD)
          • Gesture Tracking Devices (GTD)
          • Projectors & Display Walls (PDW)
        • Software/Platform
        • Services

          • Professional
          • Managed
      • Immersive Technology in Retail Industry by Technology
        • Mixed Reality (MR)
        • Virtual Reality (VR)
        • Augmented Reality (AR)
        • 360 Film
      • Immersive Technology in Retail Industry by Application
        • Training & Learning
        • Emergency Services
        • Product Development
        • Sales & Marketing
      • US Outlook (USD Billion, 2018-2032)

      • Immersive Technology in Retail Industry by Component
        • Hardware

          • Head-Mounted Display (HMD)
          • Gesture Tracking Devices (GTD)
          • Projectors & Display Walls (PDW)
        • Software/Platform
        • Services

          • Professional
          • Managed
      • Immersive Technology in Retail Industry by Technology
        • Mixed Reality (MR)
        • Virtual Reality (VR)
        • Augmented Reality (AR)
        • 360 Film
      • Immersive Technology in Retail Industry by Application
        • Training & Learning
        • Emergency Services
        • Product Development
        • Sales & Marketing
      • Canada Outlook (USD Billion, 2018-2032)

      • Immersive Technology in Retail Industry by Component
        • Hardware

          • Head-Mounted Display (HMD)
          • Gesture Tracking Devices (GTD)
          • Projectors & Display Walls (PDW)
        • Software/Platform
        • Services

          • Professional
          • Managed
      • Immersive Technology in Retail Industry by Technology
        • Mixed Reality (MR)
        • Virtual Reality (VR)
        • Augmented Reality (AR)
        • 360 Film
      • Immersive Technology in Retail Industry by Application
        • Training & Learning
        • Emergency Services
        • Product Development
        • Sales & Marketing
    • Europe Outlook (USD Billion, 2018-2032)

      • Immersive Technology in Retail Industry by Component
        • Hardware

          • Head-Mounted Display (HMD)
          • Gesture Tracking Devices (GTD)
          • Projectors & Display Walls (PDW)
        • Software/Platform
        • Services

          • Professional
          • Managed
      • Immersive Technology in Retail Industry by Technology
        • Mixed Reality (MR)
        • Virtual Reality (VR)
        • Augmented Reality (AR)
        • 360 Film
      • Immersive Technology in Retail Industry by Application
        • Training & Learning
        • Emergency Services
        • Product Development
        • Sales & Marketing
      • Germany Outlook (USD Billion, 2018-2032)

      • Immersive Technology in Retail Industry by Component
        • Hardware

          • Head-Mounted Display (HMD)
          • Gesture Tracking Devices (GTD)
          • Projectors & Display Walls (PDW)
        • Software/Platform
        • Services

          • Professional
          • Managed
      • Immersive Technology in Retail Industry by Technology
        • Mixed Reality (MR)
        • Virtual Reality (VR)
        • Augmented Reality (AR)
        • 360 Film
      • Immersive Technology in Retail Industry by Application
        • Training & Learning
        • Emergency Services
        • Product Development
        • Sales & Marketing
      • France Outlook (USD Billion, 2018-2032)

      • Immersive Technology in Retail Industry by Component
        • Hardware

          • Head-Mounted Display (HMD)
          • Gesture Tracking Devices (GTD)
          • Projectors & Display Walls (PDW)
        • Software/Platform
        • Services

          • Professional
          • Managed
      • Immersive Technology in Retail Industry by Technology
        • Mixed Reality (MR)
        • Virtual Reality (VR)
        • Augmented Reality (AR)
        • 360 Film
      • Immersive Technology in Retail Industry by Application
        • Training & Learning
        • Emergency Services
        • Product Development
        • Sales & Marketing
      • UK Outlook (USD Billion, 2018-2032)

      • Immersive Technology in Retail Industry by Component
        • Hardware

          • Head-Mounted Display (HMD)
          • Gesture Tracking Devices (GTD)
          • Projectors & Display Walls (PDW)
        • Software/Platform
        • Services

          • Professional
          • Managed
      • Immersive Technology in Retail Industry by Technology
        • Mixed Reality (MR)
        • Virtual Reality (VR)
        • Augmented Reality (AR)
        • 360 Film
      • Immersive Technology in Retail Industry by Application
        • Training & Learning
        • Emergency Services
        • Product Development
        • Sales & Marketing
      • Italy Outlook (USD Billion, 2018-2032)

      • Immersive Technology in Retail Industry by Component
        • Hardware

          • Head-Mounted Display (HMD)
          • Gesture Tracking Devices (GTD)
          • Projectors & Display Walls (PDW)
        • Software/Platform
        • Services

          • Professional
          • Managed
      • Immersive Technology in Retail Industry by Technology
        • Mixed Reality (MR)
        • Virtual Reality (VR)
        • Augmented Reality (AR)
        • 360 Film
      • Immersive Technology in Retail Industry by Application
        • Training & Learning
        • Emergency Services
        • Product Development
        • Sales & Marketing
      • Spain Outlook (USD Billion, 2018-2032)

      • Immersive Technology in Retail Industry by Component
        • Hardware

          • Head-Mounted Display (HMD)
          • Gesture Tracking Devices (GTD)
          • Projectors & Display Walls (PDW)
        • Software/Platform
        • Services

          • Professional
          • Managed
      • Immersive Technology in Retail Industry by Technology
        • Mixed Reality (MR)
        • Virtual Reality (VR)
        • Augmented Reality (AR)
        • 360 Film
      • Immersive Technology in Retail Industry by Application
        • Training & Learning
        • Emergency Services
        • Product Development
        • Sales & Marketing
      • Rest Of Europe Outlook (USD Billion, 2018-2032)

      • Immersive Technology in Retail Industry by Component
        • Hardware

          • Head-Mounted Display (HMD)
          • Gesture Tracking Devices (GTD)
          • Projectors & Display Walls (PDW)
        • Software/Platform
        • Services

          • Professional
          • Managed
      • Immersive Technology in Retail Industry by Technology
        • Mixed Reality (MR)
        • Virtual Reality (VR)
        • Augmented Reality (AR)
        • 360 Film
      • Immersive Technology in Retail Industry by Application
        • Training & Learning
        • Emergency Services
        • Product Development
        • Sales & Marketing
    • Asia-Pacific Outlook (USD Billion, 2018-2032)

      • Immersive Technology in Retail Industry by Component
        • Hardware

          • Head-Mounted Display (HMD)
          • Gesture Tracking Devices (GTD)
          • Projectors & Display Walls (PDW)
        • Software/Platform
        • Services

          • Professional
          • Managed
      • Immersive Technology in Retail Industry by Technology
        • Mixed Reality (MR)
        • Virtual Reality (VR)
        • Augmented Reality (AR)
        • 360 Film
      • Immersive Technology in Retail Industry by Application
        • Training & Learning
        • Emergency Services
        • Product Development
        • Sales & Marketing
      • China Outlook (USD Billion, 2018-2032)

      • Immersive Technology in Retail Industry by Component
        • Hardware

          • Head-Mounted Display (HMD)
          • Gesture Tracking Devices (GTD)
          • Projectors & Display Walls (PDW)
        • Software/Platform
        • Services

          • Professional
          • Managed
      • Immersive Technology in Retail Industry by Technology
        • Mixed Reality (MR)
        • Virtual Reality (VR)
        • Augmented Reality (AR)
        • 360 Film
      • Immersive Technology in Retail Industry by Application
        • Training & Learning
        • Emergency Services
        • Product Development
        • Sales & Marketing
      • Japan Outlook (USD Billion, 2018-2032)

      • Immersive Technology in Retail Industry by Component
        • Hardware

          • Head-Mounted Display (HMD)
          • Gesture Tracking Devices (GTD)
          • Projectors & Display Walls (PDW)
        • Software/Platform
        • Services

          • Professional
          • Managed
      • Immersive Technology in Retail Industry by Technology
        • Mixed Reality (MR)
        • Virtual Reality (VR)
        • Augmented Reality (AR)
        • 360 Film
      • Immersive Technology in Retail Industry by Application
        • Training & Learning
        • Emergency Services
        • Product Development
        • Sales & Marketing
      • India Outlook (USD Billion, 2018-2032)

      • Immersive Technology in Retail Industry by Component
        • Hardware

          • Head-Mounted Display (HMD)
          • Gesture Tracking Devices (GTD)
          • Projectors & Display Walls (PDW)
        • Software/Platform
        • Services

          • Professional
          • Managed
      • Immersive Technology in Retail Industry by Technology
        • Mixed Reality (MR)
        • Virtual Reality (VR)
        • Augmented Reality (AR)
        • 360 Film
      • Immersive Technology in Retail Industry by Application
        • Training & Learning
        • Emergency Services
        • Product Development
        • Sales & Marketing
      • Australia Outlook (USD Billion, 2018-2032)

      • Immersive Technology in Retail Industry by Component
        • Hardware

          • Head-Mounted Display (HMD)
          • Gesture Tracking Devices (GTD)
          • Projectors & Display Walls (PDW)
        • Software/Platform
        • Services

          • Professional
          • Managed
      • Immersive Technology in Retail Industry by Technology
        • Mixed Reality (MR)
        • Virtual Reality (VR)
        • Augmented Reality (AR)
        • 360 Film
      • Immersive Technology in Retail Industry by Application
        • Training & Learning
        • Emergency Services
        • Product Development
        • Sales & Marketing
      • Rest of Asia-Pacific Outlook (USD Billion, 2018-2032)

      • Immersive Technology in Retail Industry by Component
        • Hardware

          • Head-Mounted Display (HMD)
          • Gesture Tracking Devices (GTD)
          • Projectors & Display Walls (PDW)
        • Software/Platform
        • Services

          • Professional
          • Managed
      • Immersive Technology in Retail Industry by Technology
        • Mixed Reality (MR)
        • Virtual Reality (VR)
        • Augmented Reality (AR)
        • 360 Film
      • Immersive Technology in Retail Industry by Application
        • Training & Learning
        • Emergency Services
        • Product Development
        • Sales & Marketing
    • Rest of the World Outlook (USD Billion, 2018-2032)

      • Immersive Technology in Retail Industry by Component
        • Hardware

          • Head-Mounted Display (HMD)
          • Gesture Tracking Devices (GTD)
          • Projectors & Display Walls (PDW)
        • Software/Platform
        • Services

          • Professional
          • Managed
      • Immersive Technology in Retail Industry by Technology
        • Mixed Reality (MR)
        • Virtual Reality (VR)
        • Augmented Reality (AR)
        • 360 Film
      • Immersive Technology in Retail Industry by Application
        • Training & Learning
        • Emergency Services
        • Product Development
        • Sales & Marketing
      • Middle East Outlook (USD Billion, 2018-2032)

      • Immersive Technology in Retail Industry by Component
        • Hardware

          • Head-Mounted Display (HMD)
          • Gesture Tracking Devices (GTD)
          • Projectors & Display Walls (PDW)
        • Software/Platform
        • Services

          • Professional
          • Managed
      • Immersive Technology in Retail Industry by Technology
        • Mixed Reality (MR)
        • Virtual Reality (VR)
        • Augmented Reality (AR)
        • 360 Film
      • Immersive Technology in Retail Industry by Application
        • Training & Learning
        • Emergency Services
        • Product Development
        • Sales & Marketing
      • Africa Outlook (USD Billion, 2018-2032)

      • Immersive Technology in Retail Industry by Component
        • Hardware

          • Head-Mounted Display (HMD)
          • Gesture Tracking Devices (GTD)
          • Projectors & Display Walls (PDW)
        • Software/Platform
        • Services

          • Professional
          • Managed
      • Immersive Technology in Retail Industry by Technology
        • Mixed Reality (MR)
        • Virtual Reality (VR)
        • Augmented Reality (AR)
        • 360 Film
      • Immersive Technology in Retail Industry by Application
        • Training & Learning
        • Emergency Services
        • Product Development
        • Sales & Marketing
      • Latin America Outlook (USD Billion, 2018-2032)

      • Immersive Technology in Retail Industry by Component
        • Hardware

          • Head-Mounted Display (HMD)
          • Gesture Tracking Devices (GTD)
          • Projectors & Display Walls (PDW)
        • Software/Platform
        • Services

          • Professional
          • Managed
      • Immersive Technology in Retail Industry by Technology
        • Mixed Reality (MR)
        • Virtual Reality (VR)
        • Augmented Reality (AR)
        • 360 Film
      • Immersive Technology in Retail Industry by Application
        • Training & Learning
        • Emergency Services
        • Product Development
        • Sales & Marketing
     
    Infographic

    Free Sample Request

    Kindly complete the form below to receive a free sample of this Report

    Get Free Sample

    Customer Strories

    “I am very pleased with how market segments have been defined in a relevant way for my purposes (such as "Portable Freezers & refrigerators" and "last-mile"). In general the report is well structured. Thanks very much for your efforts.”

    Victoria Milne

    Founder
    Case Study
    Chemicals and Materials