• Cat-intel
  • MedIntelliX
  • Resources
  • About Us
  • Hero Background
    English
    Chinese
    French
    Japanese
    Korean
    German
    Spanish

    Hyperautomation in Security Market Trends

    ID: MRFR/ICT/10706-HCR
    215 Pages
    Shubham Munde
    October 2025

    Hyperautomation in Security Market Research Report Information By Offering (Solutions, Services {Professional Services, Security Consulting Services, Integration & Deployment Services}, Managed Security Services), By Technology (Artificial Intelligence (AI), Machine Learning (ML), Robotic Process Automation (RPA), Process Analytics, Ingestion Engines, and Others), By Region (North America, ...

    Share:
    Download PDF ×

    We do not share your information with anyone. However, we may send you emails based on your report interest from time to time. You may contact us at any time to opt-out.

    Hyperautomation in Security Market Infographic
    $ 4,950.0
    $ 5,950.0
    $ 7,250.0

    Market Trends

    Key Emerging Trends in the Hyperautomation in Security Market

    Hyperautomation has transformed cybersecurity and threat detection in the ever-changing security market. Hyperautomation uses AI, machine learning, and RPA to improve security operations, therefore market share positioning is crucial for enterprises in this area. Developing complete and adaptable hyperautomation systems is a key approach. Companies develop systems that automatically scan massive security data, discover abnormalities, and respond to attacks in real time. Companies become leaders in cyber security by delivering dynamic and flexible solutions. The Security Hyperautomation Market relies on collaboration and strategic collaborations. Technology developers, threat intelligence providers, and industry-specific security specialists must work together in cybersecurity. Companies may effortlessly incorporate hyperautomation technologies into security frameworks through partnerships with cybersecurity businesses, threat detection platforms, and government agencies. These partnerships help create end-to-end hyperautomation systems that meet businesses' broad and changing demands, establishing a company's cybersecurity reputation. Hyperautomation in Security Market pricing tactics reflect threat detection and response improvements. Because cybersecurity is so important, firms typically use flexible pricing structures that take into account their size and complexity. Hyperautomation must prove its cost-effectiveness in threat response, incident resolution, and risk reduction to gain cybersecurity market share. Geographic expansion is another important Hyperautomation in Security Market positioning approach. Cyber dangers cross boundaries, therefore organizations must be present in global business and government hubs. Successful market positioning requires customizing hyperautomation solutions to regional cybersecurity rules, partnering with local security authorities, and adjusting to different threat environments. A deliberate regional growth strategy lets organizations serve varied cybersecurity environments and guarantees their hyperautomation solutions are successful globally. Customer-centric techniques are essential in hyperautomation, where enterprises want seamless security infrastructure integration and quick threat response. Companies prioritize user-friendly interfaces for security experts, compatibility with security products, and usability. Comprehensive training and assistance help firms embrace and utilize hyperautomation, building long-term relationships and improving cybersecurity.

    Market Summary

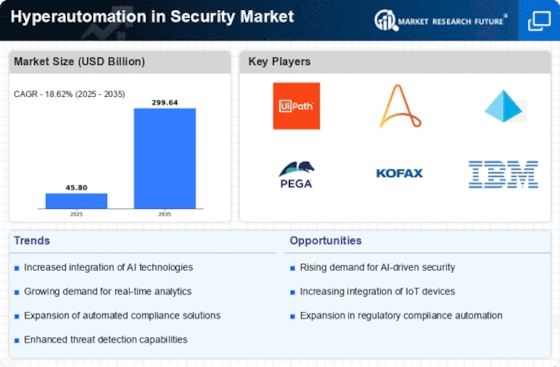
    The Global Hyperautomation in Security Market is projected to grow significantly from 45.80 USD Billion in 2024 to 299.64 USD Billion by 2035.

    Key Market Trends & Highlights

    Hyperautomation in Security Key Trends and Highlights

    • The market is expected to experience a compound annual growth rate (CAGR) of 18.63 percent from 2025 to 2035.
    • By 2035, the market valuation is anticipated to reach 299.6 USD Billion, indicating robust growth potential.
    • in 2024, the market is valued at 45.80 USD Billion, reflecting a strong foundation for future expansion.
    • Growing adoption of automation technologies due to increasing security threats is a major market driver.

    Market Size & Forecast

    2024 Market Size 45.80 (USD Billion)
    2035 Market Size 299.64 (USD Billion)
    CAGR (2025-2035) 18.62%
    Largest Regional Market Share in 2024 latin_america)

    Major Players

    SIRP Labs Limited, Mindflow, Wipro, Torq, D3 Security, Cloud4C, Sonrai Security, Zoho Corporation Pvt. Ltd., UiPath, Ivanti

    Market Trends

    Increasing of Hyperautomation Platforms with SOAR Platforms

    The Security Orchestration, Automation, and Response (SOAR) platform is used to create hyperautomation in security. SOAR platforms enable security professionals to automate many mundane incident response duties while also offering a structure for collaboration and communication among many stakeholders. SOAR platforms commonly offer capabilities such as automation processes, orchestration tools, and incident response playbooks, all of which can be utilized to streamline security operations and enhance efficiency. Security hyperautomation demands careful planning and implementation. Organizations must first identify the jobs and processes that are best suited for automation, and then create workflows and playbooks to automate these operations.

    They must also ensure that the SOAR platform seamlessly connects with other security tools and systems, such as SIEMs and endpoint detection and response (EDR) platforms.

    The integration of hyperautomation technologies within security frameworks appears to enhance operational efficiency and risk management capabilities, thereby fostering a more resilient security posture across various sectors.

    U.S. Department of Homeland Security

    Hyperautomation in Security Market Market Drivers

    Market Growth Visualization

    Increased Cybersecurity Threats

    The Global Hyperautomation in Security Market Industry is experiencing heightened demand due to the escalating frequency and sophistication of cyber threats. Organizations are increasingly targeted by ransomware, phishing attacks, and data breaches, necessitating advanced security measures. In 2024, the market is projected to reach 45.8 USD Billion, reflecting a growing recognition of the need for automated security solutions. Hyperautomation technologies, such as AI and machine learning, enable organizations to respond swiftly to threats, thereby enhancing their security posture. This trend underscores the urgency for businesses to adopt hyperautomation strategies to safeguard sensitive information and maintain operational integrity.

    Regulatory Compliance Requirements

    The Global Hyperautomation in Security Market Industry is significantly influenced by stringent regulatory compliance requirements across various sectors. Organizations are compelled to adhere to regulations such as GDPR, HIPAA, and PCI-DSS, which mandate robust security measures to protect sensitive data. As compliance becomes increasingly complex, hyperautomation offers a viable solution by automating compliance processes and ensuring continuous monitoring. This trend is expected to drive market growth, as businesses seek to mitigate risks associated with non-compliance. The anticipated growth from 2024 to 2035, with a projected market size of 299.6 USD Billion, highlights the critical role of hyperautomation in achieving compliance and enhancing security frameworks.

    Integration of Advanced Technologies

    The Global Hyperautomation in Security Market Industry is propelled by the integration of advanced technologies such as artificial intelligence, machine learning, and robotic process automation. These technologies enhance the capabilities of security systems, enabling real-time threat detection and response. As organizations increasingly adopt these technologies, the demand for hyperautomation solutions is expected to surge. The ability to analyze vast amounts of data quickly and accurately allows for proactive security measures, which are essential in today's threat landscape. This integration not only improves security outcomes but also drives market growth, as businesses seek to leverage technology for enhanced protection.

    Operational Efficiency and Cost Reduction

    The Global Hyperautomation in Security Market Industry is witnessing a shift towards operational efficiency and cost reduction as organizations seek to optimize their security operations. By automating repetitive tasks, businesses can allocate resources more effectively and reduce the likelihood of human error. This transformation not only enhances security but also leads to significant cost savings. The projected compound annual growth rate (CAGR) of 18.63% from 2025 to 2035 indicates a robust market trajectory, driven by the increasing adoption of hyperautomation technologies. Organizations are recognizing that investing in hyperautomation can yield long-term financial benefits while simultaneously strengthening their security posture.

    Growing Demand for Cloud Security Solutions

    The Global Hyperautomation in Security Market Industry is experiencing a surge in demand for cloud security solutions as more organizations migrate to cloud environments. This shift necessitates robust security measures to protect sensitive data stored in the cloud. Hyperautomation plays a crucial role in this context by automating security protocols and ensuring compliance with cloud security standards. As businesses increasingly recognize the importance of securing their cloud infrastructure, the market is poised for substantial growth. The anticipated increase in market size to 299.6 USD Billion by 2035 reflects the critical need for hyperautomation in addressing the unique challenges posed by cloud security.

    Market Segment Insights

    Hyperautomation in Security Market Technology Insights

    The Hyperautomation in Security Market, in this report, has been segmented on the basis of Technology into artificial intelligence (AI), machine learning (ML), robotic process automation (RPA), process analytics, ingestion engines, and others.

    Artificial intelligence (AI) holds the largest share of the total share. Artificial intelligence (AI) is crucial in security hyperautomation, considerably improving the efficiency and effectiveness of cybersecurity procedures.AI-powered user and entity behavior analytics (UEBA) solutions examine the behavior of users and devices on a network. These systems are capable of detecting odd or suspicious activity, which could suggest insider threats or hacked accounts.

    Hyperautomation in Security Market Deployment Insights

    The Hyperautomation in Security market in this report has been segmented on the basis of Deployment into on premise, cloud, and hybrid.

    The Cloud segment holds 44% of the total share. Cloud is a prevalent Deployment in the Hyperautomation in Security market, because cloud-based solutions are more scalable and cost-effective than on-premise systems, they are becoming increasingly popular. Cloud-based solutions are also easier to deploy and manage, which is critical for firms with limited IT personnel. This model is more scalable and cost-effective than on-premise, but enterprises may have less control over the solution.

    Hyperautomation in Security Market Organization Size Insights

    The Hyperautomation in Security market in this report has been segmented on the basis of Organization Size into SMEs and large enterprise.

    The large enterprise segment holds the largest share of the total market share.

    This is due to the fact that large organizations require more security automation than SMEs. huge organizations frequently have complicated IT infrastructures and a huge number of users, making manual security management onerous. Large companies can benefit from hyperautomation by automating security tasks such as vulnerability scanning and patch management, freeing up security professionals to focus on more vital responsibilities.

    Hyperautomation in Security Market Application Insights

    The Hyperautomation in Security market in this report has been segmented on the basis of Application into identity access management (IAM), application security operations, continuous vulnerability management, cloud security posture management (CSPM), threat hunting (XDR, EDR, and SIEM Response), email security management, chatbots, abnormal system behavior detection, transaction fraud detection, document security system, and others.

    The continuous vulnerability management segment holds 27% of the total market share.

    Continuous vulnerability management (CVMM) is a technique for detecting and correcting vulnerabilities in systems and applications. CVMM tasks such as vulnerability scanning and patching can be automated via hyperautomation. This can help to improve system and application security and reduce the risk of data breaches. This is due to the growing amount of vulnerabilities in systems and applications, and enterprises must discover ways to automate the process of identifying and addressing these vulnerabilities. Organizations can benefit from hyperautomation by automating operations like as vulnerability screening and patching.

    Hyperautomation in Security Market Industry Vertical Insights

    The Hyperautomation in Security market in this report has been segmented on the basis of Industry Vertical into BFSI, healthcare, manufacturing, legal, government, logistics, IT & telecommunication, retail & e-commerce, and others.

    The BFSI segment holds the largest share of the total market share.

    Because they handle sensitive financial information, the BFSI industry is a prime target for cyber assaults. Tasks such as fraud detection, vulnerability scanning, and patch management can be automated via hyperautomation. This can assist BFSI firms strengthen their security and lower the risk of data breaches. This is due to the fact that the BFSI industry is a key target for cyber assaults and has a large amount of sensitive data to safeguard.

    Hyperautomation can assist BFSI firms in automating operations such as fraud detection, vulnerability scanning, and patch management, hence improving their security posture and lowering the risk of data breaches.

    Get more detailed insights about Hyperautomation in Security Market Research Report - Global Forecast till 2034

    Regional Insights

    Based on Region, the global Hyperautomation in Security is segmented into North America, Europe, Asia-Pacific, Middle East & Africa, and South America. Further, the major countries studied in the market report are the U.S., Canada, Germany, UK, Italy, Spain, China, Japan, India, Australia, UAE, and Brazil.

    North America is a prominent target for cyber-attacks since it is home to many huge enterprises with important data. The increasing sophistication of cyber threats is generating demand for hyperautomation solutions that can assist enterprises in automating security processes and improving their security posture. North America has a number of stringent data security standards, such as the General Data Protection Regulation (GDPR) and the California Consumer Privacy Act (CCPA). Organizations in North America must follow these standards to avoid fines and penalties. Hyperautomation technologies can assist firms in automating compliance tasks and lowering the risk of noncompliance.

    In recent years, the Asia Pacific area has seen a considerable growth in cybersecurity threats and attacks. Nation-state-sponsored assaults, ransomware operations, and data breaches are among the threats. Because of the increase in cyber threats, firms are investing more in advanced security solutions, such as hyperautomation, to secure their digital assets. Asia Pacific has a thriving IT industry, which includes software development, e-commerce, and cloud services. These businesses are especially appealing targets for cyberattacks. Hyperautomation solutions are being used to strengthen these firms' security infrastructure.

    Key Players and Competitive Insights

    The Hyperautomation in Security market is a highly competitive industry, as numerous companies offer wide variety of services. The market is characterized by the presence of established and large Hyperautomation in Security companies, as well as many smaller and emerging players. These companies are focused on developing innovative technologies and processes to improve efficiency, reduce costs, and enhance the quality of services for customers across the world.

    The competition in the Hyperautomation in Security market is driven by various factors, including pricing, quality, delivery time, and the ability to offer customized solutions to customers. Moreover, partnerships and collaborations with other players in the industry, such as OEMs and suppliers, are crucial for companies to remain competitive in the market. Mergers and acquisitions are also common in the Hyperautomation in Security market, as companies seek to expand their reach and capabilities. Additionally, companies are investing heavily in research and development to develop new deployments and technologies that can improve the market share.

    Key Companies in the Hyperautomation in Security Market market include

    Industry Developments

    July 2022 saw Wipro PARI acquiring Hochrainer, a German automation technology company. This acquisition helped Wipro to expand its footprint in Europe and enhance its global leadership position. Also, the acquisition will enable Hochrainer to develop and obtain access to advanced technology resources as well as future technologies.

    June 2022 – Low-code automation and integration player Tray.io has announced new capabilities that are aimed at speeding up enterprise hyper-automation implementations. Tray.io provides end-to-end connectivity for all user profiles through the Connector Builder, making it possible for low-code developers to build reusable connectors quickly and on-demand in a visual manner. Moreover, a new Connectivity API experience for developers simplifies combining hundreds of underlying endpoints into just three API calls.

    May 2022 – Visa, a worldwide digital payments player, and Phrasee, specializing in brand language optimization, have agreed on a European exclusive deal. It is a three-year agreement that is part of Visa’s investment strategy involving their customers, such as leading B2B financial services companies in Europe. Through its reseller program, Phrasee makes visa clients available with advanced machine learning and natural language generation capabilities.

    September 2022 witnessed the launch of e.IQ 5.0 – Nile Edition enhances platform features for building automated business applications at scale. These include process orchestration, data & event processing, AI/ML, enterprise connectors, and front-end application development under an easy-to-use interface with no coding or low code involved. The release also introduces a taxonomy builder for multi-level taxonomy management across business domains; it continues expanding the hyper-automation enablement platform’s unified data experience offer started from release 4.0, which is how it makes data actionable at run-time to power simple decision automation.

    September 2022 - UiPath Business Automation Platform partner OutSystems has joined forces with high-performance low-code provider OutSystems to leverage both companies’ strengths. Consequently, they will be able to help their customers automate the most critical business processes and applications intelligently and securely, which will save them hours of tedious work, increase their productivity, and revolutionize their application experience.

    Hyperautomation in Security Market - Market Segmentation

    Hyperautomation in Security Market - Offering Outlook

      • Solutions
      • Services
      • Professional Services
      • Security Consulting Services
      • Integration & Deployment Services
      • Managed Security Services

    Hyperautomation in Security Market - Technology Outlook

      • Artificial Intelligence (AI)
      • Machine Learning (ML)
      • Robotic Process Automation (RPA)
      • Process Analytics
      • Ingestion Engines
      • Others

    Hyperautomation in Security Market - Deployment Outlook

      • On Premise
      • Cloud
      • Hybrid

    Hyperautomation in Security Market - Organization Size Outlook

      • SMEs
      • Large Enterprises

    Hyperautomation in Security Market - Application Outlook

      • Identity Access Management (IAM)
      • Application Security Operations
      • Continuous Vulnerability Management
      • Cloud Security Posture Management (CSPM)
      • Threat Hunting (XDR, EDR, and SIEM Response)
      • Email Security Management
      • Chatbots
      • Abnormal System Behaviour Detection
      • Transaction Fraud Detection
      • Document Security System
      • Others

    Hyperautomation in Security Market - Industry Vertical Outlook

      • BFSI
      • Healthcare
      • Manufacturing
      • Legal
      • Government
      • Logistics
      • IT & Telecommunication
      • Retail & E-Commerce
      • Others

    Hyperautomation in Security Market - Regional Outlook

      • North America
        • US
        • Canada
        • Mexico
      • Europe
        • Germany
        • France
        • UK
        • Italy
        • Spain
        • Rest of Europe
      • Asia-Pacific
        • China
        • Japan
        • India
        • South Korea
        • Australia
        • Rest of Asia-Pacific
      • Middle East & Africa
        • Saudi Arabia
        • UAE
        • South Africa
        • Rest of the Middle East & Africa
      • South America
        • Brazil
        • Argentina
        • Chile
        • Rest of South America

    Future Outlook

    Hyperautomation in Security Market Future Outlook

    The Global Hyperautomation in Security Market is poised for robust growth, driven by an 18.62% CAGR from 2025 to 2035, fueled by advancements in AI and machine learning.

    New opportunities lie in:

    • Develop AI-driven security solutions for real-time threat detection.
    • Integrate hyperautomation tools with existing security frameworks for enhanced efficiency.
    • Offer consulting services to optimize hyperautomation strategies in security operations.

    By 2035, the market is expected to achieve substantial growth, reflecting its critical role in modern security solutions.

    Market Segmentation

    Hyperautomation in Security Market - Offering Outlook

    • Solutions
    • Services
    • Professional Services
    • Security Consulting Services
    • Integration & Deployment Services
    • Managed Security Services

    Hyperautomation in Security Market - Regional Outlook

    • US
    • Canada
    • Mexico

    Hyperautomation in Security Market - Deployment Outlook

    • On Premise
    • Cloud
    • Hybrid

    Hyperautomation in Security Market - Technology Outlook

    • Artificial Intelligence (AI)
    • Machine Learning (ML)
    • Robotic Process Automation (RPA)
    • Process Analytics
    • Ingestion Engines
    • Others

    Hyperautomation in Security Market - Application Outlook

    • Identity Access Management (IAM)
    • Application Security Operations
    • Continuous Vulnerability Management
    • Cloud Security Posture Management (CSPM)
    • Threat Hunting (XDR, EDR, and SIEM Response)
    • Email Security Management
    • Chatbots
    • Abnormal System Behaviour Detection
    • Transaction Fraud Detection
    • Document Security System
    • Others

    Hyperautomation in Security Market - Industry Vertical Outlook

    • BFSI
    • Healthcare
    • Manufacturing
    • Legal
    • Government
    • Logistics
    • IT & Telecommunication
    • Retail & E-Commerce
    • Others

    Hyperautomation in Security Market - Organization Size Outlook

    • SMEs
    • Large Enterprises

    Report Scope

    Report Attribute/Metric Details
    Market Size 2024 45.79 (USD Billion)
    Market Size 2025 54.32 (USD Billion)
    Market Size 2035 299.64 (USD Billion)
    Compound Annual Growth Rate (CAGR) 18.62% (2025 - 2035)
    Report Coverage Revenue Forecast, Competitive Landscape, Growth Factors, and Trends
    Base Year 2024
    Market Forecast Period 2025 - 2035
    Historical Data 2019 - 2023
    Market Forecast Units USD Billion
    Segments Covered Offering, Technology, Organization Size, Deployment, Industry Vertical, Application and Region
    Geographies Covered Europe, North America, Asia-Pacific, Middle East & Africa, and South America
    Countries Covered US, Canada, Mexico, Germany, France, UK, Italy, Spain, China, Japan, India, South Korea, Australia, Saudi Arabia, UAE, South Africa, Brazil, Argentina, Chile, and others.
    Key Companies Profiled SIRP Labs Limited, Mindflow, Wipro, Torq, D3 Security, Cloud4C, Sonrai Security, Zoho Corporation Pvt. Ltd, UiPath, Ivanti.
    Key Market Opportunities ·       Demand for Automated Solution Adoptions Across Industry Verticals ·       Growing Security Benefits of Hyperautomation
    Key Market Dynamics ·       Increasing Complexity, Cost, and Time Consumption Across Legacy SOAR (Security Orchestration, Automation, and Response) Platforms ·       Integration of Hyperautomation Platforms with SOAR Platforms Across Organizations ·       Growing Requirements for Streamlining Security Operations and Improving Efficiency

    Market Highlights

    Author

    Shubham Munde
    Research Analyst Level II

    She holds an experience of about 6+ years in market research and business consulting, working under the spectrum of information communication technology, telecommunications and semiconductor domains. aarti conceptualizes and implements a scalable business strategy and provides strategic leadership to the clients. her expertise lies in market estimation, competitive intelligence, pipeline analysis, customer assessment, etc.

    Leave a Comment

    Latest Comments

    John Doe
    john@example.com

    This is a great article! Really helped me understand the topic better.

    Posted on July 23, 2025, 10:15 AM
    Jane Smith
    jane@domain.com

    Thanks for sharing this. I’ve bookmarked it for later reference.

    Posted on July 22, 2025, 7:45 PM

    FAQs

    How much is Hyperautomation in Security market?

    The Hyperautomation in Security Market was valued at USD 45.79 Billion in 2024.

    What is the growth rate of Hyperautomation in Security market?

    The global market is projected to grow at a CAGR of 18.62% during the forecast period, 2025-2034.

    Which region held the largest market share in the Hyperautomation in Security market?

    North America had the largest share of the global market.

    Who are the key players in the Hyperautomation in Security market?

    The key players in the market are SIRP Labs Limited, Mindflow, Wipro, Torq, D3 Security, Cloud4C, Sonrai Security, Zoho Corporation Pvt. Ltd, UiPath and Ivanti.

    1. Table of Contents
    2. Executive Summary
      1. Market Attractiveness Analysis
        1. Global Hyperautomation in Security Market, by Offering
        2. Global Hyperautomation in Security Market, by Technology
        3. Global Hyperautomation in Security Market, by Deployment
        4. Global Hyperautomation in Security Market, by Application
        5. Global Hyperautomation in Security Market, by Organization Size
        6. Global Hyperautomation in Security Market, by Industry Vertical
        7. Global Hyperautomation in Security Market, by Region
    3. Market Introduction
      1. Definition
      2. Scope of the Study
      3. Market Structure
      4. Key Buying Criteria
      5. Macro Factor Indicator Analysis
    4. Research Methodology
      1. Research Process
      2. Primary Research
      3. Secondary Research
      4. Market Size Estimation
      5. Forecast Model
      6. List of Assumptions
    5. MARKET DYNAMICS
      1. Introduction
      2. Drivers
        1. Increasing Complexity, Cost, and Time Consumption Across Legacy SOAR (Security Orchestration, Automation, and Response) Platforms
        2. Integration of Hyperautomation Platforms with SOAR Platforms Across Organizations
        3. Growing Requirements for Streamlining Security Operations and Improving Efficiency
        4. Driver impact analysis
      3. Restraints
        1. Requirement of Next-Generation Technology Infrastructure
        2. Restraint impact analysis
      4. Opportunities
        1. Demand for Automated Solution Adoptions Across Industry Verticals
        2. Growing Security Benefits of Hyperautomation
        3. Growing Cyber Attack Landscape
      5. Challenges
        1. Growing SaaS Solutions Leading to Enterprise Security Challenges
        2. Stringent regulations by governments for data protection
      6. Covid-19 Impact Analysis
        1. Impact on Solution Developers
        2. Hyperautomation Adoption in Post Covid Era
        3. Impact on Enterprise Adoption on Advanced Technologies
        4. YOY growth 2020-202
    6. COVID-19 IMPACT ON SUPPLY CHAIN MARKET FACTOR ANALYSIS
      1. Value Chain Analysis/Supply Chain Analysis
      2. Porter’s Five Forces Model
        1. Bargaining Power of Suppliers
        2. Bargaining Power of Buyers
        3. Threat of New Entrants
        4. Threat of Substitutes
        5. Intensity of Rivalry
    7. GLOBAL HYPERAUTOMATION IN SECURITY MARKET, BY OFFERING
      1. Introduction
      2. Solutions
      3. Services
        1. Professional Services
        2. Managed Security Services
    8. GLOBAL HYPERAUTOMATION IN SECURITY MARKET, BY TECHNOLOGY
      1. Introduction
      2. Artificial Intelligence (AI)
      3. Machine Learning (ML)
      4. Robotic Process Automation (RPA)
      5. Process Analytics
      6. Ingestion Engines
      7. Others
    9. GLOBAL HYPERAUTOMATION IN SECURITY MARKET, BY APPLICATION
      1. Introduction
      2. Identity Access Management (IAM)
      3. Application Security Operations
      4. Continuous Vulnerability Management
      5. Cloud Security Posture Management (CSPM)
      6. Threat Hunting (XDR, EDR, and SIEM Response)
      7. Email Security Management
      8. Chatbots
      9. Abnormal System Behaviour Detection
      10. Transaction Fraud Detection
      11. Document Security System
      12. Others
    10. GLOBAL HYPERAUTOMATION IN SECURITY MARKET, BY DEPLOYMENT
      1. Introduction
      2. On Premise
      3. Cloud
      4. Hybrid
    11. GLOBAL HYPERAUTOMATION IN SECURITY MARKET, BY ORGANIZATION SIZE
      1. Introduction
      2. SMEs
      3. Large Enterprises
    12. GLOBAL HYPERAUTOMATION IN SECURITY MARKET, BY INDUSTRY VERTICAL
      1. Introduction
      2. BFSI
      3. Healthcare
      4. Manufacturing
      5. Legal
      6. Government
      7. Logistics
      8. IT & Telecommunication
      9. Retail & E-Commerce
      10. Others
    13. GLOBAL HYPERAUTOMATION IN SECURITY MARKET SIZE ESTIMATION & FORECAST, BY REGION
      1. Introduction
      2. North America
        1. Market Estimates & Forecast, by Country, 2018-2032
        2. Market Estimates & Forecast, by Offering, 2018-2032
        3. Market Estimates & Forecast, by Deployment, 2018-2032
        4. Market Estimates & Forecast, by Application, 2018-2032
        5. Market Estimates & Forecast, by Technology, 2018-2032
        6. Market Estimates & Forecast, by Organization Size, 2018-2032
        7. Market Estimates & Forecast, by Industry Vertical, 2018-2032
        8. US
        9. Canada
        10. Mexico
      3. Europe
        1. Market Estimates & Forecast, by Country, 2018-2032
        2. Market Estimates & Forecast, by Offering, 2018-2032
        3. Market Estimates & Forecast, by Deployment, 2018-2032
        4. Market Estimates & Forecast, by Application, 2018-2032
        5. Market Estimates & Forecast, by Technology, 2018-2032
        6. Market Estimates & Forecast, by Organization Size, 2018-2032
        7. Market Estimates & Forecast, by Industry Vertical, 2018-2032
        8. UK
        9. Germany
        10. France
        11. Italy
        12. Spain
        13. Rest of Europe
      4. Asia-Pacific
        1. Market Estimates & Forecast, by Country, 2018-2032
        2. Market Estimates & Forecast, by Offering, 2018-2032
        3. Market Estimates & Forecast, by Deployment, 2018-2032
        4. Market Estimates & Forecast, by Application, 2018-2032
        5. Market Estimates & Forecast, by Technology, 2018-2032
        6. Market Estimates & Forecast, by Organization Size, 2018-2032
        7. Market Estimates & Forecast, by Industry Vertical, 2018-2032
        8. China
        9. Japan
        10. India
        11. South Korea
        12. Rest of Asia-Pacific
      5. Rest of the World
        1. Market Estimates & Forecast, by Product, 2018-2032
        2. Market Estimates & Forecast, by Offering, 2018-2032
        3. Market Estimates & Forecast, by Deployment, 2018-2032
        4. Market Estimates & Forecast, by Application, 2018-2032
        5. Market Estimates & Forecast, by Technology, 2018-2032
        6. Market Estimates & Forecast, by Organization Size, 2018-2032
        7. Market Estimates & Forecast, by Industry Vertical, 2018-2032
        8. Middle East
        9. Africa
        10. Latin America
    14. Competitive Landscape
      1. Introduction
      2. Key Developments & Growth Strategies
      3. Competitor Benchmarking
      4. Vendor Share Analysis, 2022(% Share)
    15. COMPANY PROFILES
      1. SIRP Labs Limited
        1. Company Overview
        2. Financial Overview
        3. Products/ Solutions/ Services Offerred
        4. Key Market Developments
        5. SWOT Analysis
        6. Key Strategies
      2. Mindflow
      3. Wipro
      4. Torq
      5. D3 Security
      6. Cloud4C
      7. Sonrai Security
      8. Zoho Corporation Pvt. Ltd.
      9. UiPath
      10. Ivanti
    16. List of Tables and Figures
      1. LIST OF TABLES
      2. TABLE 1 MARKET SYNOPSIS
      3. TABLE 2 GLOBAL HYPERAUTOMATION IN SECURITY MARKET, BY OFFERING, 2018–2030 (USD MILLION)
      4. TABLE 3 GLOBAL HYPERAUTOMATION IN SECURITY MARKET, BY TECHNOLOGY, 2018–2030 (USD MILLION)
      5. TABLE 4 GLOBAL HYPERAUTOMATION IN SECURITY MARKET, BY ORGANIZATION SIZE, 2018–2030 (USD MILLION)
      6. TABLE 5 GLOBAL HYPERAUTOMATION IN SECURITY MARKET, BY INDUSTRY VERTICAL, 2018–2030 (USD MILLION)
      7. TABLE 6 GLOBAL HYPERAUTOMATION IN SECURITY MARKET, BY REGION, 2018–2030 (USD MILLION)
      8. TABLE 7 NORTH AMERICA HYPERAUTOMATION IN SECURITY MARKET, BY COUNTRY, 2018–2030 (USD MILLION)
      9. TABLE 8 NORTH AMERICA HYPERAUTOMATION IN SECURITY MARKET, BY OFFERING, 2018–2030 (USD MILLION)
      10. TABLE 9 NORTH AMERICA HYPERAUTOMATION IN SECURITY MARKET, BY TECHNOLOGY, 2018–2030 (USD MILLION)
      11. TABLE 10 NORTH AMERICA HYPERAUTOMATION IN SECURITY MARKET, BY ORGANIZATION SIZE, 2018–2030 (USD MILLION)
      12. TABLE 11 NORTH AMERICA HYPERAUTOMATION IN SECURITY MARKET, BY INDUSTRY VERTICAL, 2018–2030 (USD MILLION)
      13. TABLE 12 US HYPERAUTOMATION IN SECURITY MARKET, BY OFFERING, 2018–2030 (USD MILLION)
      14. TABLE 13 US HYPERAUTOMATION IN SECURITY MARKET, BY TECHNOLOGY, 2018–2030 (USD MILLION)
      15. TABLE 14 US HYPERAUTOMATION IN SECURITY MARKET, BY ORGANIZATION SIZE, 2018–2030 (USD MILLION)
      16. TABLE 15 US HYPERAUTOMATION IN SECURITY MARKET, BY INDUSTRY VERTICAL, 2018–2030 (USD MILLION)
      17. TABLE 16 CANADA HYPERAUTOMATION IN SECURITY MARKET, BY OFFERING, 2018–2030 (USD MILLION)
      18. TABLE 17 CANADA HYPERAUTOMATION IN SECURITY MARKET, BY TECHNOLOGY, 2018–2030 (USD MILLION)
      19. TABLE 18 CANADA HYPERAUTOMATION IN SECURITY MARKET, BY ORGANIZATION SIZE, 2018–2030 (USD MILLION)
      20. TABLE 19 CANADA HYPERAUTOMATION IN SECURITY MARKET, BY INDUSTRY VERTICAL, 2018–2030 (USD MILLION)
      21. TABLE 20 MEXICO HYPERAUTOMATION IN SECURITY MARKET, BY OFFERING, 2018–2030 (USD MILLION)
      22. TABLE 21 MEXICO HYPERAUTOMATION IN SECURITY MARKET, BY TECHNOLOGY, 2018–2030 (USD MILLION)
      23. TABLE 22 MEXICO HYPERAUTOMATION IN SECURITY MARKET, BY ORGANIZATION SIZE, 2018–2030 (USD MILLION)
      24. TABLE 23 MEXICO HYPERAUTOMATION IN SECURITY MARKET, BY INDUSTRY VERTICAL, 2018–2030 (USD MILLION)
      25. TABLE 24 EUROPE HYPERAUTOMATION IN SECURITY MARKET, BY COUNTRY, 2018–2030 (USD MILLION)
      26. TABLE 25 EUROPE HYPERAUTOMATION IN SECURITY MARKET, BY OFFERING, 2018–2030 (USD MILLION)
      27. TABLE 26 EUROPE HYPERAUTOMATION IN SECURITY MARKET, BY TECHNOLOGY, 2018–2030 (USD MILLION)
      28. TABLE 27 EUROPE HYPERAUTOMATION IN SECURITY MARKET, BY ORGANIZATION SIZE, 2018–2030 (USD MILLION)
      29. TABLE 28 EUROPE HYPERAUTOMATION IN SECURITY MARKET, BY INDUSTRY VERTICAL, 2018–2030 (USD MILLION)
      30. TABLE 29 UK HYPERAUTOMATION IN SECURITY MARKET, BY OFFERING, 2018–2030 (USD MILLION)
      31. TABLE 30 UK HYPERAUTOMATION IN SECURITY MARKET, BY TECHNOLOGY, 2018–2030 (USD MILLION)
      32. TABLE 31 UK HYPERAUTOMATION IN SECURITY MARKET, BY ORGANIZATION SIZE, 2018–2030 (USD MILLION)
      33. TABLE 32 UK HYPERAUTOMATION IN SECURITY MARKET, BY INDUSTRY VERTICAL, 2018–2030 (USD MILLION)
      34. TABLE 33 GERMANY HYPERAUTOMATION IN SECURITY MARKET, BY OFFERING, 2018–2030 (USD MILLION)
      35. TABLE 34 GERMANY HYPERAUTOMATION IN SECURITY MARKET, BY TECHNOLOGY, 2018–2030 (USD MILLION)
      36. TABLE 35 GERMANY HYPERAUTOMATION IN SECURITY MARKET, BY ORGANIZATION SIZE, 2018–2030 (USD MILLION)
      37. TABLE 36 GERMANY HYPERAUTOMATION IN SECURITY MARKET, BY INDUSTRY VERTICAL, 2018–2030 (USD MILLION)
      38. TABLE 37 FRANCE HYPERAUTOMATION IN SECURITY MARKET, BY OFFERING, 2018–2030 (USD MILLION)
      39. TABLE 38 FRANCE HYPERAUTOMATION IN SECURITY MARKET, BY TECHNOLOGY, 2018–2030 (USD MILLION)
      40. TABLE 39 FRANCE HYPERAUTOMATION IN SECURITY MARKET, BY ORGANIZATION SIZE, 2018–2030 (USD MILLION)
      41. TABLE 40 FRANCE HYPERAUTOMATION IN SECURITY MARKET, BY INDUSTRY VERTICAL, 2018–2030 (USD MILLION)
      42. TABLE 41 SPAIN HYPERAUTOMATION IN SECURITY MARKET, BY OFFERING, 2018–2030 (USD MILLION)
      43. TABLE 42 SPAIN HYPERAUTOMATION IN SECURITY MARKET, BY TECHNOLOGY, 2018–2030 (USD MILLION)
      44. TABLE 43 SPAIN HYPERAUTOMATION IN SECURITY MARKET, BY ORGANIZATION SIZE, 2018–2030 (USD MILLION)
      45. TABLE 44 SPAIN HYPERAUTOMATION IN SECURITY MARKET, BY INDUSTRY VERTICAL, 2018–2030 (USD MILLION)
      46. TABLE 45 ITALY HYPERAUTOMATION IN SECURITY MARKET, BY OFFERING, 2018–2030 (USD MILLION)
      47. TABLE 46 ITALY HYPERAUTOMATION IN SECURITY MARKET, BY TECHNOLOGY, 2018–2030 (USD MILLION)
      48. TABLE 47 ITALY HYPERAUTOMATION IN SECURITY MARKET, BY ORGANIZATION SIZE, 2018–2030 (USD MILLION)
      49. TABLE 48 ITALY HYPERAUTOMATION IN SECURITY MARKET, BY INDUSTRY VERTICAL, 2018–2030 (USD MILLION)
      50. TABLE 49 REST OF EUROPE HYPERAUTOMATION IN SECURITY MARKET, BY OFFERING, 2018–2030 (USD MILLION)
      51. TABLE 50 REST OF EUROPE HYPERAUTOMATION IN SECURITY MARKET, BY TECHNOLOGY, 2018–2030 (USD MILLION)
      52. TABLE 51 REST OF EUROPE HYPERAUTOMATION IN SECURITY MARKET, BY ORGANIZATION SIZE, 2018–2030 (USD MILLION)
      53. TABLE 52 REST OF EUROPE HYPERAUTOMATION IN SECURITY MARKET, BY INDUSTRY VERTICAL, 2018–2030 (USD MILLION)
      54. TABLE 53 ASIA-PACIFIC HYPERAUTOMATION IN SECURITY MARKET, BY COUNTRY, 2018–2030 (USD MILLION)
      55. TABLE 54 ASIA-PACIFIC HYPERAUTOMATION IN SECURITY MARKET, BY OFFERING, 2018–2030 (USD MILLION)
      56. TABLE 55 ASIA-PACIFIC HYPERAUTOMATION IN SECURITY MARKET, BY TECHNOLOGY, 2018–2030 (USD MILLION)
      57. TABLE 56 ASIA-PACIFIC HYPERAUTOMATION IN SECURITY MARKET, BY ORGANIZATION SIZE, 2018–2030 (USD MILLION)
      58. TABLE 57 ASIA-PACIFIC HYPERAUTOMATION IN SECURITY MARKET, BY INDUSTRY VERTICAL, 2018–2030 (USD MILLION)
      59. TABLE 58 CHINA HYPERAUTOMATION IN SECURITY MARKET, BY OFFERING, 2018–2030 (USD MILLION)
      60. TABLE 59 CHINA HYPERAUTOMATION IN SECURITY MARKET, BY TECHNOLOGY, 2018–2030 (USD MILLION)
      61. TABLE 60 CHINA HYPERAUTOMATION IN SECURITY MARKET, BY ORGANIZATION SIZE, 2018–2030 (USD MILLION)
      62. TABLE 61 CHINA HYPERAUTOMATION IN SECURITY MARKET, BY INDUSTRY VERTICAL, 2018–2030 (USD MILLION)
      63. TABLE 62 JAPAN HYPERAUTOMATION IN SECURITY MARKET, BY OFFERING, 2018–2030 (USD MILLION)
      64. TABLE 63 JAPAN HYPERAUTOMATION IN SECURITY MARKET, BY TECHNOLOGY, 2018–2030 (USD MILLION)
      65. TABLE 64 JAPAN HYPERAUTOMATION IN SECURITY MARKET, BY ORGANIZATION SIZE, 2018–2030 (USD MILLION)
      66. TABLE 65 JAPAN HYPERAUTOMATION IN SECURITY MARKET, BY INDUSTRY VERTICAL, 2018–2030 (USD MILLION)
      67. TABLE 66 INDIA HYPERAUTOMATION IN SECURITY MARKET, BY OFFERING, 2018–2030 (USD MILLION)
      68. TABLE 67 INDIA HYPERAUTOMATION IN SECURITY MARKET, BY TECHNOLOGY, 2018–2030 (USD MILLION)
      69. TABLE 68 INDIA HYPERAUTOMATION IN SECURITY MARKET, BY ORGANIZATION SIZE, 2018–2030 (USD MILLION)
      70. TABLE 69 INDIA HYPERAUTOMATION IN SECURITY MARKET, BY INDUSTRY VERTICAL, 2018–2030 (USD MILLION)
      71. TABLE 70 SOUTH KOREA HYPERAUTOMATION IN SECURITY MARKET, BY OFFERING, 2018–2030 (USD MILLION)
      72. TABLE 71 SOUTH KOREA HYPERAUTOMATION IN SECURITY MARKET, BY TECHNOLOGY, 2018–2030 (USD MILLION)
      73. TABLE 72 SOUTH KOREA HYPERAUTOMATION IN SECURITY MARKET, BY ORGANIZATION SIZE, 2018–2030 (USD MILLION)
      74. TABLE 73 SOUTH KOREA HYPERAUTOMATION IN SECURITY MARKET, BY INDUSTRY VERTICAL, 2018–2030 (USD MILLION)
      75. TABLE 74 REST OF ASIA-PACIFIC HYPERAUTOMATION IN SECURITY MARKET, BY OFFERING, 2018–2030 (USD MILLION)
      76. TABLE 75 REST OF ASIA-PACIFIC HYPERAUTOMATION IN SECURITY MARKET, BY TECHNOLOGY, 2018–2030 (USD MILLION)
      77. TABLE 76 REST OF ASIA-PACIFIC HYPERAUTOMATION IN SECURITY MARKET, BY ORGANIZATION SIZE, 2018–2030 (USD MILLION)
      78. TABLE 77 REST OF ASIA-PACIFIC HYPERAUTOMATION IN SECURITY MARKET, BY INDUSTRY VERTICAL, 2018–2030 (USD MILLION)
      79. TABLE 78 REST OF THE WORLD HYPERAUTOMATION IN SECURITY MARKET, BY OFFERING, 2018–2030 (USD MILLION)
      80. TABLE 79 REST OF THE WORLD HYPERAUTOMATION IN SECURITY MARKET, BY TECHNOLOGY, 2018–2030 (USD MILLION)
      81. TABLE 80 REST OF THE WORLD HYPERAUTOMATION IN SECURITY MARKET, BY ORGANIZATION SIZE, 2018–2030 (USD MILLION)
      82. TABLE 81 REST OF THE WORLD HYPERAUTOMATION IN SECURITY MARKET, BY INDUSTRY VERTICAL, 2018–2030 (USD MILLION)
      83. TABLE 82 MIDDLE EAST HYPERAUTOMATION IN SECURITY MARKET, BY OFFERING, 2018–2030 (USD MILLION)
      84. TABLE 83 MIDDLE EAST HYPERAUTOMATION IN SECURITY MARKET, BY TECHNOLOGY, 2018–2030 (USD MILLION)
      85. TABLE 84 MIDDLE EAST HYPERAUTOMATION IN SECURITY MARKET, BY ORGANIZATION SIZE, 2018–2030 (USD MILLION)
      86. TABLE 85 MIDDLE EAST HYPERAUTOMATION IN SECURITY MARKET, BY INDUSTRY VERTICAL, 2018–2030 (USD MILLION)
      87. TABLE 86 AFRICA HYPERAUTOMATION IN SECURITY MARKET, BY OFFERING, 2018–2030 (USD MILLION)
      88. TABLE 87 AFRICA HYPERAUTOMATION IN SECURITY MARKET, BY TECHNOLOGY, 2018–2030 (USD MILLION)
      89. TABLE 88 AFRICA HYPERAUTOMATION IN SECURITY MARKET, BY ORGANIZATION SIZE, 2018–2030 (USD MILLION)
      90. TABLE 89 AFRICA HYPERAUTOMATION IN SECURITY MARKET, BY INDUSTRY VERTICAL, 2018–2030 (USD MILLION)
      91. TABLE 90 SOUTH AMERICA HYPERAUTOMATION IN SECURITY MARKET, BY OFFERING, 2018–2030 (USD MILLION)
      92. TABLE 91 SOUTH AMERICA HYPERAUTOMATION IN SECURITY MARKET, BY TECHNOLOGY, 2018–2030 (USD MILLION)
      93. TABLE 92 SOUTH AMERICA HYPERAUTOMATION IN SECURITY MARKET, BY ORGANIZATION SIZE, 2018–2030 (USD MILLION)
      94. TABLE 93 SOUTH AMERICA HYPERAUTOMATION IN SECURITY MARKET, BY INDUSTRY VERTICAL, 2018–2030 (USD MILLION)
      95. TABLE 94 BUSINESS EXPANSIONS/PRODUCT LAUNCHES
      96. TABLE 95 PARTNERSHIPS/AGREEMENTS/CONTRACTS/COLLABORATIONS
      97. TABLE 96 ACQUISITIONS/MERGERS
      98. TABLE 97 SIRP LABS LIMITED : PRODUCTS OFFERED
      99. TABLE 98 SIRP LABS LIMITED: KEY DEVELOPMENT
      100. TABLE 99 TORQ : PRODUCTS OFFERED
      101. TABLE 100 TORQ : KEY DEVELOPMENT
      102. TABLE 101 MINDFLOW: PRODUCTS OFFERED
      103. TABLE 102 MINDFLOW : KEY DEVELOPMENT
      104. TABLE 103 WIPRO. : PRODUCTS OFFERED
      105. TABLE 104 WIPRO : KEY DEVELOPMENT
      106. TABLE 105 D3 SECURITY : PRODUCTS OFFERED
      107. TABLE 106 D3 SECURITY : KEY DEVELOPMENT
      108. TABLE 107 CLOUD4C : PRODUCTS OFFERED
      109. TABLE 108 CLOUD4C : KEY DEVELOPMENT
      110. TABLE 109 SONRAI SECURITY : PRODUCTS OFFERED
      111. TABLE 110 SONRAI SECURITY: KEY DEVELOPMENT
      112. TABLE 111 ZOHO CORPORATION PVT. LTD.. : PRODUCTS OFFERED
      113. TABLE 112 ZOHO CORPORATION PVT. LTD.: KEY DEVELOPMENT
      114. TABLE 113 UIPATH : PRODUCTS OFFERED
      115. TABLE 114 UIPATH : KEY DEVELOPMENT
      116. TABLE 115 IVANTI: PRODUCTS OFFERED
      117. TABLE 116 IVANTI: KEY DEVELOPMENT   LIST OF FIGURES
      118. FIGURE 1 MARKET SYNOPSIS 26
      119. FIGURE 1 MARKET ATTRACTIVENESS ANALYSIS: GLOBAL HYPERAUTOMATION IN SECURITY MARKET
      120. FIGURE 2 GLOBAL HYPERAUTOMATION IN SECURITY MARKET: MARKET STRUCTURE
      121. FIGURE 3 BOTTOM-UP AND TOP-DOWN APPROACHES
      122. FIGURE 4 NORTH AMERICA: HYPERAUTOMATION IN SECURITY MARKET SIZE (USD MILLION) & MARKET SHARE (%), BY COUNTRY (2022 VS 2032)
      123. FIGURE 5 EUROPE: HYPERAUTOMATION IN SECURITY MARKET SIZE (USD MILLION) & MARKET SHARE (%), BY COUNTRY (2022 VS 2032)
      124. FIGURE 6 ASIA–PACIFIC: HYPERAUTOMATION IN SECURITY MARKET SIZE (USD MILLION) & MARKET SHARE (%), BY COUNTRY (2022 VS 2032)
      125. FIGURE 7 GLOBAL HYPERAUTOMATION IN SECURITY MARKET SIZE (USD MILLION) & MARKET SHARE (%), BY OFFERING (2022 VS 2032)
      126. FIGURE 8 GLOBAL HYPERAUTOMATION IN SECURITY MARKET SIZE (USD MILLION) & MARKET SHARE (%), BY TECHNOLOGY (2022 VS 2032)
      127. FIGURE 9 GLOBAL HYPERAUTOMATION IN SECURITY MARKET SIZE (USD MILLION) & MARKET SHARE (%), BY ORGANIZATION SIZE (2022 VS 2032)
      128. FIGURE 10 GLOBAL HYPERAUTOMATION IN SECURITY MARKET SIZE (USD MILLION) & MARKET SHARE (%), BY INDUSTRY VERTICAL (2022 VS 2032)
      129. FIGURE 11 GLOBAL HYPERAUTOMATION IN SECURITY MARKET SIZE (USD MILLION) & MARKET SHARE (%), BY APPLICATION (2022 VS 2032)
      130. FIGURE 12 MARKET DYNAMIC ANALYSIS OF THE GLOBAL HYPERAUTOMATION IN SECURITY MARKET
      131. FIGURE 13 DRIVER IMPACT ANALYSIS
      132. FIGURE 14 RESTRAINT IMPACT ANALYSIS
      133. FIGURE 15 VALUE CHAIN: GLOBAL HYPERAUTOMATION IN SECURITY MARKET
      134. FIGURE 16 PORTER''S FIVE FORCES ANALYSIS OF THE GLOBAL HYPERAUTOMATION IN SECURITY MARKET
      135. FIGURE 17 GLOBAL HYPERAUTOMATION IN SECURITY MARKET, BY OFFERING, 2022 (% SHARE)
      136. FIGURE 18 GLOBAL HYPERAUTOMATION IN SECURITY MARKET, BY OFFERING, 2022 VS 2032 (USD MILLION)
      137. FIGURE 19 GLOBAL HYPERAUTOMATION IN SECURITY MARKET, BY TECHNOLOGY, 2022 (% SHARE)
      138. FIGURE 20 GLOBAL HYPERAUTOMATION IN SECURITY MARKET, BY TECHNOLOGY, 2022 VS 2032 (USD MILLION)
      139. FIGURE 21 GLOBAL HYPERAUTOMATION IN SECURITY MARKET, BY ORGANIZATION SIZE, 2022 (% SHARE)
      140. FIGURE 22 GLOBAL HYPERAUTOMATION IN SECURITY MARKET, BY ORGANIZATION SIZE, 2022 VS 2032 (USD MILLION)
      141. FIGURE 23 GLOBAL HYPERAUTOMATION IN SECURITY MARKET, BY INDUSTRY VERTICAL, 2022 (% SHARE)
      142. FIGURE 24 GLOBAL HYPERAUTOMATION IN SECURITY MARKET, BY INDUSTRY VERTICAL, 2022 VS 2032 (USD MILLION)
      143. FIGURE 25 GLOBAL HYPERAUTOMATION IN SECURITY MARKET, BY REGION, 2022 (% SHARE)
      144. FIGURE 26 GLOBAL HYPERAUTOMATION IN SECURITY MARKET, BY REGION, 2022 VS 2032 (USD MILLION)
      145. FIGURE 27 NORTH AMERICA HYPERAUTOMATION IN SECURITY MARKET, BY COUNTRY, 2022 (% SHARE)
      146. FIGURE 28 NORTH AMERICA HYPERAUTOMATION IN SECURITY MARKET, BY COUNTRY, 2022 VS 2032 (USD MILLION)
      147. FIGURE 29 NORTH AMERICA HYPERAUTOMATION IN SECURITY MARKET, BY OFFERING, 2022-2032 (USD MILLION)
      148. FIGURE 30 NORTH AMERICA HYPERAUTOMATION IN SECURITY MARKET, BY TECHNOLOGY, 2022-2032 (USD MILLION)
      149. FIGURE 31 NORTH AMERICA HYPERAUTOMATION IN SECURITY MARKET, BY ORGANIZATION SIZE, 2022-2032 (USD MILLION)
      150. FIGURE 32 NORTH AMERICA HYPERAUTOMATION IN SECURITY MARKET, BY INDUSTRY VERTICAL, 2022-2032 (USD MILLION)
      151. FIGURE 33 EUROPE HYPERAUTOMATION IN SECURITY MARKET, BY COUNTRY, 2022 (% SHARE)
      152. FIGURE 34 EUROPE HYPERAUTOMATION IN SECURITY MARKET, BY COUNTRY, 2022 VS 2032 (USD MILLION)
      153. FIGURE 35 EUROPE HYPERAUTOMATION IN SECURITY MARKET, BY OFFERING, 2022-2032 (USD MILLION)
      154. FIGURE 36 EUROPE HYPERAUTOMATION IN SECURITY MARKET, BY TECHNOLOGY, 2022-2032 (USD MILLION)
      155. FIGURE 37 EUROPE HYPERAUTOMATION IN SECURITY MARKET, BY ORGANIZATION SIZE, 2022-2032 (USD MILLION)
      156. FIGURE 38 EUROPE HYPERAUTOMATION IN SECURITY MARKET, BY INDUSTRY VERTICAL, 2022-2032 (USD MILLION)
      157. FIGURE 39 ASIA-PACIFIC HYPERAUTOMATION IN SECURITY MARKET, BY COUNTRY, 2022 (% SHARE)
      158. FIGURE 40 ASIA-PACIFIC HYPERAUTOMATION IN SECURITY MARKET, BY COUNTRY, 2022 VS 2032 (USD MILLION)
      159. FIGURE 41 ASIA-PACIFIC HYPERAUTOMATION IN SECURITY MARKET, BY OFFERING, 2022-2032 (USD MILLION)
      160. FIGURE 42 ASIA-PACIFIC HYPERAUTOMATION IN SECURITY MARKET, BY TECHNOLOGY, 2022-2032 (USD MILLION)
      161. FIGURE 43 ASIA-PACIFIC HYPERAUTOMATION IN SECURITY MARKET, BY ORGANIZATION SIZE, 2022-2032 (USD MILLION)
      162. FIGURE 44 ASIA-PACIFIC HYPERAUTOMATION IN SECURITY MARKET, BY INDUSTRY VERTICAL, 2022-2032 (USD MILLION)
      163. FIGURE 45 REST OF THE WORLD HYPERAUTOMATION IN SECURITY MARKET, BY OFFERING, 2022-2032 (USD MILLION)
      164. FIGURE 46 REST OF THE WORLD HYPERAUTOMATION IN SECURITY MARKET, BY TECHNOLOGY, 2022-2032 (USD MILLION)
      165. FIGURE 47 REST OF THE WORLD HYPERAUTOMATION IN SECURITY MARKET, BY ORGANIZATION SIZE, 2022-2032 (USD MILLION)
      166. FIGURE 48 REST OF THE WORLD HYPERAUTOMATION IN SECURITY MARKET, BY INDUSTRY VERTICAL, 2022-2032 (USD MILLION)
      167. FIGURE 49 MIDDLE EAST HYPERAUTOMATION IN SECURITY MARKET, BY OFFERING, 2022-2032 (USD MILLION)
      168. FIGURE 50 MIDDLE EAST HYPERAUTOMATION IN SECURITY MARKET, BY TECHNOLOGY, 2022-2032 (USD MILLION)
      169. FIGURE 51 MIDDLE EAST HYPERAUTOMATION IN SECURITY MARKET, BY ORGANIZATION SIZE, 2022-2032 (USD MILLION)
      170. FIGURE 52 MIDDLE EAST HYPERAUTOMATION IN SECURITY MARKET, BY INDUSTRY VERTICAL, 2022-2032 (USD MILLION)
      171. FIGURE 53 AFRICA HYPERAUTOMATION IN SECURITY MARKET, BY OFFERING, 2022-2032 (USD MILLION)
      172. FIGURE 54 AFRICA HYPERAUTOMATION IN SECURITY MARKET, BY TECHNOLOGY, 2022-2032 (USD MILLION)
      173. FIGURE 55 AFRICA HYPERAUTOMATION IN SECURITY MARKET, BY ORGANIZATION SIZE, 2022-2032 (USD MILLION)
      174. FIGURE 56 AFRICA HYPERAUTOMATION IN SECURITY MARKET, BY INDUSTRY VERTICAL, 2022-2032 (USD MILLION)
      175. FIGURE 57 SOUTH AMERICA HYPERAUTOMATION IN SECURITY MARKET, BY OFFERING, 2022-2032 (USD MILLION)
      176. FIGURE 58 SOUTH AMERICA HYPERAUTOMATION IN SECURITY MARKET, BY TECHNOLOGY, 2022-2032 (USD MILLION)
      177. FIGURE 59 SOUTH AMERICA HYPERAUTOMATION IN SECURITY MARKET, BY ORGANIZATION SIZE, 2022-2032 (USD MILLION)
      178. FIGURE 60 SOUTH AMERICA HYPERAUTOMATION IN SECURITY MARKET, BY INDUSTRY VERTICAL, 2022-2032 (USD MILLION)
      179. FIGURE 61 GLOBAL HYPERAUTOMATION IN SECURITY MARKET: COMPETITIVE BENCHMARKING
      180. FIGURE 62 VENDOR SHARE ANALYSIS (2022) (%)
      181. FIGURE 63

    Hyperautomation in Security Market Segmentation

    Market Segmentation Overview

    • Detailed segmentation data will be available in the full report
    • Comprehensive analysis by multiple parameters
    • Regional and country-level breakdowns
    • Market size forecasts by segment
    Infographic

    Free Sample Request

    Kindly complete the form below to receive a free sample of this Report

    Get Free Sample

    Customer Strories

    “I am very pleased with how market segments have been defined in a relevant way for my purposes (such as "Portable Freezers & refrigerators" and "last-mile"). In general the report is well structured. Thanks very much for your efforts.”

    Victoria Milne

    Founder
    Case Study
    Chemicals and Materials