• Cat-intel
  • MedIntelliX
  • Resources
  • About Us
  • Hero Background
    English
    Chinese
    French
    Japanese
    Korean
    German
    Spanish

    Gas Liquid Argon Market Share

    ID: MRFR/CnM/5649-CR
    235 Pages
    Anshula Mandaokar
    January 2019

    Gas and Liquid Argon Market Research Report Information by Type (Gas, Liquid), by Mixture (Ar-CO2, Ar-O2, Ar-He, Ar-H2, Others), by Function (Cooling, Illumination, Illusion), by End-use (Welding & Metal Fabrication, Automotive & Transportation, Food & Beverage, Healthcare, Electronics, Energy, Others), and Region - Forecast to 2035

    Share:
    Download PDF ×

    We do not share your information with anyone. However, we may send you emails based on your report interest from time to time. You may contact us at any time to opt-out.

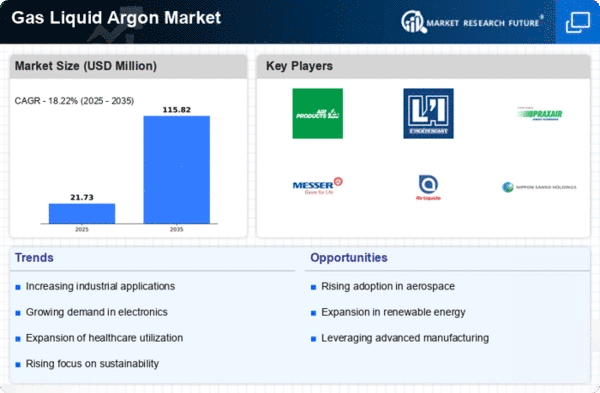
    Gas Liquid Argon Market Infographic
    $ 4,950.0
    $ 5,950.0
    $ 7,250.0

    Market Share

    Gas Liquid Argon Market Share Analysis

    In the fiercely competitive Gas and Liquid Argon Market, companies strategically deploy a range of market share positioning strategies to carve out a robust presence and gain a competitive edge. One primary strategy involves differentiation, where companies focus on providing high-purity gas and liquid argon with unique features such as low impurities, precise cryogenic properties, or tailored solutions for specific industries like metal fabrication, healthcare, and electronics. By investing in research and development, companies can develop innovative purification processes and applications, setting themselves apart from competitors and securing a significant market share. Differentiation not only attracts customers seeking specialized argon solutions but also enhances the overall perceived value of these products in the market.

    Cost leadership is another crucial strategy employed by companies in the Gas and Liquid Argon Market. This approach centers on becoming a low-cost producer through optimized production processes, economies of scale, and efficient supply chain management. Emphasizing cost efficiency enables companies to offer competitive pricing for their argon products, making them appealing to cost-conscious customers and gaining a larger market share. The successful execution of this strategy demands continuous improvement, innovative production methods, and a keen focus on operational excellence to maintain profitability while providing cost-competitive gases and liquids.

    Strategic alliances and partnerships play a pivotal role in shaping the market share positioning of companies in the Gas and Liquid Argon Market. Collaborating with key stakeholders such as industrial gas suppliers, metal manufacturers, or healthcare institutions allows companies to access essential resources, cutting-edge technologies, and distribution channels. Through strategic partnerships, companies can expand their market reach, leverage shared expertise, and create synergies that enhance their overall competitive position. This collaborative approach fosters innovation, accelerates market penetration, and contributes to a more robust market presence.

    Geographical expansion is a strategic imperative for companies aiming to increase their market share in the Gas and Liquid Argon Market. Identifying and entering new markets or expanding existing operations globally allows companies to tap into regions with growing demand for industrial gases. Adapting products and services to suit the unique requirements of different markets is crucial for success in geographical expansion. This strategy enables companies to diversify their customer base, reduce dependency on specific regions, and strengthen their market share on a global scale.

    Furthermore, a customer-centric approach is indispensable for gaining and maintaining market share in the Gas and Liquid Argon Market. Understanding customer needs, providing technical support, and offering excellent customer service contribute to building strong relationships. Companies that prioritize customer satisfaction often benefit from increased loyalty, positive word-of-mouth marketing, and repeat business, ultimately solidifying their market share. As industries increasingly rely on argon for various applications, aligning products and services with customer expectations becomes crucial for sustained success in the Gas and Liquid Argon Market.

    Author
    Anshula Mandaokar
    Team Lead - Research

    Anshula Mandaokar holds an academic degree in Chemical Engineering and has been contributing to the field for more than 5 years. She has expertise in Market Research and Business Consulting and serves as a Team Lead for a reputed Market Research firm under the Chemicals and Materials domain spectrum. She has worked on multiple projects, generating explicit results in a quick turnaround time. Her understanding of data interpretation justifies her role as a leader.

    Leave a Comment

    FAQs

    At what CAGR is the Gas and Liquid Argon Market predicted to grow during the forecast period?

    Gas and Liquid Argon Market is predicted to grow at 5.52% through forecast period of 2025-2035.

    What is the forecast period of Gas and Liquid Argon Market research report?

    The forecast period for Gas and Liquid Argon Market research report is 2025-2035.

    Which region will lead the global Gas and Liquid Argon Market?

    Gas and Liquid Argon Market is dominated by APAC region.

    What are the key factors driving the Gas and Liquid Argon Market?

    The high operation costs and complex manufacturing process of argon is also likely to compel end users to look for alternatives, which could hinder the growth prospects of the global gas and liquid argon market over the forecast period.

    Who are the key players in the Gas and Liquid Argon Market?

    Air Liquide (France), Praxair Inc. (U.S.), Messer Group (Germany), Eurochem (Switzerland), BASF SE (Germany), Nippon Shokubai Co. Ltd. (Japan), SOL Spa (Italy), SABIC (Saudi Arabia), The Linde Group (Germany), and Air Products and Chemicals Inc.

    Market Summary

    As per Market Research Future Analysis, the global gas and liquid argon market is projected to grow at a CAGR of 5.52% from 2022 to 2030, reaching a valuation of USD 475.3 million by 2030. Argon is widely used in metalworking applications, particularly in welding and steel production, to prevent reactions with ambient elements. The increasing demand for argon in the electronics and energy sectors, along with its expanding applications in healthcare, are key drivers of market growth. However, the rising adoption of structural adhesives in welding may hinder market expansion. The market is segmented by type, mixture, function, end-use industry, and region, with Asia Pacific holding the largest market share in 2016, followed by North America and Europe.

    Key Market Trends & Highlights

    The gas and liquid argon market is characterized by several key trends and developments.

    • Market projected to reach USD 475.3 million by 2030.
    • CAGR of 5.52% during the assessment period (2022-2030).
    • Asia Pacific held the major market share in 2016.
    • Increased use of argon in electronics and energy sectors expected to drive growth.

    Market Size & Forecast

    Market Size in 2022 USD 475.3 million
    Projected CAGR 5.52%
    Largest Regional Market Share in 2016 Asia Pacific
    Key End-Use Industries Welding and Metal Fabrication, Automotive, Electronics, Healthcare.

    Major Players

    Major companies include Air Liquide (France), Praxair Inc. (U.S.), Messer Group (Germany), Eurochem (Switzerland), BASF SE (Germany), Nippon Shokubai Co. Ltd. (Japan), SOL Spa (Italy), SABIC (Saudi Arabia), The Linde Group (Germany), and Air Products and Chemicals Inc. (U.S.).

    Market Trends

    The global demand for gas and liquid argon is anticipated to grow steadily, driven by its increasing applications in industries such as electronics, healthcare, and metal fabrication.

    U.S. Geological Survey (USGS)

    Gas Liquid Argon Market Market Drivers

    Rising Use in Metal Fabrication

    The Global Gas and Liquid Argon Market Industry is significantly influenced by the rising use of argon in metal fabrication processes, particularly in welding and cutting applications. Argon serves as a shielding gas that enhances the quality of welds and prevents oxidation, making it essential in industries such as automotive and construction. As manufacturing processes become more sophisticated, the demand for high-quality welding solutions is likely to increase. This trend is expected to support a compound annual growth rate of 5.29% from 2025 to 2035, reflecting the ongoing importance of argon in industrial applications.

    Expansion of Healthcare Applications

    The Global Gas and Liquid Argon Market Industry is witnessing a significant expansion in healthcare applications, particularly in medical imaging and cryotherapy. Argon is utilized in various medical devices, including lasers for surgical procedures and cryoablation therapies. The increasing prevalence of chronic diseases and the growing emphasis on advanced medical technologies are likely to drive the demand for argon in healthcare. As hospitals and clinics invest in state-of-the-art equipment, the market is expected to benefit from this trend, contributing to an anticipated market value of 621.8 USD Million by 2035.

    Technological Advancements in Production

    Technological advancements in the production of gas and liquid argon are poised to drive growth within the Global Gas and Liquid Argon Market Industry. Innovations in cryogenic distillation and gas separation technologies enhance the efficiency and purity of argon production, reducing operational costs for manufacturers. As these technologies become more widely adopted, they may facilitate increased supply and lower prices, making argon more accessible to various industries. This could lead to a broader application range and stimulate market growth, aligning with the projected increase in market value.

    Growing Demand in Electronics Manufacturing

    The Global Gas and Liquid Argon Market Industry experiences a notable surge in demand driven by the electronics manufacturing sector. Argon is extensively utilized in the production of semiconductors and other electronic components due to its inert properties, which prevent contamination during manufacturing processes. As the global electronics market expands, particularly in regions such as Asia-Pacific, the need for high-purity argon is expected to rise. This trend is reflected in the projected market value of 352.8 USD Million in 2024, indicating a robust growth trajectory as industries increasingly rely on argon for precision applications.

    Environmental Regulations Favoring Inert Gases

    The Global Gas and Liquid Argon Market Industry is positively impacted by stringent environmental regulations that favor the use of inert gases like argon. These regulations encourage industries to adopt cleaner technologies and processes, particularly in sectors such as welding and metal fabrication, where argon serves as a safer alternative to more hazardous gases. As companies strive to comply with environmental standards, the demand for argon is likely to rise, contributing to the overall growth of the market. This trend aligns with the increasing awareness of environmental sustainability across various industries.

    Market Segment Insights

    Regional Insights

    Key Companies in the Gas Liquid Argon Market market include

    Industry Developments

    Bruker released a few novel apps in 2019 to improve its product category and expand its product portfolio. G6 Leonardo, for example, is an inert gas fusion analyzer. The machinery is dependable, precise, and cost-effective. The machine includes pre-calibrated standard procedures as well as argon, which helps to streamline a variety of industrial operations. Air Products stated in December 2018 that it would construct, own, and operate a new

    air separation

    unit (ASU) in Minnesota to create huge amounts of argon, oxygen, and nitrogen. Mostly for local customers and distributors, these will be accessible in liquid form.

    Future Outlook

    Gas Liquid Argon Market Future Outlook

    The Gas and Liquid Argon Market is projected to grow at a 5.29% CAGR from 2024 to 2035, driven by increasing demand in healthcare, electronics, and metal fabrication sectors.

    New opportunities lie in:

    • Develop advanced argon purification technologies to enhance product quality.
    • Expand distribution networks in emerging markets to capture new customer segments.
    • Invest in R&D for innovative applications of argon in renewable energy solutions.

    By 2035, the Gas and Liquid Argon Market is expected to demonstrate robust growth and increased market penetration.

    Market Segmentation

    Report Overview

    Analysis Period
    • Base Year – 2017
    • Projection Period - From 2018 to 2023
    • Market Valuation - USD Million
    • Market Volume - Kilotons

    Report Scope

    Report Attribute/Metric Details
      Market Size   2030: USD 475.3 million
      CAGR   5.52%
      Base Year   2021
      Forecast Period   2022 to 2030
      Historical Data   2019 & 2020
      Forecast Units   Value (USD Million)
      Report Coverage   
      Segments Covered   Type, Mixture, Function, End-Use Industry ands region
      Geographies Covered    North America, Europe, Asia-Pacific, and Rest of the World (RoW)
      Key Vendors   Air Liquide (France), Praxair Inc. (U.S.), Messer Group (Germany), Eurochem (Switzerland), BASF SE (Germany), Nippon Shokubai Co. Ltd. (Japan), SOL Spa (Italy), SABIC (Saudi Arabia), The Linde Group (Germany), and Air Products and Chemicals Inc. (U.S.).
      Key Market Opportunities   Growth matrix given in the report brings an insight into the investment areas that existing or new market players can consider.
      Key Market Drivers   The high operation costs and complex manufacturing process of argon is also likely to compel end users to look for alternatives, which could hinder the growth prospects of the global gas and liquid argon market over the forecast period.

    Market Highlights

    Author

    Anshula Mandaokar
    Team Lead - Research

    She holds an experience of about 6+ years in market research and business consulting, working under the spectrum of information communication technology, telecommunications and semiconductor domains. aarti conceptualizes and implements a scalable business strategy and provides strategic leadership to the clients. her expertise lies in market estimation, competitive intelligence, pipeline analysis, customer assessment, etc.

    Leave a Comment

    Latest Comments

    John Doe
    john@example.com

    This is a great article! Really helped me understand the topic better.

    Posted on July 23, 2025, 10:15 AM
    Jane Smith
    jane@domain.com

    Thanks for sharing this. I’ve bookmarked it for later reference.

    Posted on July 22, 2025, 7:45 PM

    FAQs

    At what CAGR is the Gas and Liquid Argon Market predicted to grow during the forecast period?

    Gas and Liquid Argon Market is predicted to grow at 5.52% through forecast period of 2025-2035.

    What is the forecast period of Gas and Liquid Argon Market research report?

    The forecast period for Gas and Liquid Argon Market research report is 2025-2035.

    Which region will lead the global Gas and Liquid Argon Market?

    Gas and Liquid Argon Market is dominated by APAC region.

    What are the key factors driving the Gas and Liquid Argon Market?

    The high operation costs and complex manufacturing process of argon is also likely to compel end users to look for alternatives, which could hinder the growth prospects of the global gas and liquid argon market over the forecast period.

    Who are the key players in the Gas and Liquid Argon Market?

    Air Liquide (France), Praxair Inc. (U.S.), Messer Group (Germany), Eurochem (Switzerland), BASF SE (Germany), Nippon Shokubai Co. Ltd. (Japan), SOL Spa (Italy), SABIC (Saudi Arabia), The Linde Group (Germany), and Air Products and Chemicals Inc.

    1. Executive Summary
    2. Market Introduction
      1. Definition 23
      2. Scope Of The Study 23
      3. List Of
      4. Assumptions 24
      5. Market Structure 24
      6. Key Takeaways 25
    3. Market Insights
    4. Research Methodology
      1. Research Process 31
      2. Primary Research 32
      3. Secondary
      4. Research 33
      5. Market Size Estimation 33
      6. Forecast Model
      7. 34
    5. Market Dynamics
      1. Introduction 36
      2. Drivers
        1. Widespread Use In Metal Fabrication And Production 37
        2. Growing Demand For Products In Electronics And Energy Industries 37
        3. Drivers Impact Analysis 38
      3. 37
      4. Restraints 38
        1. Restraints Impact Analysis 39
      5. 5.3.1
      6. Emergence Of Structural Adhesive As A Substitutable Welding Technology 38
      7. Opportunities 39
      8. 5.4.1
      9. Widening Scope Of Application In The Healthcare Sector 39
      10. Challenges
        1. Complexity Of The Manufacturing Process And High Operational
      11. 40
      12. Cost 40
    6. Market Factor Analysis
      1. Supply Chain Analysis
        1. Raw Material 42
        2. Gas And Liquid Argon Producers
        3. Distributors 43
        4. End-Use Industry 43
      2. 42
      3. 42
      4. Porter’s Five Forces Model 43
        1. Threat Of New Entrants
        2. Threat Of Rivalry 44
        3. Threat Of Substitutes
        4. Bargaining Power Of Suppliers 44
        5. Bargaining
      5. 44
      6. 44
      7. Power Of Buyers 44
    7. Global Gas And Liquid Argon Market, By Type
      1. Introduction 46
      2. Gas 47
      3. Liquid 48
      4. 8
    8. Global Gas And Liquid Argon Market, By Mixture
      1. Introduction 51
      2. Ar-CO2 53
      3. Ar-O2 54
      4. Ar-He 55
      5. 8.5
      6. Ar-H2 56
      7. Others 57
    9. Global Gas And Liquid Argon Market,
      1. By Function
      2. Introduction 59
      3. Cooling 61
      4. 9.3
      5. Illumination 62
      6. Insulation 63
    10. Global Gas And Liquid
    11. Argon Market, By End-Use Industry
      1. Introduction 65
      2. 10.2
      3. Welding And Metal Fabrication 67
      4. Automotive And Transportation 68
      5. Electronics 69
      6. Food & Beverages 70
      7. 10.6
      8. Healthcare 71
      9. Energy 72
      10. Others 73
      11. 11
    12. Global Gas And Liquid Argon Market, By Region
      1. Introduction 75
      2. North America 81
        1. U.S. 85
        2. Canada
      3. 88
      4. Europe 92
        1. Germany 96
        2. UK 100
        3. France 103
        4. Russia 107
        5. Spain 110
        6. Italy 114
        7. Poland 118
        8. Rest Of
      5. Europe 121
      6. Asia Pacific 125
        1. China 129
        2. Japan 133
        3. India 136
        4. South Korea 140
        5. Australia And New Zealand 143
        6. Thailand 147
        7. Malaysia 150
        8. Indonesia 154
        9. Rest Of
      7. Asia Pacific 157
      8. The Middle East And Africa 161
        1. Israel 169
        2. UAE 172
        3. Egypt 179
        4. Rest Of Middle East
      9. 11.5.1
      10. Turkey 165
      11. 11.5.4
      12. Saudi Arabia 176
      13. And Africa 183
      14. Latin America 187
        1. Brazil 191
        2. Mexico 195
        3. Argentina 198
        4. Rest
      15. Of Latin America 202
    13. Competitive Landscape
      1. Competitive
        1. Introduction 207
        2. Key Development
        3. Market Strategy Analysis 209
      2. Landscape 207
      3. Analysis 207
    14. Company
      1. Profiles
      2. Air Liquide 211
        1. Company Overview 211
        2. Financial Overview 211
        3. Products Offered 212
        4. Key Developments 212
        5. SWOT Analysis 213
        6. Key Strategies 213
      3. Air Products And Chemicals, Inc 214
        1. Company Overview 214
        2. Financial Overview 214
        3. Products Offered 214
        4. Key Developments 215
        5. SWOT Analysis 215
        6. Key Strategies 215
        7. Company Overview 216
        8. Financial
        9. Products Offered 216
        10. Key Developments
        11. SWOT Analysis 217
        12. Key Strategies 217
      4. 13.3
      5. Praxair, Inc 216
      6. Overview 216
      7. 217
      8. The Linde Group 218
        1. Company Overview 218
        2. Financial Overview 218
        3. Products Offered 218
        4. Key Developments 219
        5. SWOT Analysis 219
      9. 13.4.6
      10. Key Strategies 219
      11. Messer Group 220
        1. Company Overview
        2. Financial Overview 220
        3. Products Offered
        4. Key Developments 221
        5. SWOT Analysis 222
        6. Key Strategies 222
      12. 220
      13. 221
      14. SABIC 223
        1. Company
        2. Financial Overview 223
        3. Products
        4. Key Developments 224
        5. SWOT Analysis
        6. Key Strategies 224
      15. Overview 223
      16. Offered 224
      17. 224
      18. Eurochem 225
        1. Financial Overview 225
        2. Key Developments 226
        3. SWOT
        4. Key Strategies 226
      19. 13.7.1
      20. Company Overview 225
      21. 13.7.3
      22. Products Offered 226
      23. Analysis 226
      24. SOL Spa 227
        1. Company Overview 227
        2. Products Offered 228
        3. Key Developments 228
        4. SWOT Analysis 228
      25. 13.8.5
      26. Key Strategies 228
      27. BASF SE 229
        1. Company Overview
        2. Financial Overview 229
        3. Products Offered
        4. Key Developments 230
        5. SWOT Analysis 230
        6. Key Strategies 230
      28. 229
      29. 230
      30. Nippon Shokubai Co., Ltd. 231
        1. Company Overview 231
        2. Financial Overview 231
        3. Products Offered 232
        4. Key Developments 232
        5. SWOT Analysis 232
        6. Key Strategies 232
    15. Conclusion
    16. List Of Tables
    17. MARKET SYNOPSIS 21
    18. LIST OF ASSUMPTIONS 24
    19. GLOBAL GAS AND LIQUID ARGON MARKET, BY TYPE, 2020-2027 (USD MILLION)
      1. 46
    20. GLOBAL GAS AND LIQUID ARGON MARKET, BY TYPE, 2020-2027 (KILO
      1. TONS) 47
    21. GLOBAL GAS AND LIQUID ARGON MARKET FOR GAS, BY REGION,
    22. GLOBAL GAS AND LIQUID ARGON MARKET
      1. FOR GAS, BY REGION, 2020-2027 (KILO TONS) 48
    23. GLOBAL GAS AND LIQUID
    24. ARGON MARKET FOR LIQUID, BY REGION, 2020-2027 (USD MILLION) 48
      1. TABLE
    25. GLOBAL GAS AND LIQUID ARGON MARKET FOR LIQUID, BY REGION, 2020-2027 (KILO TONS)
      1. 49
    26. GLOBAL GAS AND LIQUID ARGON, BY MIXTURE, 2020-2027 (USD MILLION)
      1. 51
    27. GLOBAL GAS AND LIQUID ARGON MARKET, BY MIXTURE, 2020-2027
      1. (KILO TONS) 52
    28. GLOBAL GAS AND LIQUID ARGON MARKET FOR AR-CO2,
      1. BY REGION, 2020-2027 (USD MILLION) 53
    29. GLOBAL GAS AND LIQUID
    30. ARGON MARKET FOR AR-CO2, BY REGION, 2020-2027 (KILO TONS) 53
      1. TABLE 13
    31. GLOBAL GAS AND LIQUID ARGON MARKET FOR AR-O2, BY REGION, 2020-2027 (USD MILLION)
      1. 54
    32. GLOBAL GAS AND LIQUID ARGON MARKET FOR AR-O2, BY REGION,
    33. GLOBAL GAS AND LIQUID ARGON MARKET
      1. FOR AR-HE, BY REGION, 2020-2027 (USD MILLION) 55
    34. GLOBAL GAS
    35. AND LIQUID ARGON MARKET FOR AR-HE, BY REGION, 2020-2027 (KILO TONS) 55
    36. GLOBAL GAS AND LIQUID ARGON MARKET FOR AR-H2, BY REGION, 2020-2027 (USD
      1. MILLION) 56
    37. GLOBAL GAS AND LIQUID ARGON MARKET FOR AR-H2, BY
      1. REGION, 2020-2027 (KILO TONS) 56
    38. GLOBAL GAS AND LIQUID ARGON
    39. MARKET FOR OTHERS, BY REGION, 2020-2027 (USD MILLION) 57
    40. GLOBAL
    41. GAS AND LIQUID ARGON MARKET FOR OTHERS, BY REGION, 2020-2027 (KILO TONS) 57
    42. GLOBAL GAS AND LIQUID ARGON, BY FUNCTION, 2020-2027 (USD MILLION) 59
    43. GLOBAL GAS AND LIQUID ARGON MARKET, BY FUNCTION, 2020-2027 (KILO
      1. TONS) 60
    44. GLOBAL GAS AND LIQUID ARGON MARKET FOR COOLING, BY
      1. REGION, 2020-2027 (USD MILLION) 61
    45. GLOBAL GAS AND LIQUID ARGON
    46. MARKET FOR COOLING, BY REGION, 2020-2027 (KILO TONS) 61
    47. GLOBAL
      1. GAS AND LIQUID ARGONMARKET FOR ILLUMINATION, BY REGION, 2020-2027 (USD MILLION)
      2. 62
    48. GLOBAL GAS AND LIQUID ARGON MARKET FOR ILLUMINATION, BY REGION,
    49. GLOBAL GAS AND LIQUID ARGON MARKET
      1. FOR INSULATION, BY REGION, 2020-2027 (USD MILLION) 63
    50. GLOBAL
      1. GAS AND LIQUID ARGONMARKET FOR INSULATION, BY REGION, 2020-2027 (KILO TONS) 63
    51. GLOBAL GAS AND LIQUID ARGON, BY END-USE INDUSTRY, 2020-2027 (USD
      1. MILLION) 65
    52. GLOBAL GAS AND LIQUID ARGON MARKET, BY END-USE INDUSTRY,
    53. GLOBAL GAS AND LIQUID ARGON MARKET
      1. FOR WELDING AND METAL FABRICATION, BY REGION, 2020-2027 (USD MILLION) 67
    54. GLOBAL GAS AND LIQUID ARGON MARKET FOR WELDING AND METAL FABRICATION,
      1. BY REGION, 2020-2027 (KILO TONS) 67
    55. GLOBAL GAS AND LIQUID ARGON
    56. MARKET FOR AUTOMOTIVE AND TRANSPORTATION, BY REGION, 2020-2027 (USD MILLION) 68
    57. GLOBAL GAS AND LIQUID ARGON MARKET FOR AUTOMOTIVE AND TRANSPORTATION,
      1. BY REGION, 2020-2027 (KILO TONS) 68
    58. GLOBAL GAS AND LIQUID ARGON
    59. MARKET FOR ELECTRONICS, BY REGION, 2020-2027 (USD MILLION) 69
      1. TABLE 36
    60. GLOBAL GAS AND LIQUID ARGON MARKET FOR ELECTRONICS, BY REGION, 2020-2027 (KILO TONS)
      1. 69
    61. GLOBAL GAS AND LIQUID ARGON MARKET FOR FOOD & BEVERAGES,
      1. BY REGION, 2020-2027 (USD MILLION) 70
    62. GLOBAL GAS AND LIQUID
    63. ARGON MARKET FOR FOOD & BEVERAGES, BY REGION, 2020-2027 (KILO TONS) 70
    64. GLOBAL GAS AND LIQUID ARGON MARKET FOR HEALTHCARE, BY REGION, 2020-2027
      1. (USD MILLION) 71
    65. GLOBAL GAS AND LIQUID ARGON MARKET FOR HEALTHCARE,
      1. BY REGION, 2020-2027 (KILO TONS) 71
    66. GLOBAL GAS AND LIQUID ARGON
    67. MARKET FOR ENERGY, BY REGION, 2020-2027 (USD MILLION) 72
    68. GLOBAL
    69. GAS AND LIQUID ARGON MARKET FOR ENERGY, BY REGION, 2020-2027 (KILO TONS) 72
    70. GLOBAL GAS AND LIQUID ARGON MARKET FOR OTHERS, BY REGION, 2020-2027 (USD
      1. MILLION) 73
    71. GLOBAL GAS AND LIQUID ARGON MARKET FOR OTHERS, BY
      1. REGION, 2020-2027 (KILO TONS) 73
    72. GLOBAL GAS AND LIQUID ARGON
    73. MARKET, BY REGION, 2020-2027 (USD MILLION) 75
    74. GLOBAL GAS AND
    75. LIQUID ARGON MARKET, BY REGION, 2020-2027 (KILO TONS) 76
    76. GLOBAL
    77. GAS AND LIQUID ARGON MARKET, BY TYPE, 2020-2027 (USD MILLION) 77
      1. TABLE
    78. GLOBAL GAS AND LIQUID ARGON MARKET, BY TYPE, 2020-2027 (KILO TONS) 77
    79. GLOBAL GAS AND LIQUID ARGON MARKET, BY MIXTURE, 2020-2027 (USD MILLION)
      1. 77
    80. GLOBAL GAS AND LIQUID ARGON MARKET, BY MIXTURE, 2020-2027
      1. (KILO TONS) 78
    81. GLOBAL GAS AND LIQUID ARGON MARKET, BY FUNCTION,
    82. GLOBAL GAS AND LIQUID ARGON MARKET,
      1. BY FUNCTION, 2020-2027 (KILO TONS) 78
    83. GLOBAL GAS AND LIQUID
    84. ARGON MARKET, BY END-USE INDUSTRY, 2020-2027 (USD MILLION) 79
      1. TABLE 54
    85. GLOBAL GAS AND LIQUID ARGON MARKET, BY END-USE INDUSTRY, 2020-2027 (KILO TONS) 80
    86. NORTH AMERICA GAS AND LIQUID ARGON MARKET, BY COUNTRY, 2020-2027
      1. (USD MILLION) 81
    87. NORTH AMERICA GAS AND LIQUID ARGONMARKET, BY
      1. COUNTRY, 2020-2027 (KILO TONS) 81
    88. NORTH AMERICA GAS AND LIQUID
    89. ARGON MARKET, BY TYPE, 2020-2027 (USD MILLION) 81
    90. NORTH AMERICA
    91. GAS AND LIQUID ARGON MARKET, BY TYPE, 2020-2027 (KILO TONS) 82
      1. TABLE
    92. NORTH AMERICA GAS AND LIQUID ARGON MARKET, BY MIXTURE, 2020-2027 (USD MILLION)
      1. 82
    93. NORTH AMERICA GAS AND LIQUID ARGON MARKET, BY MIXTURE, 2020-2027
      1. (KILO TONS) 82
    94. NORTH AMERICA GAS AND LIQUID ARGON MARKET, BY
      1. FUNCTION, 2020-2027 (USD MILLION) 83
    95. NORTH AMERICA GAS AND LIQUID
    96. ARGON MARKET, BY FUNCTION, 2020-2027 (KILO TONS) 83
    97. NORTH AMERICA
    98. GAS AND LIQUID ARGON MARKET, BY END-USE INDUSTRY, 2020-2027 (USD MILLION) 84
    99. NORTH AMERICA GAS AND LIQUID ARGON MARKET, BY END-USE INDUSTRY,
    100. U.S. GAS AND LIQUID ARGON MARKET, BY
      1. TYPE, 2020-2027 (USD MILLION) 85
    101. U.S. GAS AND LIQUID ARGON MARKET,
      1. BY TYPE, 2020-2027 (KILO TONS) 85
    102. U.S. GAS AND LIQUID ARGON
    103. MARKET, BY MIXTURE, 2020-2027 (USD MILLION) 85
    104. U.S. GAS AND
    105. LIQUID ARGON MARKET, BY MIXTURE, 2020-2027 (KILO TONS) 86
    106. U.S.
    107. GAS AND LIQUID ARGON MARKET, BY FUNCTION, 2020-2027 (USD MILLION) 86
      1. TABLE
    108. U.S. GAS AND LIQUID ARGON MARKET, BY FUNCTION, 2020-2027 (KILO TONS) 87
    109. U.S. GAS AND LIQUID ARGON MARKET, BY END-USE INDUSTRY, 2020-2027 (USD
      1. MILLION) 87
    110. U.S. GAS AND LIQUID ARGON MARKET, BY END-USE INDUSTRY,
    111. CANADA GAS AND LIQUID ARGON MARKET,
      1. BY TYPE, 2020-2027 (USD MILLION) 88
    112. CANADA GAS AND LIQUID ARGON
    113. MARKET, BY TYPE, 2020-2027 (KILO TONS) 89
    114. CANADA GAS AND LIQUID
    115. ARGON MARKET, BY MIXTURE, 2020-2027 (USD MILLION) 89
    116. CANADA
    117. GAS AND LIQUID ARGON MARKET, BY MIXTURE, 2020-2027 (KILO TONS) 89
      1. TABLE
    118. CANADA GAS AND LIQUID ARGON MARKET, BY FUNCTION, 2020-2027 (USD MILLION) 90
    119. CANADA GAS AND LIQUID ARGON MARKET, BY FUNCTION, 2020-2027 (KILO
      1. TONS) 90
    120. CANADA GAS AND LIQUID ARGON MARKET, BY END-USE INDUSTRY,
    121. CANADA GAS AND LIQUID ARGON MARKET,
      1. BY END-USE INDUSTRY, 2020-2027 (KILO TONS) 91
    122. EUROPE GAS AND
    123. LIQUID ARGON MARKET, BY COUNTRY, 2020-2027 (USD MILLION) 92
      1. TABLE 82
    124. EUROPE GAS AND LIQUID ARGON MARKET, BY COUNTRY, 2020-2027 (KILO TONS) 92
    125. EUROPE GAS AND LIQUID ARGON MARKET, BY TYPE, 2020-2027 (USD MILLION)
      1. 93
    126. EUROPE GAS AND LIQUID ARGON MARKET, BY TYPE, 2020-2027 (KILO
      1. TONS) 93
    127. EUROPE GAS AND LIQUID ARGON MARKET, BY MIXTURE, 2020-2027
      1. (USD MILLION) 93
    128. EUROPE GAS AND LIQUID ARGON MARKET, BY MIXTURE,
    129. EUROPE GAS AND LIQUID ARGON MARKET,
      1. BY FUNCTION, 2020-2027 (USD MILLION) 94
    130. EUROPE GAS AND LIQUID
    131. ARGON MARKET, BY FUNCTION, 2020-2027 (KILO TONS) 94
    132. EUROPE GAS
    133. AND LIQUID ARGON MARKET, BY END-USE INDUSTRY, 2020-2027 (USD MILLION) 95
    134. EUROPE GAS AND LIQUID ARGON MARKET, BY END-USE INDUSTRY, 2020-2027 (KILO
      1. TONS) 95
    135. GERMANY GAS AND LIQUID ARGON MARKET, BY TYPE, 2020-2027
      1. (USD MILLION) 96
    136. GERMANY GAS AND LIQUID ARGON MARKET, BY TYPE,
    137. GERMANY GAS AND LIQUID ARGON MARKET,
      1. BY MIXTURE, 2020-2027 (USD MILLION) 97
    138. GERMANY GAS AND LIQUID
    139. ARGON MARKET, BY MIXTURE, 2020-2027 (KILO TONS) 97
    140. GERMANY GAS
    141. AND LIQUID ARGON MARKET, BY FUNCTION, 2020-2027 (USD MILLION) 98
      1. TABLE
    142. GERMANY GAS AND LIQUID ARGON MARKET, BY FUNCTION, 2020-2027 (KILO TONS) 98
    143. GERMANY GAS AND LIQUID ARGON MARKET, BY END-USE INDUSTRY, 2020-2027
      1. (USD MILLION) 99
    144. GERMANY GAS AND LIQUID ARGON MARKET, BY END-USE
      1. INDUSTRY, 2020-2027 (KILO TONS) 99
    145. UK GAS AND LIQUID ARGON MARKET,
      1. BY TYPE, 2020-2027 (USD MILLION) 100
    146. UK GAS AND LIQUID ARGON
    147. MARKET, BY TYPE, 2020-2027 (KILO TONS) 100
    148. UK GAS AND LIQUID
    149. ARGON MARKET, BY MIXTURE, 2020-2027 (USD MILLION) 100
    150. UK GAS
    151. AND LIQUID ARGON MARKET, BY MIXTURE, 2020-2027 (KILO TONS) 101
      1. TABLE
    152. UK GAS AND LIQUID ARGON MARKET, BY FUNCTION, 2020-2027 (USD MILLION) 101
    153. UK GAS AND LIQUID ARGON MARKET, BY FUNCTION, 2020-2027 (KILO TONS)
      1. 102
    154. UK GAS AND LIQUID ARGON MARKET, BY END-USE INDUSTRY, 2020-2027
      1. (USD MILLION) 102
    155. UK GAS AND LIQUID ARGON MARKET, BY END-USE
      1. INDUSTRY, 2020-2027 (KILO TONS) 103
    156. FRANCE GAS AND LIQUID ARGON
    157. MARKET, BY TYPE, 2020-2027 (USD MILLION) 103
    158. FRANCE GAS AND
    159. LIQUID ARGON MARKET, BY TYPE, 2020-2027 (KILO TONS) 104
    160. FRANCE
    161. GAS AND LIQUID ARGON MARKET, BY MIXTURE, 2020-2027 (USD MILLION) 104
      1. TABLE
    162. FRANCE GAS AND LIQUID ARGON MARKET, BY MIXTURE, 2020-2027 (KILO TONS) 104
    163. FRANCE GAS AND LIQUID ARGON MARKET, BY FUNCTION, 2020-2027 (USD
      1. MILLION) 105
    164. FRANCE GAS AND LIQUID ARGON MARKET, BY FUNCTION,
    165. FRANCE GAS AND LIQUID ARGON MARKET,
      1. BY END-USE INDUSTRY, 2020-2027 (USD MILLION) 106
    166. FRANCE GAS
    167. AND LIQUID ARGON MARKET, BY END-USE INDUSTRY, 2020-2027 (KILO TONS) 106
    168. RUSSIA GAS AND LIQUID ARGON MARKET, BY TYPE, 2020-2027 (USD MILLION)
      1. 107
    169. RUSSIA GAS AND LIQUID ARGON MARKET, BY TYPE, 2020-2027
      1. (KILO TONS) 107
    170. RUSSIA GAS AND LIQUID ARGON MARKET, BY MIXTURE,
    171. RUSSIA GAS AND LIQUID ARGON MARKET,
      1. BY MIXTURE, 2020-2027 (KILO TONS) 108
    172. RUSSIA GAS AND LIQUID
    173. ARGON MARKET, BY FUNCTION, 2020-2027 (USD MILLION) 108
    174. RUSSIA
    175. GAS AND LIQUID ARGON MARKET, BY FUNCTION, 2020-2027 (KILO TONS) 109
      1. TABLE
    176. RUSSIA GAS AND LIQUID ARGON MARKET, BY END-USE INDUSTRY, 2020-2027 (USD MILLION)
      1. 109
    177. RUSSIA GAS AND LIQUID ARGON MARKET, BY END-USE INDUSTRY,
    178. SPAIN GAS AND LIQUID ARGON MARKET,
      1. BY TYPE, 2020-2027 (USD MILLION) 110
    179. SPAIN GAS AND LIQUID ARGON
    180. MARKET, BY TYPE, 2020-2027 (KILO TONS) 111
    181. SPAIN GAS AND LIQUID
    182. ARGON MARKET, BY MIXTURE, 2020-2027 (USD MILLION) 111
    183. SPAIN
    184. GAS AND LIQUID ARGON MARKET, BY MIXTURE, 2020-2027 (KILO TONS) 111
      1. TABLE
    185. SPAIN GAS AND LIQUID ARGON MARKET, BY FUNCTION, 2020-2027 (USD MILLION) 112
    186. SPAIN GAS AND LIQUID ARGON MARKET, BY FUNCTION, 2020-2027 (KILO
      1. TONS) 112
    187. SPAIN GAS AND LIQUID ARGON MARKET, BY END-USE INDUSTRY,
    188. SPAIN GAS AND LIQUID ARGON MARKET,
      1. BY END-USE INDUSTRY, 2020-2027 (KILO TONS) 113
    189. ITALY GAS AND
    190. LIQUID ARGON MARKET, BY TYPE, 2020-2027 (USD MILLION) 114
    191. ITALY
    192. GAS AND LIQUID ARGON MARKET, BY TYPE, 2020-2027 (KILO TONS) 114
      1. TABLE
    193. ITALY GAS AND LIQUID ARGON MARKET, BY MIXTURE, 2020-2027 (USD MILLION) 114
    194. ITALY GAS AND LIQUID ARGON MARKET, BY MIXTURE, 2020-2027 (KILO
      1. TONS) 115
    195. ITALY GAS AND LIQUID ARGON MARKET, BY FUNCTION, 2020-2027
      1. (USD MILLION) 115
    196. ITALY GAS AND LIQUID ARGON MARKET, BY FUNCTION,
    197. ITALY GAS AND LIQUID ARGON MARKET,
      1. BY END-USE INDUSTRY, 2020-2027 (USD MILLION) 116
    198. ITALY GAS
    199. AND LIQUID ARGON MARKET, BY END-USE INDUSTRY, 2020-2027 (KILO TONS) 117
    200. POLAND GAS AND LIQUID ARGON MARKET, BY TYPE, 2020-2027 (USD MILLION)
      1. 118
    201. POLAND GAS AND LIQUID ARGON MARKET, BY TYPE, 2020-2027
      1. (KILO TONS) 118
    202. POLAND GAS AND LIQUID ARGON MARKET, BY MIXTURE,
    203. POLAND GAS AND LIQUID ARGON MARKET,
      1. BY MIXTURE, 2020-2027 (KILO TONS) 119
    204. POLAND GAS AND LIQUID
    205. ARGON MARKET, BY FUNCTION, 2020-2027 (USD MILLION) 119
    206. POLAND
    207. GAS AND LIQUID ARGON MARKET, BY FUNCTION, 2020-2027 (KILO TONS) 120
      1. TABLE
    208. POLAND GAS AND LIQUID ARGON MARKET, BY END-USE INDUSTRY, 2020-2027 (USD MILLION)
      1. 120
    209. POLAND GAS AND LIQUID ARGON MARKET, BY END-USE INDUSTRY,
    210. REST OF EUROPE GAS AND LIQUID ARGON
    211. MARKET, BY TYPE, 2020-2027 (USD MILLION) 121
    212. REST OF EUROPE
    213. GAS AND LIQUID ARGON MARKET, BY TYPE, 2020-2027 (KILO TONS) 122
      1. TABLE
    214. REST OF EUROPE GAS AND LIQUID ARGON MARKET, BY MIXTURE, 2020-2027 (USD MILLION)
      1. 122
    215. REST OF EUROPE GAS AND LIQUID ARGON MARKET, BY MIXTURE,
    216. REST OF EUROPE GAS AND LIQUID ARGON
    217. MARKET, BY FUNCTION, 2020-2027 (USD MILLION) 123
    218. REST OF EUROPE
    219. GAS AND LIQUID ARGON MARKET, BY FUNCTION, 2020-2027 (KILO TONS) 123
      1. TABLE
    220. REST OF EUROPE GAS AND LIQUID ARGON MARKET, BY END-USE INDUSTRY, 2020-2027 (USD
      1. MILLION) 124
    221. REST OF EUROPE GAS AND LIQUID ARGON MARKET, BY
      1. END-USE INDUSTRY, 2020-2027 (KILO TONS) 124
    222. ASIA PACIFIC GAS
    223. AND LIQUID ARGON MARKET, BY COUNTRY, 2020-2027 (USD MILLION) 125
      1. TABLE
    224. ASIA PACIFIC GAS AND LIQUID ARGON MARKET, BY COUNTRY, 2020-2027 (KILO TONS)
      1. 125
    225. ASIA PACIFIC GAS AND LIQUID ARGON MARKET, BY TYPE, 2020-2027
      1. (USD MILLION) 126
    226. ASIA PACIFIC GAS AND LIQUID ARGON MARKET,
      1. BY TYPE, 2020-2027 (KILO TONS) 126
    227. ASIA PACIFIC GAS AND LIQUID
    228. ARGON MARKET, BY MIXTURE, 2020-2027 (USD MILLION) 126
    229. ASIA
    230. PACIFIC GAS AND LIQUID ARGON MARKET, BY MIXTURE, 2020-2027 (KILO TONS) 127
    231. ASIA PACIFIC GAS AND LIQUID ARGON MARKET, BY FUNCTION, 2020-2027 (USD
      1. MILLION) 127
    232. ASIA PACIFIC GAS AND LIQUID ARGON MARKET, BY FUNCTION,
    233. ASIA PACIFIC GAS AND LIQUID ARGON
    234. MARKET, BY END-USE INDUSTRY, 2020-2027 (USD MILLION) 128
    235. ASIA
    236. PACIFIC GAS AND LIQUID ARGON MARKET, BY END-USE INDUSTRY, 2020-2027 (KILO TONS)
      1. 129
    237. CHINA GAS AND LIQUID ARGON MARKET, BY TYPE, 2020-2027 (USD
      1. MILLION) 129
    238. CHINA GAS AND LIQUID ARGON MARKET, BY TYPE, 2020-2027
      1. (KILO TONS) 130
    239. CHINA GAS AND LIQUID ARGON MARKET, BY MIXTURE,
    240. CHINA GAS AND LIQUID ARGON MARKET,
      1. BY MIXTURE, 2020-2027 (KILO TONS) 130
    241. CHINA GAS AND LIQUID
    242. ARGON MARKET, BY FUNCTION, 2020-2027 (USD MILLION) 131
    243. CHINA
    244. GAS AND LIQUID ARGON MARKET, BY FUNCTION, 2020-2027 (KILO TONS) 131
      1. TABLE
    245. CHINA GAS AND LIQUID ARGON MARKET, BY END-USE INDUSTRY, 2020-2027 (USD MILLION)
      1. 132
    246. CHINA GAS AND LIQUID ARGON MARKET, BY END-USE INDUSTRY,
    247. JAPAN GAS AND LIQUID ARGON MARKET,
      1. BY TYPE, 2020-2027 (USD MILLION) 133
    248. JAPAN GAS AND LIQUID ARGON
    249. MARKET, BY TYPE, 2020-2027 (KILO TONS) 133
    250. JAPAN GAS AND LIQUID
    251. ARGON MARKET, BY MIXTURE, 2020-2027 (USD MILLION) 133
    252. JAPAN
    253. GAS AND LIQUID ARGON MARKET, BY MIXTURE, 2020-2027 (KILO TONS) 134
      1. TABLE
    254. JAPAN GAS AND LIQUID ARGON MARKET, BY FUNCTION, 2020-2027 (USD MILLION) 134
    255. JAPAN GAS AND LIQUID ARGON MARKET, BY FUNCTION, 2020-2027 (KILO
      1. TONS) 135
    256. JAPAN GAS AND LIQUID ARGON MARKET, BY END-USE INDUSTRY,
    257. JAPAN GAS AND LIQUID ARGON MARKET,
      1. BY END-USE INDUSTRY, 2020-2027 (KILO TONS) 136
    258. INDIA GAS AND
    259. LIQUID ARGON MARKET, BY TYPE, 2020-2027 (USD MILLION) 136
    260. INDIA
    261. GAS AND LIQUID ARGON MARKET, BY TYPE, 2020-2027 (KILO TONS) 137
      1. TABLE
    262. INDIA GAS AND LIQUID ARGON MARKET, BY MIXTURE, 2020-2027 (USD MILLION) 137
    263. INDIA GAS AND LIQUID ARGON MARKET, BY MIXTURE, 2020-2027 (KILO
      1. TONS) 137
    264. INDIA GAS AND LIQUID ARGON MARKET, BY FUNCTION, 2020-2027
      1. (USD MILLION) 138
    265. INDIA GAS AND LIQUID ARGON MARKET, BY FUNCTION,
    266. INDIA GAS AND LIQUID ARGON MARKET,
      1. BY END-USE INDUSTRY, 2020-2027 (USD MILLION) 139
    267. INDIA GAS
    268. AND LIQUID ARGON MARKET, BY END-USE INDUSTRY, 2020-2027 (KILO TONS) 139
    269. SOUTH KOREA GAS AND LIQUID ARGON MARKET, BY TYPE, 2020-2027 (USD MILLION)
      1. 140
    270. SOUTH KOREA GAS AND LIQUID ARGON MARKET, BY TYPE, 2020-2027
      1. (KILO TONS) 140
    271. SOUTH KOREA GAS AND LIQUID ARGON MARKET, BY
      1. MIXTURE, 2020-2027 (USD MILLION) 140
    272. SOUTH KOREA GAS AND LIQUID
    273. ARGON MARKET, BY MIXTURE, 2020-2027 (KILO TONS) 141
    274. SOUTH KOREA
    275. GAS AND LIQUID ARGON MARKET, BY FUNCTION, 2020-2027 (USD MILLION) 141
      1. TABLE
    276. SOUTH KOREA GAS AND LIQUID ARGON MARKET, BY FUNCTION, 2020-2027 (KILO TONS)
      1. 142
    277. SOUTH KOREA GAS AND LIQUID ARGON MARKET, BY END-USE INDUSTRY,
    278. SOUTH KOREA GAS AND LIQUID ARGON
    279. MARKET, BY END-USE INDUSTRY, 2020-2027 (KILO TONS) 143
    280. AUSTRALIA
    281. AND NEW ZEALAND GAS AND LIQUID ARGON MARKET, BY TYPE, 2020-2027 (USD MILLION) 143
    282. AUSTRALIA AND NEW ZEALAND GAS AND LIQUID ARGON MARKET, BY TYPE,
    283. AUSTRALIA AND NEW ZEALAND GAS AND
    284. LIQUID ARGON MARKET, BY MIXTURE, 2020-2027 (USD MILLION) 144
      1. TABLE 200
    285. AUSTRALIA AND NEW ZEALAND GAS AND LIQUID ARGON MARKET, BY MIXTURE, 2020-2027 (KILO
      1. TONS) 144
    286. AUSTRALIA AND NEW ZEALAND GAS AND LIQUID ARGON MARKET,
      1. BY FUNCTION, 2020-2027 (USD MILLION) 145
    287. AUSTRALIA AND NEW
    288. ZEALAND GAS AND LIQUID ARGON MARKET, BY FUNCTION, 2020-2027 (KILO TONS) 145
    289. AUSTRALIA AND NEW ZEALAND GAS AND LIQUID ARGON MARKET, BY END-USE INDUSTRY,
    290. AUSTRALIA AND NEW ZEALAND GAS AND
    291. LIQUID ARGON MARKET, BY END-USE INDUSTRY, 2020-2027 (KILO TONS) 146
      1. TABLE
    292. THAILAND GAS AND LIQUID ARGON MARKET, BY TYPE, 2020-2027 (USD MILLION) 147
    293. THAILAND GAS AND LIQUID ARGON MARKET, BY TYPE, 2020-2027 (KILO
      1. TONS) 147
    294. THAILAND GAS AND LIQUID ARGON MARKET, BY MIXTURE,
    295. THAILAND GAS AND LIQUID ARGON MARKET,
      1. BY MIXTURE, 2020-2027 (KILO TONS) 148
    296. THAILAND GAS AND LIQUID
    297. ARGON MARKET, BY FUNCTION, 2020-2027 (USD MILLION) 148
    298. THAILAND
    299. GAS AND LIQUID ARGON MARKET, BY FUNCTION, 2020-2027 (KILO TONS) 149
      1. TABLE
    300. THAILAND GAS AND LIQUID ARGON MARKET, BY END-USE INDUSTRY, 2020-2027 (USD MILLION)
      1. 149
    301. THAILAND GAS AND LIQUID ARGON MARKET, BY END-USE INDUSTRY,
    302. MALAYSIA GAS AND LIQUID ARGON MARKET,
      1. BY TYPE, 2020-2027 (USD MILLION) 150
    303. MALAYSIA GAS AND LIQUID
    304. ARGON MARKET, BY TYPE, 2020-2027 (KILO TONS) 151
    305. MALAYSIA GAS
    306. AND LIQUID ARGON MARKET, BY MIXTURE, 2020-2027 (USD MILLION) 151
      1. TABLE
    307. MALAYSIA GAS AND LIQUID ARGON MARKET, BY MIXTURE, 2020-2027 (KILO TONS) 151
    308. MALAYSIA GAS AND LIQUID ARGON MARKET, BY FUNCTION, 2020-2027 (USD
      1. MILLION) 152
    309. MALAYSIA GAS AND LIQUID ARGON MARKET, BY FUNCTION,
    310. MALAYSIA GAS AND LIQUID ARGON MARKET,
      1. BY END-USE INDUSTRY, 2020-2027 (USD MILLION) 153
    311. MALAYSIA GAS
    312. AND LIQUID ARGON MARKET, BY END-USE INDUSTRY, 2020-2027 (KILO TONS) 153
    313. INDONESIA GAS AND LIQUID ARGON MARKET, BY TYPE, 2020-2027 (USD MILLION)
      1. 154
    314. INDONESIA GAS AND LIQUID ARGON MARKET, BY TYPE, 2020-2027
      1. (KILO TONS) 154
    315. INDONESIA GAS AND LIQUID ARGON MARKET, BY MIXTURE,
    316. INDONESIA GAS AND LIQUID ARGON
    317. MARKET, BY MIXTURE, 2020-2027 (KILO TONS) 155
    318. INDONESIA GAS
    319. AND LIQUID ARGON MARKET, BY FUNCTION, 2020-2027 (USD MILLION) 155
      1. TABLE
    320. INDONESIA GAS AND LIQUID ARGON MARKET, BY FUNCTION, 2020-2027 (KILO TONS) 156
    321. INDONESIA GAS AND LIQUID ARGON MARKET, BY END-USE INDUSTRY, 2020-2027
      1. (USD MILLION) 156
    322. INDONESIA GAS AND LIQUID ARGON MARKET, BY
      1. END-USE INDUSTRY, 2020-2027 (KILO TONS) 157
    323. REST OF ASIA PACIFIC
    324. GAS AND LIQUID ARGON MARKET, BY TYPE, 2020-2027 (USD MILLION) 157
      1. TABLE
    325. REST OF ASIA PACIFIC GAS AND LIQUID ARGON MARKET, BY TYPE, 2020-2027 (KILO TONS)
      1. 158
    326. REST OF ASIA PACIFIC GAS AND LIQUID ARGON MARKET, BY MIXTURE,
    327. REST OF ASIA PACIFIC GAS AND LIQUID
    328. ARGON MARKET, BY MIXTURE, 2020-2027 (KILO TONS) 158
    329. REST OF
    330. ASIA PACIFIC GAS AND LIQUID ARGON MARKET, BY FUNCTION, 2020-2027 (USD MILLION) 159
    331. REST OF ASIA PACIFIC GAS AND LIQUID ARGON MARKET, BY FUNCTION,
    332. REST OF ASIA PACIFIC GAS AND LIQUID
    333. ARGON MARKET, BY END-USE INDUSTRY, 2020-2027 (USD MILLION) 160
      1. TABLE
    334. REST OF ASIA PACIFIC GAS AND LIQUID ARGON MARKET, BY END-USE INDUSTRY, 2020-2027
      1. (KILO TONS) 160
    335. THE MIDDLE EAST AND AFRICA GAS AND LIQUID ARGON
    336. MARKET, BY COUNTRY, 2020-2027 (USD MILLION) 161
    337. THE MIDDLE
    338. EAST AND AFRICA GAS AND LIQUID ARGON MARKET, BY COUNTRY, 2020-2027 (KILO TONS) 161
    339. THE MIDDLE EAST AND AFRICA GAS AND LIQUID ARGON MARKET, BY TYPE,
    340. THE MIDDLE EAST AND AFRICA GAS
    341. AND LIQUID ARGON MARKET, BY TYPE, 2020-2027 (KILO TONS) 162
      1. TABLE 241
    342. THE MIDDLE EAST AND AFRICA GAS AND LIQUID ARGON MARKET, BY MIXTURE, 2020-2027 (USD
      1. MILLION) 162
    343. THE MIDDLE EAST AND AFRICA GAS AND LIQUID ARGON
    344. MARKET, BY MIXTURE, 2020-2027 (KILO TONS) 163
    345. THE MIDDLE EAST
    346. AND AFRICA GAS AND LIQUID ARGON MARKET, BY FUNCTION, 2020-2027 (USD MILLION) 163
    347. THE MIDDLE EAST AND AFRICA GAS AND LIQUID ARGON MARKET, BY FUNCTION,
    348. THE MIDDLE EAST AND AFRICA GAS AND
    349. LIQUID ARGON MARKET, BY END-USE INDUSTRY, 2020-2027 (USD MILLION) 164
      1. TABLE
    350. THE MIDDLE EAST AND AFRICA GAS AND LIQUID ARGON MARKET, BY END-USE INDUSTRY,
    351. TURKEY GAS AND LIQUID ARGON MARKET,
      1. BY TYPE, 2020-2027 (USD MILLION) 165
    352. TURKEY GAS AND LIQUID
    353. ARGON MARKET, BY TYPE, 2020-2027 (KILO TONS) 165
    354. TURKEY GAS
    355. AND LIQUID ARGON MARKET, BY MIXTURE, 2020-2027 (USD MILLION) 166
      1. TABLE
    356. TURKEY GAS AND LIQUID ARGON MARKET, BY MIXTURE, 2020-2027 (KILO TONS) 166
    357. TURKEY GAS AND LIQUID ARGON MARKET, BY FUNCTION, 2020-2027 (USD
      1. MILLION) 167
    358. TURKEY GAS AND LIQUID ARGON MARKET, BY FUNCTION,
    359. TURKEY GAS AND LIQUID ARGON MARKET,
      1. BY END-USE INDUSTRY, 2020-2027 (USD MILLION) 168
    360. TURKEY GAS
    361. AND LIQUID ARGON MARKET, BY END-USE INDUSTRY, 2020-2027 (KILO TONS) 168
    362. ISRAEL GAS AND LIQUID ARGON MARKET, BY TYPE, 2020-2027 (USD MILLION)
      1. 169
    363. ISRAEL GAS AND LIQUID ARGON MARKET, BY TYPE, 2020-2027
      1. (KILO TONS) 169
    364. ISRAEL GAS AND LIQUID ARGON MARKET, BY MIXTURE,
    365. ISRAEL GAS AND LIQUID ARGON MARKET,
      1. BY MIXTURE, 2020-2027 (KILO TONS) 170
    366. ISRAEL GAS AND LIQUID
    367. ARGON MARKET, BY FUNCTION, 2020-2027 (USD MILLION) 170
    368. ISRAEL
      1. GAS A

    Gas and Liquid Argon Market Segmentation

    Market Segmentation Overview

    • Detailed segmentation data will be available in the full report
    • Comprehensive analysis by multiple parameters
    • Regional and country-level breakdowns
    • Market size forecasts by segment
    Infographic

    Free Sample Request

    Kindly complete the form below to receive a free sample of this Report

    Get Free Sample

    Customer Strories

    “I am very pleased with how market segments have been defined in a relevant way for my purposes (such as "Portable Freezers & refrigerators" and "last-mile"). In general the report is well structured. Thanks very much for your efforts.”

    Victoria Milne

    Founder
    Case Study
    Chemicals and Materials