ID: MRFR/IA - E/1465-CR | February 2020 | Region: Global | 143 Pages
1 Introduction
1.1 Definition 14
1.2 Scope Of The Study 14
1.3 Assumptions 14
1.4 Market Structure 14
2 Research Methodology
2.1 Research Process 16
2.2 Primary Research 17
2.3 Secondary Research 17
2.4 Market Size Estimation 17
2.5 Forecast Model 19
3 Market Dynamics
3.1 Drivers 21
3.1.1 Advancement In Terms Of Product Innovation & Technologies 21
3.1.2 Growth In The Demand For Industrial & Specialty Gases 21
3.2 Restraints 22
3.2.1 High Operational And Technological Cost 22
3.2.2 Availability Of Skilled Labor 22
3.3 Opportunities 22
3.3.1 Growth For Industrial Gases Used 22
4 Market Factor Analysis
4.1 Porter's 5 Forces Analysis 23
4.1.1 Threat On New Entrants 23
4.1.2 Bargaining Power Of Suppliers 24
4.1.3 Bargaining Power Of Buyers 24
4.1.4 Threat Of Substitutes 24
4.1.5 Threat Of Rivals 24
4.2 Value Chain Analysis 24
4.2.1 Raw Material Supply 25
4.2.2 Manufacturing 25
4.2.3 Distribution 25
4.2.4 End Use 25
4.2.5 After-Sales Services 25
5 Air Separation Plant Market, By Type
5.1 Introduction 27
5.2 Under 20,000 M3/H 27
5.3 20,000-40,000 M3/H 27
5.4 40,000-80,000 M3/H 27
5.5 More Than 80,000 M3/H 27
6 Air Separation Plant Market, By Process
6.1 Introduction 30
6.2 Cryogenic Distillation Process 30
6.3 Non-Cryogenic Distillation Process 30
7 Air Separation Plant Market, By Gas
7.1 Introduction 33
7.2 Nitrogen 33
7.3 Oxygen 33
7.4 Argon 33
7.5 Carbon Dioxide 33
8 Air Separation Plant Market, By Application
8.1 Introduction 36
8.2 Chemical 36
8.3 Oil & Gas 36
8.4 Paper 36
8.5 Metallurgy 36
9 Air Separation Plant Market, By Region
9.1 Introduction 39
9.2 North America 40
9.2.1 US …………………………………………………………………………………………………45
9.2.2 Canada 49
9.3 Europe 53
9.3.1 Germany 58
9.3.2 France 62
9.3.3 Italy 66
9.3.4 Spain 70
9.3.5 U.K. 74
9.3.6 Rest Of The Europe 78
9.4 Asia-Pacific (APAC) 82
9.4.1 China 87
9.4.2 India 91
9.4.3 Japan 95
9.4.4 Rest Of APAC 99
9.5 Rest Of The World 103
9.5.1 Middle East & Africa 108
10 Competitive Scenario
10.1 Competitive Landscape 116
10.2 Praxair-Linde Merger Analysis 117
10.2.1 Analysis 118
11 Company Profiles
11.1 Linde AG 120
11.1.1 Company Overview 120
11.1.2 Financials 120
11.1.3 Product/Service Segment Overview 121
11.1.4 Strategy 121
11.1.5 SWOT Analysis 122
11.2 Air Liquide SA 123
11.2.1 Financials 123
11.2.2 Product/Service Segment Overview 124
11.2.3 Strategy 124
11.2.4 SWOT Analysis 125
11.3 Praxair, Inc. 126
11.3.1 Financials 126
11.3.2 Product/Service Segment Overview 127
11.3.3 Strategy 127
11.3.4 SWOT Analysis 128
11.4 Taiyo Nippon Sanso Corporation 129
11.4.1 Financials 129
11.4.2 Product/Service Segment Overview 130
11.4.3 Strategy 130
11.4.4 SWOT Analysis 131
11.5 Air Products And Chemicals, Inc. 132
11.5.1 Financials 132
11.5.2 Product/Service Segment Overview 133
11.5.3 Strategy 133
11.5.4 SWOT Analysis 134
11.6 Messer Group GmbH 135
11.6.1 Company Overview 135
11.6.2 Financials 135
11.6.3 Product/Service Segment Overview 136
11.6.4 Strategy 136
11.7 Enerflex Ltd. 138
11.7.1 Financials 138
11.7.2 Product/Service Segment Overview 138
11.7.3 Strategy 139
11.8 Gas Engineering LLC 140
11.8.1 Company Overview 140
11.8.2 Financials 140
11.8.3 Product/Service Segment Overview 140
11.8.4 Strategy 140
11.9 Universal Industrial Gases, Inc. 141
11.9.1 Financials 141
11.9.2 Product/Service Segment Overview 141
11.10 Technex Limited 142
11.10.1 Financials 142
11.10.2 Product/Service Segment Overview 142
12 List Of Tables
TABLE 1 GLOBAL AIR SEPARATION PLANT MARKET, BY TYPE, 2020–2027 (USD MILLION) 28
TABLE 2 GLOBAL AIR SEPARATION PLANT MARKET, BY PROCESS, 2020-2027 (USD MILLION) 31
TABLE 3 GLOBAL AIR SEPARATION PLANT MARKET, BY GAS, 2020-2027 (USD MILLION) 34
TABLE 4 GLOBAL AIR SEPARATION PLANT MARKET, BY APPLICATION, 2020-2027 (USD MILLION) 37
TABLE 5 GLOBAL AIR SEPARATION PLANT MARKET, BY REGION, 2020-2027 (USD MILLION) 39
TABLE 6 NORTH AMERICA: AIR SEPARATION PLANT MARKET, BY COUNTRY, 2020–2027 (USD MILLION) 40
TABLE 7 NORTH AMERICA: AIR SEPARATION PLANT MARKET, BY TYPE, 2020–2027 (USD MILLION) 41
TABLE 8 NORTH MAERICA: AIR SEPERATION PLANT MARKET, BY PROCESS, 2020–2027 (USD MILLION) 42
TABLE 9 NORTH MAERICA: AIR SEPERATION PLANT MARKET, BY GAS, 2020–2027 (USD MILLION) 43
TABLE 10 NORTH MAERICA: AIR SEPERATION PLANT MARKET, BY APPLICATION, 2020–2027 (USD MILLION) 44
TABLE 11 U.S.: AIR SEPERATION PLANT MARKET, BY TYPE, 2020–2027 (USD MILLION) 45
TABLE 12 U.S.: AIR SEPERATION PLANT MARKET, BY PROCESS, 2020–2027 (USD MILLION) 46
TABLE 13 U.S.: AIR SEPARATION PLANT MARKET, BY GAS, 2020–2027 (USD MILLION) 47
TABLE 14 U.S. AIR SEPARATION PLANT MARKET, BY APPLICATION, 2020–2027 (USD MILLION) 48
TABLE 15 CANADA:AIR SEPERATION PLANT MARKET, BY TYPE, 2020–2027 (USD MILLION) 49
TABLE 16 CANADA:AIR SEPARATION PLANT MARKET, BY PROCESS, 2020–2027 (USD MILLION) 50
TABLE 17 CANADA:AIR SEPARATION PLANT MARKET, BY GAS, 2020–2027 (USD MILLION) 51
TABLE 18 CANADA: AIR SEPARATION PLANT MARKET, BY APPLICATION, 2020–2027 (USD MILLION) 52
TABLE 19 EUROPE:AIR SEPARATION PLANT MARKET, BY COUNTRY, 2020–2027 (USD MILLION) 53
TABLE 20 EUROPE:AIR SEPARATION PLANT MARKET, BY TYPE, 2020–2027 (USD MILLION) 54
TABLE 21 EUROPE:AIR SEPARATION PLANT MARKET, BY PROCESS, 2020–2027 (USD MILLION) 55
TABLE 22 EUROPE:AIR SEPARATION PLANT MARKET, BY GAS, 2020–2027 (USD MILLION) 56
TABLE 23 EUROPE:AIR SEPARATION PLANT MARKET, BY APPLICATION, 2020–2027 (USD MILLION) 57
TABLE 24 GERMANY:AIR SEPARATION PLANT MARKET, BY TYPE, 2020–2027 (USD MILLION) 58
TABLE 25 GERMANY:AIR SEPARATION PLANT MARKET, BY PROCESS, 2020–2027 (USD MILLION) 59
TABLE 26 GERMANY:AIR SEPARATION PLANT MARKET, BY GAS, 2020–2027 (USD MILLION) 60
TABLE 27 GERMANY:AIR SEPARATION PLANT MARKET, BY APPLICATION, 2020–2027 (USD MILLION) 61
TABLE 28 FRANCE: AIR SEPARATION PLANT MARKET, BY TYPE, 2020–2027 (USD MILLION) 62
TABLE 29 FRANCE:AIR SEPARATION PLANT MARKET, BY PROCESS, 2020–2027 (USD MILLION) 63
TABLE 30 FRANCE:AIR SEPARATION PLANT MARKET, BY GAS, 2020–2027 (USD MILLION) 64
TABLE 31 FRANCE:AIR SEPARATION PLANT MARKET, BY APPLICATION, 2020–2027 (USD MILLION) 65
TABLE 32 ITALY:AIR SEPARATION PLANT MARKET, BY TYPE, 2020–2027 (USD MILLION) 66
TABLE 33 ITALY :AIR SEPARATION PLANT MARKET, BY PROCESS, 2020–2027 (USD MILLION) 67
TABLE 34 ITALY:AIR SEPARATION PLANT MARKET, BY GAS, 2020–2027 (USD MILLION) 68
TABLE 35 ITALY:AIR SEPARATION PLANT MARKET, BY APPLICATION, 2020–2027 (USD MILLION) 69
TABLE 36 SPAIN:AIR SEPAARTION PLANT MARKET, BY TYPE, 2020–2027 (USD MILLION) 70
TABLE 37 SPAIN: AIR SEPARATION PLANT MARKET, BY PROCESS, 2020–2027 (USD MILLION) 71
TABLE 38 SPAIN: AIR SEPARATION PLANT MARKET, BY GAS, 2020–2027 (USD MILLION) 72
TABLE 39 SPAIN: AIR SEPARATION PLANT MARKET, BY APPLICATION, 2020–2027 (USD MILLION) 73
TABLE 40 U.K: AIR SEPARATION PLANT MARKET, BY TYPE, 2020–2027 (USD MILLION) 74
TABLE 41 U.K: AIR SEPARATION PLANT MARKET, BY PROCESS, 2020–2027 (USD MILLION) 75
TABLE 42 U.K: AIR SEPARATION PLANT MARKET, BY GAS, 2020–2027 (USD MILLION) 76
TABLE 43 U.K: AIR SEPARATION PLANT MARKET, BY APPLICATION, 2020–2027 (USD MILLION) 77
TABLE 44 REST OF EUROPE:AIR SEPARATION PLANT MARKET, BY TYPE, 2020-2027 (USD MILLION) 78
TABLE 45 REST OF EUROPE: AIR SEPARATION PLANT MARKET, BY PROCESS, 2020-2027 (USD MILLION) 79
TABLE 46 REST OF EUROPE: AIR SEPARATION PLANT MARKET, BY GAS, 2020-2027 (USD MILLION) 80
TABLE 47 REST OF EUROPE: AIR SEPARATION PLANT MARKET, BY APPLICATION, 2020-2027 (USD MILLION) 81
TABLE 48 ASIA-PACIFIC: AIR SEPARATION PLANT MARKET, BY REGION, 2020–2027 (USD MILLION) 82
TABLE 49 ASIA-PACIFIC:AIR SEPARATION PLANT MARKET, BY TYPE, 2020–2027 (USD MILLION) 83
TABLE 50 ASIA-PACIFIC: AIR SEPARATION PLANT MARKET, BY PROCESS, 2020–2027 (USD MILLION) 84
TABLE 51 ASIA-PACIFIC: AIR SEPARATION PLANT MARKET, BY GAS, 2020–2027 (USD MILLION) 85
TABLE 52 ASIA PACIFIC: AIR SEPARATION PLANT MARKET, BY APPLICATION, 2020–2027 (USD MILLION) 86
TABLE 53 CHINA: AIR SEPARATION PLANT MARKET, BY TYPE, 2020–2027 (USD MILLION) 87
TABLE 54 CHINA:AIR SEPARATION PLANT MARKET, BY PROCESS, 2020–2027 (USD MILLION) 88
TABLE 55 CHINA:AIR SEPARATION PLANT MARKET, BY GAS, 2020–2027 (USD MILLION) 89
TABLE 56 CHINA:AIR SEPARATION PLANT MARKET, BY APPLICATION, 2020–2027 (USD MILLION) 90
TABLE 57 INDIA: AIR SEPARATION PLANT MARKET, BY TYPE, 2020–2027 (USD MILLION) 91
TABLE 58 INDIA: AIR SEPARATION PLANT MARKET, BY PROCESS, 2020–2027 (USD MILLION) 92
TABLE 59 INDIA:AIR SEPARATION PLANT MARKET, BY GAS, 2020–2027 (USD MILLION) 93
TABLE 60 INDIA:AIR SEPARATION PLANT MARKET, BY APPLICATION, 2020–2027 (USD MILLION) 94
TABLE 61 JAPAN:AIR SEPARATION PLANT MARKET, BY TYPE, 2020–2027 (USD MILLION) 95
TABLE 62 JAPAN:AIR SEPARATION PLANT MARKET, BY PROCESS, 2020–2027 (USD MILLION) 96
TABLE 63 JAPAN:AIR SEPARATION PLANT MARKET, BY GAS, 2020–2027 (USD MILLION) 97
TABLE 64 JAPAN :AIR SEPARATION PLANT MARKET, BY APPLICATION, 2020–2027 (USD MILLION) 98
TABLE 65 REST OF APAC: AIR SEPARATION PLANT MARKET, BY TYPE, 2020–2027 (USD MILLION) 99
TABLE 66 REST OF APAC:AIR SEPARATION PLANT MARKET, BY PROCESS, 2020–2027 (USD MILLION) 100
TABLE 67 REST OF APAC:AIR SEPARATION PLANT MARKET, BY GAS, 2020–2027 (USD MILLION) 101
TABLE 68 REST OF APAC:AIR SEPARATION PLANT MARKET, BY APPLICATION, 2020–2027 (USD MILLION) 102
TABLE 69 REST OF WORLD:AIR SEPARATION PLANT MARKET, BY REGION, 2020–2027 (USD MILLION) 103
TABLE 70 REST OF WORLD:AIR SEPARATION PLANT MARKET, BY TYPE, 2020–2027 (USD MILLION) 104
TABLE 71 REST OF WORLD:AIR SEPARATION PLANT MARKET, BY PROCESS, 2020–2027 (USD MILLION) 105
TABLE 72 REST OF WORLD:AIR SEPARATION PLANT MARKET, BY GAS, 2020–2027 (USD MILLION) 106
TABLE 73 REST OF WORLD:AIR SEPARATION PLANT MARKET, BY APPLICATION, 2020–2027 (USD MILLION) 107
TABLE 74 MIDDLE EAST & AFRICA:AIR SEPARATION PLANT MARKET, BY TYPE, 2020–2027 (USD MILLION) 108
TABLE 75 MIDDLE EAST & AFRICA: AIR SEPARATION PLANT MARKET, BY PROCESS, 2020–2027 (USD MILLION) 109
TABLE 76 MIDDLE EAST & AFRICA:AIR SEPARATION PLANT MARKET, BY GAS, 2020–2027 (USD MILLION) 110
TABLE 77 MIDDLE EAST & AFRICA:AIR SEPARATION PLANT MARKET, BY APPLICATION, 2020–2027 (USD MILLION) 111
TABLE 78 SOUTH AMERICA:AIR SEPARATION PLANT MARKET, BY TYPE, 2020–2027 (USD MILLION) 112
TABLE 79 SOUTH AMERICA:AIR SEPARATION PLANT MARKET, BY PROCESS, 2020–2027 (USD MILLION) 113
TABLE 80 SOUTH AMERICA: AIR SEPARATION PLANT MARKET, BY GAS, 2020–2027 (USD MILLION) 114
TABLE 81 SOUTH AMERICA: AIR SEPARATION PLANT MARKET, BY APPLICATION, 2020–2027 (USD MILLION) 115
13 List Of Figures
FIGURE 1 RESEARCH PROCESS OF MRFR 16
FIGURE 2 TOP DOWN & BOTTOM UP APPROACH 18
FIGURE 3 DRIVERS, RESTRAINTS, AND OPPORTUNITIES OF GLOBAL AIR SEPARATION PLANT MARKET 20
FIGURE 4 PORTER'S 5 FORCES ANALYSIS OF GLOBAL AIR SEPARATION PLANT MARKET 23
FIGURE 5 GLOBAL AIR SEPARATION PLANT MARKET, BY TYPE, 2020-2027 (USD MILLION) 28
FIGURE 6 GLOBAL AIR SEPARATION PLANT MARKET, BY PROCESS, 2020-2027 (USD MILLION) 31
FIGURE 7 GLOBAL AIR SEPARATION PLANT MARKET, BY GAS, 2020-2027 (USD MILLION) 33
FIGURE 8 GLOBAL AIR SEPARATION PLANT MARKET, BY APPLICATION, 2020-2027 (USD MILLION) 37
FIGURE 9 GLOBAL AIR SEPARATION PLANT MARKET, BY REGION, 2020-2027 (USD MILLION) 39
FIGURE 10 NORTH AMERICA: AIR SEPARATION PLANT MARKET, BY COUNTY, 2020-2027 (USD MILLION) 40
FIGURE 11 NORTH AMERICA: AIR SEPARATION PLANT MARKET, BY TYPE, 2020-2027 (USD MILLION) 41
FIGURE 12 NORTH AMERICA: AIR SEPARATION PLANT MARKET, BY PROCESS, 2020-2027 (USD MILLION) 42
FIGURE 13 NORTH AMERICA: AIR SEPARATION PLANT MARKET, BY GAS, 2020-2027 (USD MILLION) 43
FIGURE 14 NORTH AMERICA: AIR SEPARATION PLANT MARKET, BY APPLICATION, 2020-2027 (USD MILLION) 44
FIGURE 15 U.S.: AIR SEPARATION PLANT MARKE, BY TYPE, 2020-2027 (USD MILLION) 45
FIGURE 16 U.S.: AIR SEPARATION PLANT MARKET, BY PROCESS, 2020-2027 (USD MILLION) 45
FIGURE 17 U.S.:AIR SEPARATION PLANT MARKET SIZE, BY GAS, 2020-2027 (USD MILLION) 47
FIGURE 18 U.S.: AIR SEPARATION PLANT MARKET, BY APPLICATION, 2020-2027 (USD MILLION) 48
FIGURE 19 CANADA: AIR SEPARATION PLANT MARKET, BY TYPE, 2020-2027 (USD MILLION) 49
FIGURE 20 CANADA: AIR SEPARATION PLANT MARKET, BY PROCESS, 2020-2027 (USD MILLION) 50
FIGURE 21 CANADA: AIR SEPARATION PLANT MARKET, BY GAS, 2020-2027 (USD MILLION) 51
FIGURE 22 CANADA: AIR SEPARATION PLANT MARKET, BY APPLICATION, 2020-2027 (USD MILLION) 52
FIGURE 23 EUROPE: AIR SEPARATION PLANT MARKET, BY COUNTRY, 2020-2027 (USD MILLION) 53
FIGURE 24 EUROPE: AIR SEPARATION PLANT MARKET, BY TYPE, 2020-2027 (USD MILLION) 54
FIGURE 25 EUROPE: AIR SEPARATION PLANT MARKET, BY PROCESS, 2020-2027 (USD MILLION) 55
FIGURE 26 EUROPE: AIR SEPARATION PLANT MARKET, BY GAS, 2020-2027 (USD MILLION) 56
FIGURE 27 EUROPE: AIR SEPARATION PLANT MARKET, BY APPLICATION, 2020-2027 (USD MILLION) 57
FIGURE 28 GERMANY: AIR SEPARATION PLANT MARKET, BY TYPE, 2020-2027 (USD MILLION) 58
FIGURE 29 GERMANY: AIR SEPARATION PLANT MARKET, BY TYPE, 2020-2027 (USD MILLION) 59
FIGURE 30 GERMANY: AIR SEPARATION PLANT MARKET, BY GAS, 2020-2027 (USD MILLION) 60
FIGURE 31 GERMANY: AIR SEPARATION PLANT MARKET, BY APPLICATION, 2020-2027 (USD MILLION) 61
FIGURE 32 FRANCE: AIR SEPARATION PLANT MARKET, BY TYPE, 2020-2027 (USD MILLION) 62
FIGURE 33 FRANCE: AIR SEPARATION PLANT MARKET, BY PROCESS, 2020-2027 (USD MILLION) 62
FIGURE 34 FRANCE: AIR SEPARATION PLANT MARKET, BY GAS, 2020-2027 (USD MILLION) 64
FIGURE 35 FRANCE: AIR SEPARATION PLANT MARKET, BY APPLICATION, 2020-2027 (USD MILLION) 65
FIGURE 36 ITALY: AIR SEPARATION PLANT MARKET, BY TYPE, 2020-2027 (USD MILLION) 66
FIGURE 37 ITALY: AIR SEPARATION PLANT MARKET, BY PROCESS, 2020-2027 (USD MILLION) 67
FIGURE 38 ITALY AIR SEPARATION PLANT MARKET, BY GAS, 2020-2027 (USD MILLION) 68
FIGURE 39 ITALY:AIR SEPARATION PLANT MARKET, BY APPLICATION, 2020-2027 (USD MILLION) 69
FIGURE 40 SPAIN: AIR SEPARATION PLANT MARKET, BY TYPE, 2020-2027 (USD MILLION) 70
FIGURE 41 SPAIN: AIR SEPARATION PLANT MARKET, BY PROCESS, 2020-2027 (USD MILLION) 71
FIGURE 42 SPAIN: AIR SEPARATION PLANT MARKET, BY GAS, 2020-2027 (USD MILLION) 72
FIGURE 43 SPAIN: AIR SEPARATION PLANT MARKET, BY APPLICATION, 2020-2027 (USD MILLION) 73
FIGURE 44 U.K: AIR SEPARATION PLANT MARKET, BY TYPE, 2020-2027 (USD MILLION) 74
FIGURE 45 U.K: AIR SEPARATION PLANT MARKET, BY PROCESS, 2020-2027 (USD MILLION) 74
FIGURE 46 U.K: AIR SEPARATION PLANT MARKET, BY GAS, 2020-2027 (USD MILLION) 76
FIGURE 47 U.K: AIR SEPARATION PLANT MARKET, BY GAS, 2020-2027 (USD MILLION) 77
FIGURE 48 REST OF EUROPE: AIR SEPARATION PLANT MARKET, BY TYPE, 2020-2027 (USD MILLION) 78
FIGURE 49 REST OF EUROPE: AIR SEPARATION PLANT MARKET, BY PROCESS, 2020-2027 (USD MILLION) 79
FIGURE 50 REST OF EUROPE: AIR SEPARATION PLANT MARKET, BY GAS, 2020-2027 (USD MILLION) 80
FIGURE 51 REST OF EUROPE: AIR SEPARATION PLANT MARKET, BY APPLICATION, 2020-2027 (USD MILLION) 81
FIGURE 52 ASIA-PACIFIC : AIR SEPARATION PLANT MARKET , BY REGION, 2020-2027 (USD MILLION) 82
FIGURE 53 ASIA-PACIFIC: AIR SEPARATION PLANT MARKET, BY TYPE, 2020-2027 (USD MILLION) 83
FIGURE 54 ASIA-PACIFIC: AIR SEPARATION PLANT MARKET, BY PROCESS, 2020-2027 (USD MILLION) 84
FIGURE 55 ASIA-PACIFIC: AIR SEPARATION PLANT MARKET, BY GAS, 2020-2027 (USD MILLION) 85
FIGURE 56 ASIA-PACIFIC: AIR SEPARATION PLANT MARKET, BY APPLICATION, 2020- 2027 (USD MILLION) 86
FIGURE 57 CHINA: AIR SEPARATION PLANT MARKET, BY TYPE, 2020-2027 (USD MILLION) 87
FIGURE 58 CHINA: AIR SEPARATION PLANT MARKET, BY PROCESS, 2020-2027 (USD MILLION) 87
FIGURE 59 CHINA: AIR SEPARATION PLANT MARKET, BY GAS, 2020-2027 (USD MILLION) 89
FIGURE 60 CHINA: AIR SEPARATION PLANT MARKET, BY APPLICATION, 2020-2027 (USD MILLION) 90
FIGURE 61 INDIA: AIR SEPARATION PLANT MARKET, BY TYPE, 2020-2027 (USD MILLION) 91
FIGURE 62 INDIA: AIR SEPARATION PLANT MARKET, BY PROCESS, 2020-2027 (USD MILLION) 91
FIGURE 63 INDIA: AIR SEPARATION PLANT MARKET, BY GAS, 2020-2027 (USD MILLION) 93
FIGURE 64 INDIA: AIR SEPARATION PLANT MARKET, BY APPLICATION, 2020-2027 (USD MILLION) 94
FIGURE 65 JAPAN: AIR SEPARATION PLANT MARKET, BY TYPE, 2020-2027 (USD MILLION) 95
FIGURE 66 JAPAN: AIR SEPARATION PLANT MARKET, BY PROCESS, 2020-2027 (USD MILLION) 96
FIGURE 67 JAPAN: AIR SEPARATION PLANT MARKET, BY GAS, 2020-2027 (USD MILLION) 97
FIGURE 68 JAPAN: AIR SEPARATION PLANT MARKET, BY APPLICATION, 2020-2027 (USD MILLION) 98
FIGURE 69 REST OF APAC: AIR SEPARATION PLANT MARKET, BY TYPE, 2020-2027 (USD MILLION) 99
FIGURE 70 REST OF APAC: AIR SEPARATION PLANT MARKET, BY PROCESS, 2020-2027 (USD MILLION) 100
FIGURE 71 REST OF APAC: AIR SEPARATION PLANT MARKET, BY GAS, 2020-2027 (USD MILLION) 101
FIGURE 72 REST OF APAC: AIR SEPARATION PLANT MARKET, BY APPLICATION, 2020-2027 (USD MILLION) 102
FIGURE 73 REST OF APAC: AIR SEPARATION PLANT MARKET, BY REGION, 2020-2027 (USD MILLION) 103
FIGURE 74 REST OF WORLD: AIR SEPARATION PLANT MARKET, BY TYPE, 2020-2027 (USD MILLION) 104
FIGURE 75 REST OF WORLD: AIR SEPARATION PLANT MARKET, BY PROCESS, 2020-2027 (USD MILLION) 105
FIGURE 76 REST OF WORLD: AIR SEPARATION PLANT MARKET SIZE, BY GAS, 2020-2027 (USD MILLION) 106
FIGURE 77 REST OF WORLD: AIR SEPARATION PLANT MARKET, BY APPLICATION, 2020-2027 (USD MILLION) 107
FIGURE 78 MIDDLE EAST & AFRICA: AIR SEPARATION PLANT MARKET, BY TYPE, 2020-2027 (USD MILLION) 108
FIGURE 79 MIDDLE EAST & AFRICA: AIR SEPARATION PLANT MARKET, BY PROCESS, 2020–2027 (USD MILLION) 109
FIGURE 80 MIDDLE EAST & AFRICA: AIR SEPARATION PLANT MARKET, BY GAS, 2020-2027 (USD MILLION) 110
FIGURE 81 MIDDLE EAST & AFRICA: AIR SEPARATION PLANT MARKET, BY APPLICATION, 2020-2027 (USD MILLION) 111
FIGURE 82 SOUTH AMERICA: AIR SEPARATION PLANT MARKET, BY TYPE, 2020–2027 (USD MILLION) 112
FIGURE 83 SOUTH AMERICA: AIR SEPARATION PLANT MARKET, BY PROCESS, 2020–2027 (USD MILLION) 113
FIGURE 84 SOUTH AMERICA: AIR SEPARATION PLANT MARKET, BY GAS, 2020–2027 (USD MILLION) 114
FIGURE 85 SOUTH AMERICA: AIR SEPARATION PLANT MARKET, BY APPLICATION, 2020–2027 (USD MILLION) 115
FIGURE 86 GROWTH STRATEGIES ADOPTED BY KEY PLAYERS IN GLOBAL AIR SEPARATION PLANT MARKET,
2020-2027, (%) 116
FIGURE 87 TERMS OF THE MERGER 117
FIGURE 88 FOCUS OF THE MERGER 118
FIGURE 89 PRAXAIR INC. (U.S.) & LINDE AG (GERMANY) REVENUE, 2020-2027 (USD MILLION) 119
FIGURE 90 LINDE AG: TOTAL REVENUE VS SEGMENTAL REVENUE (USD MILLION) 120
FIGURE 91 LINDE AG (ENGINEERING DIVISION): GEOGRAPHIC REVENUE MIX, 2020 (%) 121
FIGURE 92 LINDE AG: KEY DEVELOPMENTS, 2020-2027 (%) 122
FIGURE 93 LINDE AG: SWOT ANALYSIS 122
FIGURE 94 AIR LIQUIDE S.A.: TOTAL REVENUE VS SEGMENTAL REVENUE (USD MILLION) 123
FIGURE 95 AIR LIQUIDE S.A.: GEOGRAPHICAL REVENUE, 2020 (%) 124
FIGURE 96 AIR LIQUIDE S.A.: KEY DEVELOPMENTS, 2020-2027 (%) 125
FIGURE 97 AIR LIQUIDE S.A.: SWOT ANALYSIS 125
FIGURE 98 PRAXAIR, INC.: NET SALES, 2020-2020 (USD MILLION) 126
FIGURE 99 PRAXAIR, INC.: GOEGRAPHICAL REVENUE MIX, 2020 (%) 127
FIGURE 100 PRAXAIR, INC.: KEY DEVELOPMENTS, 2020-2027 (%) 128
FIGURE 101 PRAXAIR, INC.: SWOT ANALYSIS 128
FIGURE 102 TAIYO NIPPON SANSO CORPORATION: NET SALES VS SEGMENTAL SALES, 2020-2027 (USD BILLION) 129
FIGURE 103 TAIYO NIPPON SANSO CORPORATION: GEOGRAPHICAL REVENUE MIX, 2020 (%) 130
FIGURE 104 TAIYO NIPPON SANSO CORPORATION: KEY DEVELOPMENTS, 2020-2027 (%) 130
FIGURE 105 TAIYO NIPPON SANSO CORPORATION: SWOT ANALYSIS 131
FIGURE 106 AIR PRODUCTS AND CHEMICALS, INC.: TOTAL REVENUE VS SEGMENTAL REVENUE,
2020-2027 (USD MILLION) 132
FIGURE 107 AIR PRODUCTS AND CHEMICALS, INC.: GEOGRAPHICAL REVENUE MIX, 2020 (%) 133
FIGURE 108 AIR PRODUCTS AND CHEMICALS, INC.: KEY DEVELOPMENTS, 2020-2020 (%) 133
FIGURE 109 AIR PRODUCTS AND CHEMICALS, INC.: SWOT ANALYSIS 134
FIGURE 110 MESSER GROUP GMBH: NET SALES, 2020-2027 (USD MILLION) 135
FIGURE 111 MESSER GROUP GMBH: GEOGRAPHICAL REVENUE MIX, 2020 (%) 136
FIGURE 112 MESSER GROUP GMBH: KEY DEVELOPMENTS, 2020-2027 (%) 137
FIGURE 113 ENERFLEX LTD: TOTAL REVENUE VS SEGMENTAL REVENUE, 2020-2027 (USD MILLION) 138
FIGURE 114 ENERFLEX LTD.: GEOGRAPHICAL REVENUE MIX, 2020 (%) 139
FIGURE 115 ENERFLEX LTD: KEY DEVELOPMENTS, 2020-2027 (%) 139
$8.13 billion
5.89 %
Asia-Pacific
2020- 2027
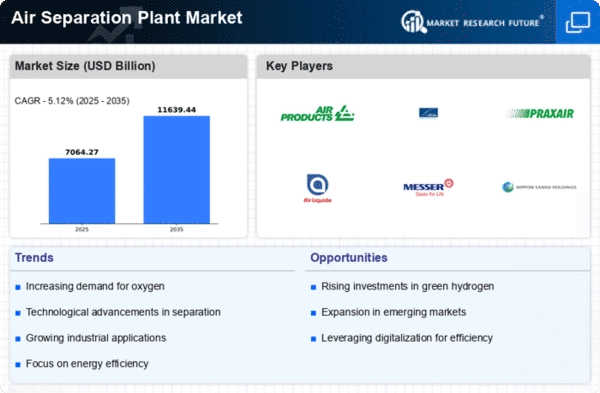
The Air Separation Plants Market will achieve a market valuation of USD 8.13 Billion by 2027 and a CAGR of 5.89% in the forecast period from 2027 to 2030. The market has reached USD 4.75 billion in 2020.
The air separation plants produce various atmospheric gases like nitrogen, argon, oxygen, and other gases. These separation plants produce neon, xenon, ultra-high purity oxygen, and krypton, including compressed dry air. The separation plants play a major role due to their higher usage in the industrial verticals like the medical sector, chemical industry, steel, and others. Therefore, the demand for Air Separation Plants Market is propelling at higher space.
The growing initiatives and implemented policies by the government for the safety of the environment are driving the Air Separation Plants Market. It is highly concerned in industrial regions like the Middle East countries such as Saudi Arabia and UAE. These regions are boosting global market growth. The rising demand in the chemical sectors and emerging economies will lead the market towards higher opportunities. Besides, the development of industrialization and increased usage of industrial gases are also helping the market to reach its goal.
The key players of the global air separation plants market are Linde AG, Air Liquide SA, Praxair, Inc., Air Products and Chemicals, Inc., Taiyo Nippon Sanso Corporation, Messer Group GmbH, Universal Industrial Gases, Enerflex Ltd., Technex Ltd., and Gas Engineering LLC.
April 2022
Air Liquide and EZZ Steel (the Middle East and Africa) is the global leader in steel and has signed an agreement on industrial gas supply to the EZZ's new plant in Ain Sokhna (East of Cairo, Egypt). Air Liquide has planned for an investment of 80 million dollars for the Air Separation Unit (ASU). It will supply EZZ throughout the contract years and other customer needs in the basin.
April 2022
Airgas, a leader of Air Liquide company, will purchase wind power for an Air Separation Unit in (Cleburne, Texas) outside of Dallas. It is the first Airgas primary production unit powered by an energy mix, including renewable energy. The air separation units produce liquid oxygen, argon, and nitrogen mixed with energy sources to run on wind power. It will cut the carbon footprint by an estimation of15,840 metric tons per year.
North America is referred as one of the leading manufacturers and distributors of high purity oxygen, cylinder filling plants and different gas generator for medical, industrial and other applications, for instance, Linde North America is investing in a site that has a new gasification train and ancillary equipment and facilities. This expected to increase the demand for air separation plants in the region during the forecast period.
The global air separation plants market has been segmented based on type, process, gas, application, and region.
The global market by type has been segmented into under 20000 m3/h, 20,000-40,000 m3/h, 40,000-80,000 m3/h, and more than 80,000 m3/h. Among these types, in 2018, the global market was led by 20,000-40,000 m3/h segment and is projected to lead throughout the forecast period. The 20,000- 40,000 m3/h capacity type is used for air separation purposes. These are majorly used in the heat treatment process, welding, pulp & paper industry, the steel industry where certain gases that will react with and degrade the product, are removed. This expected to enhance the demand for the 20,000- 40,000 m3/h capacity type air separation plants in the global market during the forecast period.
Based on the process, the market has been segmented into the cryogenic distillation process and non-cryogenic distillation process. Among these processes, the cryogenic distillation process has accounted for the largest market share, followed by the non-cryogenic distillation process. Cryogenic distillation process separates oxygen from air by liquefying air at shallow temperature. Cryogenic air separation process relies on the differences in boiling points to separate air and purify into the desired gas supply and liquid products, such as oxygen, nitrogen, argon. It is used in medium to large scale plants to produce nitrogen, oxygen, and argon, as gases or liquid products. Moreover, all plants producing liquefied industrial gas products utilize cryogenic technology process, which enhanced the global market size for the air separation plants in 2018 and further expanding plants producing liquefied industrial gas is expected to raise the demand for the cryogenic technology process in the global market during the forecast period.
On the basis of gas, the global market has been segmented into nitrogen, oxygen, and others. In 2018, the oxygen segment dominated the market and projected to be dominant throughout the forecast period. The oxygen (O2) is an active, life-sustaining component of the atmosphere. It is colorless, odorless and tasteless & has poor solubility in water. The largest consumer of oxygen is the steel industry. Moreover, Oxygen has numerous uses in steelmaking and other metals refining and fabrication processes which are used in chemicals, pharmaceuticals, petroleum processing, glass, and ceramic manufacture and pulp and paper manufacture.
On the basis of application, the global market has been segmented into chemical, oil & gas industry, paper, metallurgy, and others. In 2018, the metallurgy segment dominated the market and projected to be dominant throughout the forecast period. Gases act as a manufacturer of casting molds to enhance their hardness. Moreover, they are also used to melt the steel and other metals and work as a shielding gas in the heat treatment of iron, steel, and other metals. The largest user of oxygen is the steel and metal industry. They are used to cool materials which are heat sensitive or soft at room temperature. Thus, these factors and features are expected to lead the global market growth for air separation plants during the forecast period.
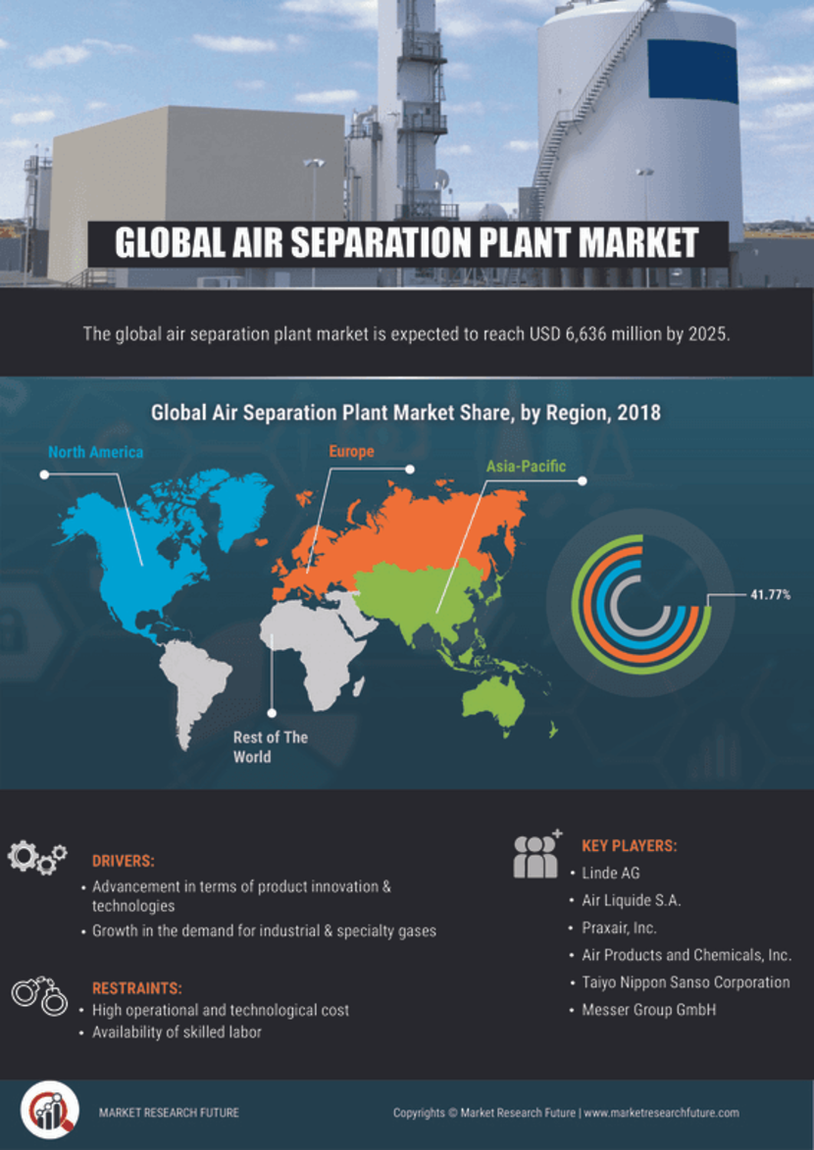
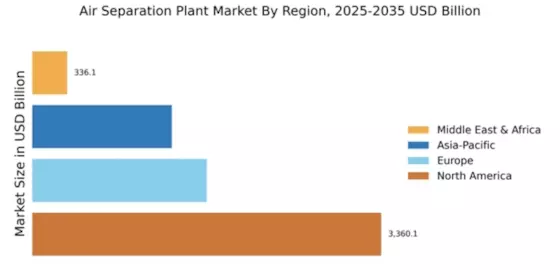
On the basis of region, the global air separation plants market is segmented into North America, Europe, Asia-Pacific (APAC), and the rest of the world (RoW).
Global Air Separation Plants Market, by Region, 2018
Source: MRFR Analysis
Europe is referred to as one of the leading markets for air separation plant under segments such as by process and by gas. European governments such as that of France and Germany, devote a large share of spending on infrastructure and as well as on innovations in current technology for reducing capital costs and driving up process efficiency, for instance, a European supplier of industrial and medical gas products, provides ULTRA-AL merchant air separation plants. This influence the demand for air separation plants market in the region.
The Rest of the World includes countries such as the Middle East & Africa and South America. The Middle East & Africa is growing owing to the growth in the Metallurgy industry, which mainly drives the market growth for air separation plant during the forecast period.
The global air separation plants market has been segmented based on type, process, gas, application, and region. On the basis of type, the market has been segmented into under 20000 m3/h, 20,000-40,000 m3/h, 40,000-80,000 m3/h, and more than 80,000 m3/h. Among these types, the 20,000-40,000 m3/h segment is projected to be dominant throughout the forecast period. Additionally, the 20,000-40,000 m3/h section has also registered as the fastest growing segment. On the basis of process, in 2018, the cryogenic distillation process segment was dominated by the global market followed by the non-cryogenic distillation process. On the basis of gas, the oxygen segment is projected to be dominant throughout the forecast period. On the basis of application, the metallurgy segment is expected to be dominant throughout the forecast period. On the basis of region, Asia-Pacific has accounted for the largest market followed by North America and Europe.
Air separation plants are used to separate the atmospheric air into its various primary components like nitrogen, oxygen, and other inert gases. The most common method for air separation is cryogenic distillation. Cryogenic air separation units (ASUs) are built to provide gases such as nitrogen, oxygen, carbon dioxide, argon, hydrogen, helium, and acetylene. Air separation plant has seen a rise in demand across various industries such as food & beverages, Automotive, paper & pulp, healthcare.
Report Attribute/Metric | Details |
---|---|
Market Size |
|
CAGR | 5% CAGR (2022-2030) |
Base Year | 2021 |
Forecast Period | 2022-2030 |
Historical Data | 2019 & 2020 |
Forecast Units | Value (USD Million) |
Report Coverage | Revenue Forecast, Competitive Landscape, Growth Factors, and Trends |
Segments Covered | Type, Process, Gas and Application |
Geographies Covered | North America, Europe, Asia-Pacific, and Rest of the World (RoW) |
Key Vendors | Linde AG, Air Liquide SA, Praxair, Inc., Air Products and Chemicals, Inc., Taiyo Nippon Sanso Corporation, Messer Group GmbH, Universal Industrial Gases, Enerflex Ltd., Technex Ltd., and Gas Engineering LLC |
Key Market Opportunities |
|
Key Market Drivers |
|
Frequently Asked Questions (FAQ) :
The air separation plants global market is supposed to augment at 5.89% CAGR over the assessment period.
The air separation plants industry size is supposed to reach a valuation of USD 8.13 Billion by 2027.
The segments based on process are cryogenic distillation process and non-cryogenic distillation process.
The major participants are Linde AG, Praxair, Inc., Air Liquide SA, Air Products and Chemicals, Inc., Messer Group GmbH, Taiyo Nippon Sanso Corporation, Universal Industrial Gases, Technex Ltd., Enerflex Ltd., and Gas Engineering LLC.
The cryogenic distillation process segment is presumed to dominate the air separation plants market.
By gas, the segments of the air separation plants market are nitrogen, oxygen, and others.
By application, the segments are chemical, paper, metallurgy, oil & gas industry, and others.