• Cat-intel
  • MedIntelliX
  • Resources
  • About Us
  • Hero Background
    English
    Chinese
    French
    Japanese
    Korean
    German
    Spanish

    Europe Biodiesel Fuel Additive Market Share

    ID: MRFR/CnM/10913-HCR
    128 Pages
    Anshula Mandaokar
    October 2025

    Europe Biodiesel Fuel Additive Market Research Report Information By Source (Rapessed Oil/Canola Oil, Soybean Oil, Sunflower Oil, Palm Oil, Used Kitchen Oil Ester, Animal Fat, and Others), By Type (Antioxidants, Cold Flow Improvers, Octane & Cetane Improvers, Biocides, Dispersants, and Others), By End-Use (Transportation, Power Generation, Industrial, and Others) – and Europe Market Forecas...

    Share:
    Download PDF ×

    We do not share your information with anyone. However, we may send you emails based on your report interest from time to time. You may contact us at any time to opt-out.

    Europe Biodiesel Fuel Additive Market Infographic
    $ 4,950.0
    $ 5,950.0
    $ 7,250.0

    Market Share

    Europe Biodiesel Fuel Additive Market Share Analysis

    The Europe Biodiesel Fuel Additive Market is a dynamic landscape, and market share positioning strategies play a pivotal role in determining the success of companies in this sector. Several key strategies contribute to the competitive positioning of businesses operating in the biodiesel fuel additive market in Europe. Companies often strive to stand out by offering unique and innovative biodiesel fuel additives. By focusing on research and development, firms can introduce products with enhanced performance, better compatibility, and improved environmental characteristics, thus gaining a competitive edge in the market. Collaboration is a key strategy to expand market reach. Forming partnerships with biodiesel producers, fuel suppliers, and distribution networks allows companies to leverage existing networks and gain access to a broader customer base. This approach helps in increasing market share by creating a mutually beneficial ecosystem. Ensuring that products comply with stringent environmental regulations is critical. Companies that invest in obtaining certifications for their biodiesel fuel additives demonstrate commitment to quality and environmental standards. This not only enhances credibility but also opens doors to markets where adherence to regulations is a prerequisite. Increasing market share involves educating customers about the benefits of biodiesel fuel additives. Companies looking to bolster their market share often explore opportunities in new regions. Expanding the geographic footprint allows businesses to tap into emerging markets and diversify their customer base. Understanding regional demands and tailoring products to specific needs can be a key driver for success. Competing on the basis of cost is a classic strategy. Streamlining production processes, optimizing supply chains, and achieving economies of scale can enable companies to offer competitive pricing. Cost-effective solutions attract budget-conscious consumers and contribute to increased market penetration. With growing environmental concerns, consumers are increasingly inclined towards sustainable and eco-friendly products. Companies investing in sustainable practices, such as using recycled materials or adopting green manufacturing processes, position themselves as environmentally responsible, attracting a segment of conscious consumers and enhancing market share. The biodiesel fuel additive market is dynamic, with technology and market trends constantly evolving. Companies that prioritize continuous innovation and adaptability to changing market conditions are better positioned to meet customer needs effectively. This adaptability ensures long-term relevance and sustained market share.

    Market Summary

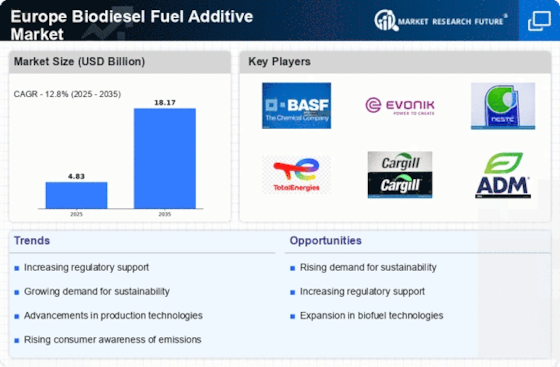
    The Europe Biodiesel Fuel Additive Market is projected to grow significantly from 4.83 USD Million in 2024 to 18.17 USD Million by 2035.

    Key Market Trends & Highlights

    Europe Biodiesel Fuel Additive Key Trends and Highlights

    • The market is expected to expand at a compound annual growth rate (CAGR) of 9.81 percent from 2025 to 2035.
    • By 2035, the market valuation is anticipated to reach 3500 USD Million, indicating robust growth potential.
    • in 2024, the market is valued at 4.83 USD Million, reflecting a strong foundation for future expansion.
    • Growing adoption of biodiesel fuel additives due to increasing environmental regulations is a major market driver.

    Market Size & Forecast

    2024 Market Size 4.83 (USD Million)
    2035 Market Size 18.17 (USD Million)
    CAGR (2025 - 2035) 12.80%
    Largest Regional Market Share in 2024 -)

    Major Players

    Apple Inc (US), Microsoft Corp (US), Amazon.com Inc (US), Alphabet Inc (US), Berkshire Hathaway Inc (US), Tesla Inc (US), Meta Platforms Inc (US), Johnson & Johnson (US), Visa Inc (US), Samsung Electronics Co Ltd (KR)

    Market Trends

    Rising concerns related to the environment are driving market growth

    Furthermore, additives for biodiesel work by augmenting the environmentally beneficial properties of biodiesel, increasing its efficiency and consciousness. There is a growing need for biodiesel and related additives as people, companies, and governments strive to reduce their environmental effect and carbon footprint. This is because a more sustainable and environmentally friendly energy landscape is required.

    The market for biodiesel fuel additives is largely driven by engine performance and efficiency. The environmental benefits of biodiesel have been tempered by concerns about its energy density, performance in cold climates, and possible effects on engine parts. This has made the creation and use of additives necessary to improve the general efficiency of engines running on biodiesel. These additives make biodiesel a feasible option for areas with varying climates by enhancing its cold flow characteristics and lubricity, which allows it to perform ideally in a wider temperature range.

    Furthermore, producers of vehicles and equipment find biodiesel additives to be an appealing alternative due to the higher energy efficiency they achieve, which results in lower fuel consumption and longer engine lifespans. The increased cetane rating of biodiesel—which can be further enhanced with additives—leads to improved combustion efficiency and lower emissions. Thus, driving the biodiesel fuel additive market revenue.

    The increasing emphasis on sustainable energy sources is likely to drive the demand for biodiesel fuel additives across Europe, as governments implement stricter regulations aimed at reducing carbon emissions.

    European Commission

    Europe Biodiesel Fuel Additive Market Market Drivers

    Rising Demand for Renewable Energy

    The Global Europe Biodiesel Fuel Additive Market Industry is experiencing a notable surge in demand for renewable energy sources. This trend is largely driven by the European Union's commitment to reducing greenhouse gas emissions and promoting sustainable energy. As countries strive to meet the EU's Renewable Energy Directive, the adoption of biodiesel and its additives is expected to increase significantly. In 2024, the market is projected to reach 1250 USD Million, reflecting the growing emphasis on eco-friendly alternatives to fossil fuels. This shift not only supports energy independence but also aligns with global sustainability goals.

    Market Segment Insights

    Biodiesel Fuel Additive Source Insights

    The Europe Biodiesel Fuel Additive market segmentation, based on source includes Rapessed Oil/Canola Oil, Soybean Oil, Sunflower Oil, Palm Oil, Used Kitchen Oil Ester, Animal Fat, and Others. The rapessed oil/canola oil segment dominated the market mostly. One popular feedstock used in the manufacturing of biodiesel is rapeseed oil, also referred to as canola oil. Under the biodiesel fuel additive market, it is categorized as "vegetable oil-based biodiesel feedstocks." By a procedure known as transesterification, the oil is transformed into biodiesel fuel using these feedstocks to create biodiesel.

    A renewable and more ecologically friendly substitute for conventional diesel fuel is biodiesel, which can be mixed with it.

    Biodiesel Fuel Additive Type Insights

    The Europe Biodiesel Fuel Additive market segmentation, based on type, includes Antioxidants, Cold Flow Improvers, Octane & Cetane Improvers, Biocides, Dispersants, and Others. The octane & cetane improvers category generated the most income. Admixtures, commonly referred to as octane & cetane improvers, are added to fuels to improve system performance. Maximum Octane and Cetane diesel fuels have a host of positive environmental effects, including decreased fuel consumption, white smoke during warm-up, and engine noise. They also minimize the ignition delay and emit less PM, HC, CO, and NOx.

    Biodiesel Fuel Additive End-Use Insights

    The Europe Biodiesel Fuel Additive market segmentation, based on end-use, includes Transportation, Power Generation, Industrial, and Others. The power generation category generated the most income. Renewable and sustainable energy options include the use of biodiesel fuel additives in power generation. Fuel additives for biodiesel can enhance the fuel's environmental qualities and performance. Biodiesel is a renewable fuel source. These additives can decrease emissions, increase fuel stability, and improve combustion efficiency.

    Figure 1: Europe Biodiesel Fuel Additive Market, by End-Use, 2022 & 2032 (USD Billion)Source: Secondary Research, Primary Research, Market Research Future Database and Analyst Review

    Get more detailed insights about Europe Biodiesel Fuel Additive Market Research Report - Forecast till 2034

    Regional Insights

    The Europe Biodiesel Fuel Additive market is growing rapidly over the forecast period. Stringent government emission regulations and rising public awareness of environmental deterioration are the primary factors behind the growth. Because of the strict emission regulations for vehicles set by the European Union, biodiesel fuel additives are used to reduce harmful emissions from automobiles. Moreover, the presence of significant automakers in the area has increased the demand for high-performance biodiesel fuel additives.

    Additionally, manufacturers from a variety of industries, including equipment manufacturers, suppliers of materials and components, engine producers, and full system integrators, call Germany home as one of the primary manufacturing hubs for the aircraft sector. Owing to all of these reasons, the nation's fuel additive market is anticipated to rise steadily over the projection year.

    Figure 2: EUROPE BIODIESEL FUEL ADDITIVE MARKET SHARE BY REGION 2022 (USD Billion)EUROPE BIODIESEL FUEL ADDITIVE MARKET SHARE BY REGION 2022Source: Secondary Research, Primary Research, Market Research Future Database and Analyst Review

    Key Players and Competitive Insights

    Leading market players are investing heavily in research and development in order to expand their product lines, which will help the biodiesel fuel additive market, grow even more. Market participants are also undertaking a variety of strategic activities to expand their footprint, with important market developments including new product launches, contractual agreements, mergers and acquisitions, higher investments, and collaboration with other organizations. To expand and survive in a more competitive and rising market climate, biodiesel fuel additive industry must offer cost-effective items.

    Key Companies in the Europe Biodiesel Fuel Additive Market market include

    Industry Developments

    Future Outlook

    Europe Biodiesel Fuel Additive Market Future Outlook

    The Europe Biodiesel Fuel Additive Market is projected to grow at a 12.80% CAGR from 2025 to 2035, driven by regulatory support, technological advancements, and increasing demand for sustainable fuels.

    New opportunities lie in:

    • Develop innovative biodiesel additives to enhance fuel efficiency and reduce emissions.
    • Invest in R&D for bio-based additives to meet evolving regulatory standards.
    • Expand distribution networks to capitalize on emerging markets in Eastern Europe.

    By 2035, the market is expected to achieve robust growth, positioning itself as a leader in sustainable fuel solutions.

    Market Segmentation

    Biodiesel Fuel Additive Source Outlook

    • Rapessed Oil/Canola Oil
    • Soybean Oil
    • Sunflower Oil
    • Palm Oil
    • Used Kitchen Oil Ester
    • Animal Fat
    • Others

    Biodiesel Fuel Additive Type Outlook

    • Antioxidants
    • Cold Flow Improvers
    • Octane & Cetane Improvers
    • Biocides
    • Dispersants
    • Others

    Biodiesel Fuel Additive Regional Outlook

    • Europe
    • Germany
    • France
    • UK
    • Italy
    • Spain
    • Rest of Europe

    Biodiesel Fuel Additive End-Use Outlook

    • Transportation
    • Power Generation
    • Industrial
    • Others

    Report Scope

    Report Attribute/Metric Details  
    Market Size 2024 USD 4.83 Billion
    Market Size 2025 USD 5.45 Billion
    Market Size 2035 18.17 (Value (USD Billion))
    Compound Annual Growth Rate (CAGR) 12.80% (2025 - 2035)
    Base Year 2024
    Market Forecast Period 2025 - 2035
    Historical Data 2020- 2024
    Market Forecast Units Value (USD Billion)
    Report Coverage Revenue Forecast, Market Competitive Landscape, Growth Factors, and Trends
    Segments Covered Source, Type, End-Use, and Region
    Region Covered Europe
    Countries Covered German, France, UK, Italy, Spain
    Key Companies Profiled Fuel Quality Services, Inc. (FQS), Chemiphase Ltd, CLARIANT AG, E-ZOIL, Eastman Chemical Company, The Lubrizol Corporation, Afton Chemical Corporation, EVONIK INDUSTRIES AG, Chevron Oronite Company LLC, Biofuel Systems Group Ltd., TotalEnergies, NALCO, Infineum International Ltd., Innospec Inc., Renewable Oil International, Kemin Industries Inc., Lubrizol Corporation, PMC Biogenix Inc., Power Service Products Inc., and Vanderbilt Chemicals, LLC
    Key Market Opportunities Growing environmental concerns are fueling market expansion
    Key Market Dynamics Rising demand from automotive and aerospace sector

    Market Highlights

    Author

    Anshula Mandaokar
    Team Lead - Research

    She holds an experience of about 6+ years in market research and business consulting, working under the spectrum of information communication technology, telecommunications and semiconductor domains. aarti conceptualizes and implements a scalable business strategy and provides strategic leadership to the clients. her expertise lies in market estimation, competitive intelligence, pipeline analysis, customer assessment, etc.

    Leave a Comment

    Latest Comments

    John Doe
    john@example.com

    This is a great article! Really helped me understand the topic better.

    Posted on July 23, 2025, 10:15 AM
    Jane Smith
    jane@domain.com

    Thanks for sharing this. I’ve bookmarked it for later reference.

    Posted on July 22, 2025, 7:45 PM

    FAQs

    How much is the biodiesel fuel additive market?

    The Europe Biodiesel Fuel Additive market size was valued at USD 4.83 Billion in 2024.

    What is the growth rate of the biodiesel fuel additive market?

    The market is projected to grow at a CAGR of 12.80% during the forecast period, 2025-2034.

    Who are the key players in the biodiesel fuel additive market?

    The key players in the market are Fuel Quality Services, Inc. (FQS), Chemiphase Ltd, CLARIANT AG, E-ZOIL, Eastman Chemical Company, The Lubrizol Corporation, Afton Chemical Corporation, EVONIK INDUSTRIES AG, Chevron Oronite Company LLC, Biofuel Systems Group Ltd., TotalEnergies, NALCO, Infineum International Ltd., Innospec Inc., Renewable Oil International, Kemin Industries Inc., Lubrizol Corporation, PMC Biogenix Inc., Power Service Products Inc., and Vanderbilt Chemicals, LLC.

    Which source led the biodiesel fuel additive market?

    The rapessed oil/canola oil category dominated the market in 2024.

    Which end-use had the largest market share in the biodiesel fuel additive market?

    The power generation category had the largest share in the market.

    1. List of Tables and Figures
      1. Table of Contents 1. Executive Summary 2. Market Introduction 2.1. Definition 2.2. Scope of the Study 2.2.1. Research Objective 2.2.2. Assumptions 2.2.3. Limitations 3. Research Methodology 3.1. Overview 3.2. Data Mining 3.3. Secondary Research 3.4. Primary Research 3.4.1. Primary Interviews and Information Gathering Process 3.4.2. Breakdown of Primary Respondents 3.5. Forecasting Model 3.6. Market Size Estimation 3.6.1. Bottom-up Approach 3.6.2. Top-Down Approach 3.7. Data Triangulation 3.8. Validation 4. MARKET DYNAMICS 4.1. Overview 4.2. Drivers 4.3. Restraints 4.4. Opportunities 5. MARKET FACTOR ANALYSIS 5.1. Value Chain Analysis 5.2. Porter’s Five Forces Analysis 5.2.1. Bargaining Power of Suppliers 5.2.2. Bargaining Power of Buyers 5.2.3. Threat of New Entrants 5.2.4. Threat of Substitutes 5.2.5. Intensity of Rivalry 5.3. COVID-19 Impact Analysis 5.3.1. Market Impact Analysis 5.3.2. Regional Impact 5.3.3. Opportunity and Threat Analysis 6. EUROPE BIODIESEL FUEL ADDITIVE MARKET, BY SOURCE 6.1. Overview 6.2. Rapessed Oil/Canola Oil 6.3. Soybean Oil 6.4. Sunflower Oil 6.5. Palm Oil 6.6. Used Kitchen Oil Ester 6.7. Animal Fat 6.8. Others 7. EUROPE BIODIESEL FUEL ADDITIVE MARKET, BY TYPE 7.1. Overview 7.2. Antioxidants 7.3. Cold Flow Improvers 7.4. Octane & Cetane Improvers 7.5. Biocides 7.6. Dispersants 7.7. Others 8. EUROPE BIODIESEL FUEL ADDITIVE MARKET, BY END-USE 8.1. Overview 8.2. Transportation 8.3. Power Generation 8.4. Industrial 8.5. Others 9. EUROPE BIODIESEL FUEL ADDITIVE MARKET, BY REGION 9.1. Overview 9.2. Europe 9.2.1. Germany 9.2.2. France 9.2.3. UK 9.2.4. Italy 9.2.5. Spain 9.2.6. Rest of Europe 10. Competitive Landscape 10.1. Overview 10.2. Competitive Analysis 10.3. Market Share Analysis 10.4. Major Growth Strategy in the Europe Biodiesel Fuel Additive Market, 10.5. Competitive Benchmarking 10.6. Leading Players in Terms of Number of Developments in the Europe Biodiesel Fuel Additive Market, 10.7. Key developments and Growth Strategies 10.7.1. New Product Launch/Service Deployment 10.7.2. Merger & Acquisitions 10.7.3. Joint Ventures 10.8. Major Players Financial Matrix 10.8.1. Sales & Operating Income, 2022 10.8.2. Major Players R&D Expenditure. 2022 11. COMPANY PROFILES 11.1. Fuel Quality Services, Inc. (FQS) 11.1.1. Company Overview 11.1.2. Financial Overview 11.1.3. Products Offered 11.1.4. Key Developments 11.1.5. SWOT Analysis 11.1.6. Key Strategies 11.2. CHEMIPHASE LTD 11.2.1. Company Overview 11.2.2. Financial Overview 11.2.3. Products Offered 11.2.4. Key Developments 11.2.5. SWOT Analysis 11.2.6. Key Strategies 11.3. CLARIANT AG 11.3.1. Company Overview 11.3.2. Financial Overview 11.3.3. Products Offered 11.3.4. Key Developments 11.3.5. SWOT Analysis 11.3.6. Key Strategies 11.4. E-ZOIL 11.4.1. Company Overview 11.4.2. Financial Overview 11.4.3. Products Offered 11.4.4. Key Developments 11.4.5. SWOT Analysis 11.4.6. Key Strategies 11.5. Eastman Chemical Company 11.5.1. Company Overview 11.5.2. Financial Overview 11.5.3. Products Offered 11.5.4. Key Developments 11.5.5. SWOT Analysis 11.5.6. Key Strategies 11.6. The Lubrizol Corporation 11.6.1. Company Overview 11.6.2. Financial Overview 11.6.3. Products Offered 11.6.4. Key Developments 11.6.5. SWOT Analysis 11.6.6. Key Strategies 11.7. Afton Chemical Corporation 11.7.1. Company Overview 11.7.2. Financial Overview 11.7.3. Products Offered 11.7.4. Key Developments 11.7.5. SWOT Analysis 11.7.6. Key Strategies 11.8. EVONIK INDUSTRIES AG 11.8.1. Company Overview 11.8.2. Financial Overview 11.8.3. Products Offered 11.8.4. Key Developments 11.8.5. SWOT Analysis 11.8.6. Key Strategies 11.9. Chevron Oronite Company LLC 11.9.1. Company Overview 11.9.2. Financial Overview 11.9.3. Products Offered 11.9.4. Key Developments 11.9.5. SWOT Analysis 11.9.6. Key Strategies 11.10. Biofuel Systems Group Ltd. 11.10.1. Company Overview 11.10.2. Financial Overview 11.10.3. Products Offered 11.10.4. Key Developments 11.10.5. SWOT Analysis 11.10.6. Key Strategies 11.11. TotalEnergies 11.11.1. Company Overview 11.11.2. Financial Overview 11.11.3. Products Offered 11.11.4. Key Developments 11.11.5. SWOT Analysis 11.11.6. Key Strategies 11.12. NALCO 11.12.1. Company Overview 11.12.2. Financial Overview 11.12.3. Products Offered 11.12.4. Key Developments 11.12.5. SWOT Analysis 11.12.6. Key Strategies 11.13. Infineum International Ltd. 11.13.1. Company Overview 11.13.2. Financial Overview 11.13.3. Products Offered 11.13.4. Key Developments 11.13.5. SWOT Analysis 11.13.6. Key Strategies 11.14. Innospec Inc. 11.14.1. Company Overview 11.14.2. Financial Overview 11.14.3. Products Offered 11.14.4. Key Developments 11.14.5. SWOT Analysis 11.14.6. Key Strategies 11.15. Renewable Oil International 11.15.1. Company Overview 11.15.2. Financial Overview 11.15.3. Products Offered 11.15.4. Key Developments 11.15.5. SWOT Analysis 11.15.6. Key Strategies 11.16. Kemin Industries Inc. 11.16.1. Company Overview 11.16.2. Financial Overview 11.16.3. Products Offered 11.16.4. Key Developments 11.16.5. SWOT Analysis 11.16.6. Key Strategies 11.17. Lubrizol Corporation 11.17.1. Company Overview 11.17.2. Financial Overview 11.17.3. Products Offered 11.17.4. Key Developments 11.17.5. SWOT Analysis 11.17.6. Key Strategies 11.18. PMC Biogenix Inc. 11.18.1. Company Overview 11.18.2. Financial Overview 11.18.3. Products Offered 11.18.4. Key Developments 11.18.5. SWOT Analysis 11.18.6. Key Strategies 11.19. Power Service Products Inc. 11.19.1. Company Overview 11.19.2. Financial Overview 11.19.3. Products Offered 11.19.4. Key Developments 11.19.5. SWOT Analysis 11.19.6. Key Strategies 11.20. VANDERBILT CHEMICALS, LLC 11.20.1. Company Overview 11.20.2. Financial Overview 11.20.3. Products Offered 11.20.4. Key Developments 11.20.5. SWOT Analysis 11.20.6. Key Strategies 12. APPENDIX 12.1. References 12.2. Related Reports   LIST OF TABLES
      2. TABLE 1 EUROPE BIODIESEL FUEL ADDITIVE MARKET, SYNOPSIS, 2025 - 2034
      3. TABLE 2 EUROPE BIODIESEL FUEL ADDITIVE MARKET, ESTIMATES & FORECAST, 2025 - 2034 (USD BILLION)
      4. TABLE 3 EUROPE BIODIESEL FUEL ADDITIVE MARKET, BY SOURCE, 2025 - 2034 (USD BILLION)
      5. TABLE 4 EUROPE BIODIESEL FUEL ADDITIVE MARKET, BY TYPE, 2025 - 2034 (USD BILLION)
      6. TABLE 5 EUROPE BIODIESEL FUEL ADDITIVE MARKET, BY END-USE, 2025 - 2034 (USD BILLION)
      7. TABLE 1 GERMANY: BIODIESEL FUEL ADDITIVE MARKET, BY SOURCE, 2025 - 2034 (USD BILLION)
      8. TABLE 2 GERMANY: BIODIESEL FUEL ADDITIVE MARKET, BY TYPE, 2025 - 2034 (USD BILLION)
      9. TABLE 3 GERMANY: BIODIESEL FUEL ADDITIVE MARKET, BY END-USE, 2025 - 2034 (USD BILLION)
      10. TABLE 4 FRANCE: BIODIESEL FUEL ADDITIVE MARKET, BY SOURCE, 2025 - 2034 (USD BILLION)
      11. TABLE 5 FRANCE: BIODIESEL FUEL ADDITIVE MARKET, BY TYPE, 2025 - 2034 (USD BILLION)
      12. TABLE 6 FRANCE: BIODIESEL FUEL ADDITIVE MARKET, BY END-USE, 2025 - 2034 (USD BILLION)
      13. TABLE 7 ITALY: BIODIESEL FUEL ADDITIVE MARKET, BY SOURCE, 2025 - 2034 (USD BILLION)
      14. TABLE 8 ITALY: BIODIESEL FUEL ADDITIVE MARKET, BY TYPE, 2025 - 2034 (USD BILLION)
      15. TABLE 9 ITALY: BIODIESEL FUEL ADDITIVE MARKET, BY END-USE, 2025 - 2034 (USD BILLION)
      16. TABLE 10 SPAIN: BIODIESEL FUEL ADDITIVE MARKET, BY SOURCE, 2025 - 2034 (USD BILLION)
      17. TABLE 11 SPAIN: BIODIESEL FUEL ADDITIVE MARKET, BY TYPE, 2025 - 2034 (USD BILLION)
      18. TABLE 12 SPAIN: BIODIESEL FUEL ADDITIVE MARKET, BY END-USE, 2025 - 2034 (USD BILLION)
      19. TABLE 13 UK: BIODIESEL FUEL ADDITIVE MARKET, BY SOURCE, 2025 - 2034 (USD BILLION)
      20. TABLE 14 UK: BIODIESEL FUEL ADDITIVE MARKET, BY TYPE, 2025 - 2034 (USD BILLION)
      21. TABLE 15 UK: BIODIESEL FUEL ADDITIVE MARKET, BY END-USE, 2025 - 2034 (USD BILLION)
      22. TABLE 16 REST OF EUROPE: BIODIESEL FUEL ADDITIVE MARKET, BY SOURCE, 2025 - 2034 (USD BILLION)
      23. TABLE 17 REST OF EUROPE: BIODIESEL FUEL ADDITIVE MARKET, BY TYPE, 2025 - 2034 (USD BILLION)
      24. TABLE 18 REST OF EUROPE: BIODIESEL FUEL ADDITIVE MARKET, BY END-USE, 2025 - 2034 (USD BILLION) LIST OF FIGURES
      25. FIGURE 1 RESEARCH PROCESS
      26. FIGURE 2 MARKET STRUCTURE FOR THE EUROPE BIODIESEL FUEL ADDITIVE MARKET
      27. FIGURE 3 MARKET DYNAMICS FOR THE EUROPE BIODIESEL FUEL ADDITIVE MARKET
      28. FIGURE 4 EUROPE BIODIESEL FUEL ADDITIVE MARKET, SHARE (%), BY SOURCE, 2021
      29. FIGURE 5 EUROPE BIODIESEL FUEL ADDITIVE MARKET, SHARE (%), BY TYPE, 2021
      30. FIGURE 6 EUROPE BIODIESEL FUEL ADDITIVE MARKET, SHARE (%), BY END-USE, 2021
      31. FIGURE 7 EUROPE BIODIESEL FUEL ADDITIVE MARKET, SHARE (%), BY REGION, 2021
      32. FIGURE 8 EUROPE BIODIESEL FUEL ADDITIVE MARKET: COMPANY SHARE ANALYSIS, 2021 (%)
      33. FIGURE 9 FUEL QUALITY SERVICES, INC. (FQS): FINANCIAL OVERVIEW SNAPSHOT
      34. FIGURE 10 FUEL QUALITY SERVICES, INC. (FQS): SWOT ANALYSIS
      35. FIGURE 11 CHEMIPHASE LTD: FINANCIAL OVERVIEW SNAPSHOT
      36. FIGURE 12 CHEMIPHASE LTD: SWOT ANALYSIS
      37. FIGURE 13 CLARIANT AG: FINANCIAL OVERVIEW SNAPSHOT
      38. FIGURE 14 CLARIANT AG: SWOT ANALYSIS
      39. FIGURE 15 E-ZOIL: FINANCIAL OVERVIEW SNAPSHOT
      40. FIGURE 16 E-ZOIL: SWOT ANALYSIS
      41. FIGURE 17 EASTMAN CHEMICAL COMPANY: FINANCIAL OVERVIEW SNAPSHOT
      42. FIGURE 18 EASTMAN CHEMICAL COMPANY: SWOT ANALYSIS
      43. FIGURE 19 THE LUBRIZOL CORPORATION: FINANCIAL OVERVIEW SNAPSHOT
      44. FIGURE 20 THE LUBRIZOL CORPORATION: SWOT ANALYSIS
      45. FIGURE 21 AFTON CHEMICAL CORPORATION: FINANCIAL OVERVIEW SNAPSHOT
      46. FIGURE 22 AFTON CHEMICAL CORPORATION: SWOT ANALYSIS
      47. FIGURE 23 EVONIK INDUSTRIES AG: FINANCIAL OVERVIEW SNAPSHOT
      48. FIGURE 24 EVONIK INDUSTRIES AG: SWOT ANALYSIS
      49. FIGURE 25 CHEVRON ORONITE COMPANY LLC: FINANCIAL OVERVIEW SNAPSHOT
      50. FIGURE 26 CHEVRON ORONITE COMPANY LLC: SWOT ANALYSIS
      51. FIGURE 27 BIOFUEL SYSTEMS GROUP LTD.,: FINANCIAL OVERVIEW SNAPSHOT
      52. FIGURE 28 BIOFUEL SYSTEMS GROUP LTD.,: SWOT ANALYSIS
      53. FIGURE 29 TOTALENERGIES: FINANCIAL OVERVIEW SNAPSHOT
      54. FIGURE 30 TOTALENERGIES: SWOT ANALYSIS
      55. FIGURE 31 NALCO: FINANCIAL OVERVIEW SNAPSHOT
      56. FIGURE 32 NALCO: SWOT ANALYSIS
      57. FIGURE 33 INFINEUM INTERNATIONAL LTD.: FINANCIAL OVERVIEW SNAPSHOT
      58. FIGURE 34 INFINEUM INTERNATIONAL LTD.: SWOT ANALYSIS
      59. FIGURE 35 INNOSPEC INC.: FINANCIAL OVERVIEW SNAPSHOT
      60. FIGURE 36 INNOSPEC INC.: SWOT ANALYSIS
      61. FIGURE 37 RENEWABLE OIL INTERNATIONAL: FINANCIAL OVERVIEW SNAPSHOT
      62. FIGURE 38 RENEWABLE OIL INTERNATIONAL: SWOT ANALYSIS
      63. FIGURE 39 KEMIN INDUSTRIES INC.: FINANCIAL OVERVIEW SNAPSHOT
      64. FIGURE 40 KEMIN INDUSTRIES INC.: SWOT ANALYSIS
      65. FIGURE 41 LUBRIZOL CORPORATION: FINANCIAL OVERVIEW SNAPSHOT
      66. FIGURE 42 LUBRIZOL CORPORATION: SWOT ANALYSIS
      67. FIGURE 43 PMC BIOGENIX INC.: FINANCIAL OVERVIEW SNAPSHOT
      68. FIGURE 44 PMC BIOGENIX INC.: SWOT ANALYSIS
      69. FIGURE 45 POWER SERVICE PRODUCTS INC.: FINANCIAL OVERVIEW SNAPSHOT
      70. FIGURE 46 POWER SERVICE PRODUCTS INC.: SWOT ANALYSIS
      71. FIGURE 47 VANDERBILT CHEMICALS, LLC: FINANCIAL OVERVIEW SNAPSHOT
      72. FIGURE 48 VANDERBILT CHEMICALS, LLC: SWOT ANALYSIS

    Europe Biodiesel Fuel Additive Market Segmentation

    Market Segmentation Overview

    • Detailed segmentation data will be available in the full report
    • Comprehensive analysis by multiple parameters
    • Regional and country-level breakdowns
    • Market size forecasts by segment
    Infographic

    Free Sample Request

    Kindly complete the form below to receive a free sample of this Report

    Get Free Sample

    Customer Strories

    “I am very pleased with how market segments have been defined in a relevant way for my purposes (such as "Portable Freezers & refrigerators" and "last-mile"). In general the report is well structured. Thanks very much for your efforts.”

    Victoria Milne

    Founder
    Case Study
    Chemicals and Materials