Ethylene Carbonate Market Analysis
ID: MRFR/CnM/5866-CR
111 Pages
February 2023
Ethylene Carbonate Market Research Report Information By Form (Solid and Liquid), Applications (Lithium Battery Electrolytes, Lubricants, Plasticizers, Surface Coatings, Chemical Intermediates, Fiber Processing Agents, Dyes and Others), End-Use Industry (Automotive, Oil & Gas, Textile, Chemical, Medical, Personal Care & Hygiene, Agriculture and Others) And By Region (North America, Euro...

Market Summary
As per Market Research Future Analysis, the Global Ethylene Carbonate Market was valued at USD 0.73 billion in 2024 and is projected to grow from USD 0.8 billion in 2025 to USD 1.76 billion by 2034, with a CAGR of 9.20% during the forecast period. The increasing demand for ethylene carbonate, particularly in lithium-ion battery electrolytes, is driving market growth. The solid form of ethylene carbonate dominated the market in 2022, utilized in lubricants, solvents, and chemical intermediates. The Asia Pacific region held the largest market share in 2022, supported by a robust industrial base and low labor costs. Major companies are focusing on sustainable production to enhance their market presence.
Key Market Trends & Highlights
The ethylene carbonate market is witnessing significant trends driven by the demand for sustainable energy solutions.
- Projected market growth from USD 0.8 billion in 2025 to USD 1.76 billion by 2034.
- Solid form dominated the market in 2022 due to its applications in various industries.
- Asia Pacific held the largest market share in 2022, driven by the production of lithium-ion battery electrolytes.
- Over 10 million electric vehicles are currently on the road, increasing the demand for ethylene carbonate.
Market Size & Forecast
| 2024 Market Size | USD 0.73 Billion |
| 2025 Market Size | USD 0.8 Billion |
| 2034 Market Size | USD 1.76 Billion |
| CAGR | 9.20% |
| Largest Regional Market Share in 2022 | Asia Pacific. |
Major Players
Key companies include OUCC Toagosei Co., Ltd, Mitsubishi Chemical Corporation, Zibo Donghai Industries Co., Ltd, ALFA AESAR, BASF SE, Huntsman International LLC, Merck KGaA, New Japan Chemical Co., Ltd, Shandong Senjie Cleantech Co., Ltd, PANAX ETEC, Tokyo Chemical Industry Co., Ltd.
Market Trends
Rising Need for Ethylene Carbonate in the Production of Lithium-ion Battery Electrolytes
The ongoing advancements in battery technology and the increasing demand for sustainable solvents appear to drive the growth of the global ethylene carbonate market, suggesting a pivotal role in the transition towards greener energy solutions.
U.S. Department of Energy
Ethylene Carbonate Market Market Drivers
Rising Demand in Battery Applications
The Global Ethylene Carbonate Market Industry experiences a notable surge in demand due to its applications in lithium-ion batteries. As the world shifts towards electric vehicles and renewable energy storage, ethylene carbonate serves as a vital solvent in electrolyte formulations. The increasing adoption of electric vehicles is projected to drive the market, with the industry expected to reach 0.73 USD Billion in 2024. This trend suggests a robust growth trajectory, as manufacturers seek efficient and sustainable materials to enhance battery performance and longevity.
Market Segment Insights
Ethylene Carbonate Form Insights
In 2022, solid form dominated the world market. This is due to their increasing use in a variety of applications, including lubricants, ethylene carbonate solvents, plasticizers, and chemical intermediates. In order to serve end-use industries including the automotive, medical, chemical, and industrial, EC in solid form is frequently used in these applications. Cosmetics, medications, and soldering fluxes all contain solid ethylene carbonate as an ingredient. Additionally, it is employed as a solvent in the oil and gas sector to assist in reducing viscosity during high temperature or extreme pressure drilling operations where other fluids are too thin to work properly.
Additionally, lubricants and polymers employ liquid ethylene carbonate. The manufacturing of high-density polymers that can withstand impact and chemical deterioration uses this product extensively. Depending on the needs, substances like diethyl carbonate, ethene oxide, and propylene oxide can be combined with liquid EC to create specific materials. Additionally, liquid ethylene carbonate is employed in the production of the electrolyte for lithium-ion batteries. These elements are anticipated to increase demand for liquid ethylene carbonate.
March 2024
At the Cosmoprof Worldwide Bologna event, which will take place on March 21 in Bologna, Italy, the South Korean company LG Chem Ltd. has stated that it would present an environmentally friendly plastic substance that is created from polyethylene carbonate (PEC).
Across the World, Cosmoprof More than three thousand firms that specialize in materials, packaging, original development manufacturing (ODM), and brands are present at Bologna, which is widely recognized as the greatest expo in the beauty industry. These companies are displaying the most recent innovations and trends in the sector.
Get more detailed insights about Ethylene Carbonate Market Research Report - Global Forecast till 2034
Regional Insights
In 2022, Asia Pacific had a dominant share in the market. This is due to elements including a robust industrial base, supportive governmental regulations, and the availability of low labour costs that motivate important players to invest in the area. Along with producing EV lithium-ion batteries, the region also leads the world in the manufacture of lithium-ion battery electrolytes. The market is being driven by such reasons.
Due to the existence of huge firms in the chemical and automotive industries, North America is regarded as one of the primary product markets. Over the past ten years, North America has seen a steady increase in car utilization. The need for ethylene carbonate is growing as a result. Additionally, the U.S. market experienced strong demand for EV vehicles during the first quarter of 2022, which is anticipated to benefit the industry.
In September 2021, KPX Chemical, a producer of polyurethanes in Korea, and Huntsman Corporation, a chemical manufacturer in The Woodlands, have formed a joint venture called KPX Huntsman Polyurethanes Automotive Co. The joint venture will operate a specialist polyurethane production facility at KPX Chemical's Ulsan project, which will supply polyurethane to Korean automakers.
In June 2021, Huntsman Corporation, announced the production capacity expansion of Texas's current ethylene carbonate by mid-2023.
Figure 2: ETHYLENE CARBONATE MARKET, BY REGION, 2022 & 2030 (USD BILLION)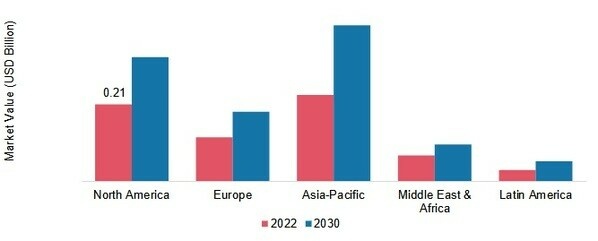 Source: Secondary Research, Primary Research, Market Research Future Database and Analyst Review
Key Players and Competitive Insights
The market rivalry is heavily influenced by a number of variables, including the needs of various industries, geographic location, market leaders and major participants, as well as the skills and production capacities of these organizations. To increase their market share, manufacturers are concentrating on expanding their product lines while also leaning towards sustainable production.
Key Companies in the Ethylene Carbonate Market market include


Industry Developments
In February 2022: Lotte Chemical announced the building of a new factory in Daesan, South Korea, for the production of high-purity organic solvents like ethylene carbonate, which are used in electric vehicle batteries as part of its USD 502 million investment in the sustainable speciality materials industry.
In May 2021: Lotte Chemical, a significant chemical firm with headquarters in South Korea, said that it would produce electrolyte organic solvents at high-purity ethylene oxide facilities in order to manufacture ingredients for electric vehicle batteries. Over 30% of electrolytes are made up of organic solvents; imports are heavily reliant on this region. The firm said that the board has approved spending 210 billion won, or USD 185 million, to develop a facility that will manufacture organic solvents used in electrolytes such as dimethyl carbonate and ethylene carbonate by the second half of 2023.
Lithium ions are helped by organic solvents to move between the cathode and anode with ease.
In August 2023: Covestro AG announced that it is developing a new process for producing ethylene carbonate from renewable ethylene. The new process is expected to reduce the carbon footprint of ethylene carbonate production by up to 70%. Covestro expects to start commercial production of ethylene carbonate using the new process in 2025.
Future Outlook
Ethylene Carbonate Market Future Outlook
The Ethylene Carbonate Market is projected to grow at a 9.2% CAGR from 2024 to 2035, driven by increasing demand in battery applications and sustainable solvents.
New opportunities lie in:
- Develop advanced battery electrolytes utilizing ethylene carbonate for enhanced performance.
- Innovate eco-friendly production methods to reduce environmental impact and attract green investments.
- Expand applications in pharmaceuticals and cosmetics for niche market penetration.
By 2035, the Ethylene Carbonate Market is poised to achieve substantial growth, reflecting evolving industry dynamics and consumer preferences.
Market Segmentation
Ethylene Carbonate Form Outlook
- Solid
- Liquid
Ethylene Carbonate Regional Outlook
North America
- US
- Canada
Ethylene Carbonate Application Outlook
- Lithium Battery Electrolytes
- Lubricants
- Plasticizers
- Surface Coatings
- Chemical Intermediates
- Fiber Processing Agents Dyes
- Others
Ethylene Carbonate End Use Industry Outlook
- Automotive
- Oil & Gas
- Textile
- Chemical
- Medical
- Personal Care & Hygiene
- Agriculture
- Others
Report Scope
| Report Attribute/Metric | Details |
| Market Size 2024 | USD 0.73 billion |
| Market Size 2025 | USD 0.8 billion |
| Market Size 2034 | USD 1.76 billion |
| Compound Annual Growth Rate (CAGR) | 9.20% (2025-2034) |
| Base Year | 2024 |
| Forecast Period | 2025-2034 |
| Historical Data | 2020-2024 |
| Forecast Units | Value (USD Billion) |
| Report Coverage | Revenue Forecast, Competitive Landscape, Growth Factors, and Trends |
| Segments Covered | Form, Applications, End-Use Industry and Region |
| Geographies Covered | North America, Europe, Asia Pacific, Middle East & Africa, and Latin America |
| Countries Covered | U.S., Canada, Germany, France, UK, Italy, Spain, China, Japan, India, Australia, South Korea, Brazil, Argentina, Mexico, South Africa, Turkey, GCC. |
| Key Companies Profiled | OUCC, Toagosei Co., Ltd, Mitsubishi Chemical Corporation, Zibo Donghai Industries Co., Ltd, ALFA AESAR,BASF SE Huntsman International LLC, Merck KGaA, New Japan Chemical Co., Ltd, Shandong Senjie Cleantech Co., Ltd, PANAX ETEC, Tokyo Chemical Industry Co., Ltd |
| Key Market Opportunities | Introduction of New Products like Lithium-sulfur Batteries |
| Key Market Dynamics | Rising Need for Ethylene Carbonate in the Production of Lithium-ion Battery Electrolytes |
Market Highlights
Author
Latest Comments
John Doe
This is a great article! Really helped me understand the topic better.
Posted on July 23, 2025, 10:15
AM
Jane Smith
Thanks for sharing this. I’ve bookmarked it for later reference.
Posted on July 22, 2025, 7:45
PM
FAQs
How much is the Ethylene Carbonate market?
Ethylene Carbonate Market Size was valued at USD 0.56 billion in 2023
What is the growth rate of the Ethylene Carbonate market?
The market is further expected to grow at a CAGR of 9.20%
Which region held the largest market share in the Ethylene Carbonate market?
Asia Pacific had a dominantshare inthe market
Who are the key players in the Ethylene Carbonate market?
OUCC, Toagosei Co., Ltd, Mitsubishi Chemical Corporation, Zibo Donghai Industries Co., Ltd, ALFA AESAR,BASF SE Huntsman International LLC, Merck KGaA, New Japan Chemical Co., Ltd, Shandong Senjie Cleantech Co., Ltd, PANAX ETEC, Tokyo Chemical Industry Co., Ltd
Which end use industry had the largest market share in the Ethylene Carbonate market?
automotive, medical, chemical, and industrial, EC in solid form is frequently used
-
'1 Prologue
-
Market Introduction
- Definition 20
- Scope of the Study 20
- Market Structure 20
-
Market Insights
-
4
-
Research Methodology
- Research Process 24
- Primary Research 25
- Secondary Research 26
- Market Size Estimation 26
- Forecast
-
Model 27
- List Of Assumptions 28
-
Market Dynamics
-
29
- Introduction 29
-
Drivers 30
- Use Of Ethylene Carbonate
-
As An Electrolyte In Lithium-Ion Batteries 30
- Growing Adoption Of Ethylene
-
Carbonate In The Gas Separation Process In The Oil & Gas Industry 31
-
Increasing Demand For Ethylene Carbonate In The Production Of Vinylene Carbonate
-
And Surface Coatings 33
-
Restraints 34
- Volatile Raw Material
-
Restraints 34
-
Prices 34
-
Opportunity 35
- Introduction Of Lithium-Sulfur Batteries
-
Opportunity 35
-
35
-
Trend 36
- Growing Adoption Of Ethylene Carbonate-Modified
-
Trend 36
-
Dispersants As Additives In Engine Oil 36
-
Challenge 36
- Extensive
-
Challenge 36
-
Research On New Battery Technologies 36
-
Market Factor Analysis
- Supply
-
Chain Analysis 38
-
Raw Materials 38
- Ethylene Carbonate Producers
-
Raw Materials 38
-
39
-
Distribution Channel 39
- End-Use Industries 39
-
Distribution Channel 39
-
Porter’s Five Forces Analysis 40
- Threat Of New Entrants 40
-
Threat Of Rivalry 40
-
Threat Of Substitutes 41
- Bargaining Power
-
Threat Of Substitutes 41
-
Of Suppliers 41
- Bargaining Power Of Buyers 41
- Pricing Analysis
-
(2016–2018) 41
-
Global Ethylene Carbonate Market, By Form
- Introduction
-
43
- Solid 44
- Liquid 45
-
Global Ethylene Carbonate Market,
-
By Application
- Introduction 47
- Lithium Battery Electrolytes 49
- Lubricants 50
- Plasticizers 51
- Surface Coatings 52
-
Chemical Intermediates 53
- Fiber Processing Agents 54
- Dyes 55
- Others 56
-
Global Ethylene Carbonate Market, By End-Use Industry
- Introduction 58
- Automotive 60
- Oil & Gas 61
-
Textile 63
- Chemical 64
- Medical 65
- Personal Care &
-
Hygiene 66
- Agriculture 67
- Others 68
-
Global Ethylene Carbonate
-
Market, By Region
- Introduction 69
- North America 74
-
US 77
- Canada 80
-
Europe 83
- Germany 87
-
France 89
-
UK 92
- Italy 95
- Russia 98
-
UK 92
-
Spain 100
-
The Netherlands 103
- Belgium 106
- Poland
-
The Netherlands 103
-
109
- Rest Of Europe 111
-
Asia-Pacific 115
- China
-
118
-
Japan 121
- India 124
- South Korea 127
-
Japan 121
-
Australia And New Zealand 129
-
Malaysia 132
- Indonesia 135
- Rest Of Asia-Pacific 138
-
Latin America 141
- Mexico
-
Malaysia 132
-
144
-
Brazil 147
- Argentina 150
- Rest Of Latin America
-
Brazil 147
-
152
-
Middle East & Africa 156
- Turkey 159
- UAE
-
Middle East & Africa 156
-
162
-
Saudi Arabia 165
- Israel 168
- Egypt 170
- Rest Of MIDDLE EAST & AFRICA 173
-
Saudi Arabia 165
-
Competitive Landscape
-
Introduction 177
- Market Strategy Analysis 177
-
Company Profiles
-
BASF SE_x005F_x000B_ 178
- Company Overview 178
- Financial
-
BASF SE_x005F_x000B_ 178
-
Overview 178
-
Products Offered 179
- Key Developments 179
- SWOT Analysis 179
- Key Strategies 179
- Huntsman International
-
Products Offered 179
-
LLC_x005F_x000B_ 180
-
Company Overview 180
- Financial Overview
-
Company Overview 180
-
180
-
Products Offered 180
- Key Developments 181
-
Products Offered 180
-
SWOT Analysis 181
- Key Strategies 181
- Mitsubishi Chemical Corporation_x005F_x000B_
-
182
-
Company Overview 182
- Financial Overview 182
-
Company Overview 182
-
Products Offered 183
-
Key Developments 183
- SWOT Analysis
-
Key Developments 183
-
183
- Key Strategies 183
-
OUCC_x005F_x000B_ 184
- Company
-
Overview 184
-
Financial Overview 184
- Products Offered 185
- Key Developments 185
- SWOT Analysis 185
- Key Strategies
-
Financial Overview 184
-
185
-
Merck KGaA_x005F_x000B_ 186
- Company Overview 186
-
Merck KGaA_x005F_x000B_ 186
-
Financial Overview 186
-
Products Offered 187
- Key Developments
-
Products Offered 187
-
187
-
SWOT Analysis 187
- Key Strategies 187
- New Japan
-
SWOT Analysis 187
-
Chemical Co., Ltd_x005F_x000B_ 188
- Company Overview 188
-
Financial Overview 188
-
Products Offered 189
- Key Developments
-
Products Offered 189
-
189
-
SWOT Analysis 189
- Key Strategies 189
- TOAGOSEI
-
SWOT Analysis 189
-
CO., LTD._x005F_x000B_ 190
-
Company Overview 190
- Financial
-
Company Overview 190
-
Overview 190
-
Products Offered 190
- Key Developments 191
- SWOT Analysis 191
- Key Strategies 191
- Shandong Senjie
-
Products Offered 190
-
Cleantech Co., Ltd. _x005F_x000B_ 192
- Company Overview 192
-
Financial Overview 192
-
Products Offered 192
- Key Developments
-
Products Offered 192
-
192
-
SWOT Analysis 192
- Key Strategies 192
- PANAX
-
SWOT Analysis 192
-
ETEC_x005F_x000B__x005F_x000B_ 193
- Company Overview 193
-
Financial Overview 193
-
Products Offered 193
- Key Developments
-
Products Offered 193
-
193
-
SWOT Analysis 193
- Key Strategies 193
- Zibo
-
SWOT Analysis 193
-
Donghai Industries Co., Ltd 194
-
Company Overview 194
- Financial
-
Company Overview 194
-
Overview 194
-
Products Offered 194
- Key Developments 194
- SWOT Analysis 194
- Key Strategies 194
- Tokyo Chemical
-
Products Offered 194
-
Industry Co., Ltd _x005F_x000B__x005F_x000B_ 195
-
Company Overview 195
- Financial Overview 195
- Products Offered 195
-
Company Overview 195
-
Key Developments 195
-
SWOT Analysis 195
- Key Strategies
-
SWOT Analysis 195
-
195
-
Conclusion
- Key Findings 196
- Industry Trends 196
-
List Of Tables
-
TABLE 1 MARKET SYNOPSIS 19
-
TABLE 2 LIST OF ASSUMPTIONS
-
28
-
TABLE 3 GLOBAL ETHYLENE CARBONATE MARKET PRICING (USD/TON) (2025-2034) 42
-
TABLE 4 GLOBAL ETHYLENE CARBONATE MARKET, BY FORM, 2025-2034 (USD THOUSAND) 43
-
TABLE 5 GLOBAL ETHYLENE CARBONATE MARKET, BY FORM, 2025-2034 (TONS) 44
-
TABLE
-
SOLID: GLOBAL ETHYLENE CARBONATE MARKET, BY REGION, 2025-2034 (USD THOUSAND) 45
-
TABLE 7 SOLID: GLOBAL ETHYLENE CARBONATE MARKET, BY REGION, 2025-2034 (TONS) 45
-
TABLE 8 LIQUID: GLOBAL ETHYLENE CARBONATE MARKET, BY REGION, 2025-2034 (USD THOUSAND)
-
46
-
TABLE 9 LIQUID: GLOBAL ETHYLENE CARBONATE MARKET, BY REGION, 2025-2034 (TONS)
-
TABLE 10 GLOBAL ETHYLENE CARBONATE MARKET, BY APPLICATION, 2025-2034 (USD
-
THOUSAND) 48
-
TABLE 11 GLOBAL ETHYLENE CARBONATE MARKET, BY APPLICATION, 2025-2034
-
(TONS) 49
-
TABLE 12 LITHIUM BATTERY ELECTROLYTES: GLOBAL ETHYLENE CARBONATE
-
MARKET, BY REGION, 2025-2034 (USD THOUSAND) 49
-
TABLE 13 LITHIUM BATTERY ELECTROLYTES:
-
GLOBAL ETHYLENE CARBONATE MARKET, BY REGION, 2025-2034 (TONS) 50
-
TABLE 14 LUBRICANTS:
-
GLOBAL ETHYLENE CARBONATE MARKET, BY REGION, 2025-2034 (USD THOUSAND) 50
-
LUBRICANTS: GLOBAL ETHYLENE CARBONATE MARKET, BY REGION, 2025-2034 (TONS) 51
-
TABLE 16 PLASTICIZERS: GLOBAL ETHYLENE CARBONATE MARKET, BY REGION, 2025-2034
-
(USD THOUSAND) 51
-
TABLE 17 PLASTICIZERS: GLOBAL ETHYLENE CARBONATE MARKET,
-
BY REGION, 2025-2034 (TONS) 52
-
TABLE 18 SURFACE COATINGS: GLOBAL ETHYLENE CARBONATE
-
MARKET, BY REGION, 2025-2034 (USD THOUSAND) 52
-
TABLE 19 SURFACE COATINGS: GLOBAL
-
ETHYLENE CARBONATE MARKET, BY REGION, 2025-2034 (TONS) 53
-
TABLE 20 CHEMICAL
-
INTERMEDIATES: GLOBAL ETHYLENE CARBONATE MARKET, BY REGION, 2025-2034 (USD THOUSAND)
-
53
-
TABLE 21 CHEMICAL INTERMEDIATES: GLOBAL ETHYLENE CARBONATE MARKET, BY REGION,
-
2034 (TONS) 54
-
TABLE 22 FIBER PROCESSING AGENTS: GLOBAL ETHYLENE CARBONATE
-
MARKET, BY REGION, 2025-2034 (USD THOUSAND) 54
-
TABLE 23 FIBER PROCESSING AGENTS:
-
GLOBAL ETHYLENE CARBONATE MARKET, BY REGION, 2025-2034 (TONS) 55
-
TABLE 24 DYES:
-
GLOBAL ETHYLENE CARBONATE MARKET, BY REGION, 2025-2034 (USD THOUSAND) 55
-
DYES: GLOBAL ETHYLENE CARBONATE MARKET, BY REGION, 2025-2034 (TONS) 56
-
OTHERS: GLOBAL ETHYLENE CARBONATE MARKET, BY REGION, 2025-2034 (USD THOUSAND)
-
56
-
TABLE 27 OTHERS: GLOBAL ETHYLENE CARBONATE MARKET, BY REGION, 2025-2034
-
(TONS) 57
-
TABLE 28 GLOBAL ETHYLENE CARBONATE MARKET, BY END-USE INDUSTRY, 2025-2034
-
(USD THOUSAND) 59
-
TABLE 29 GLOBAL ETHYLENE CARBONATE MARKET, BY END-USE INDUSTRY,
-
2034 (TONS) 60
-
TABLE 30 AUTOMOTIVE: GLOBAL ETHYLENE CARBONATE MARKET,
-
BY REGION, 2025-2034 (USD THOUSAND) 61
-
TABLE 31 AUTOMOTIVE: GLOBAL ETHYLENE
-
CARBONATE MARKET, BY REGION, 2025-2034 (TONS) 61
-
TABLE 32 OIL & GAS: GLOBAL
-
ETHYLENE CARBONATE MARKET, BY REGION, 2025-2034 (USD THOUSAND) 62
-
TABLE 33
-
OIL & GAS: GLOBAL ETHYLENE CARBONATE MARKET, BY REGION, 2025-2034 (TONS) 62
-
TABLE 34 TEXTILE: GLOBAL ETHYLENE CARBONATE MARKET, BY REGION, 2025-2034 (USD
-
THOUSAND) 63
-
TABLE 35 TEXTILE: GLOBAL ETHYLENE CARBONATE MARKET, BY REGION,
-
2034 (TONS) 63
-
TABLE 36 CHEMICAL: GLOBAL ETHYLENE CARBONATE MARKET, BY
-
REGION, 2025-2034 (USD THOUSAND) 64
-
TABLE 37 CHEMICAL: GLOBAL ETHYLENE CARBONATE
-
MARKET, BY REGION, 2025-2034 (TONS) 64
-
TABLE 38 MEDICAL: GLOBAL ETHYLENE CARBONATE
-
MARKET, BY REGION, 2025-2034 (USD THOUSAND) 65
-
TABLE 39 MEDICAL: GLOBAL ETHYLENE
-
CARBONATE MARKET, BY REGION, 2025-2034 (TONS) 65
-
TABLE 40 PERSONAL CARE &
-
HYGIENE: GLOBAL ETHYLENE CARBONATE MARKET, BY REGION, 2025-2034 (USD THOUSAND) 66
-
TABLE 41 PERSONAL CARE & HYGIENE: GLOBAL ETHYLENE CARBONATE MARKET, BY REGION,
-
2034 (TONS) 66
-
TABLE 42 AGRICULTURE: GLOBAL ETHYLENE CARBONATE MARKET,
-
BY REGION, 2025-2034 (USD THOUSAND) 67
-
TABLE 43 AGRICULTURE: GLOBAL ETHYLENE
-
CARBONATE MARKET, BY REGION, 2025-2034 (TONS) 67
-
TABLE 44 OTHERS: GLOBAL ETHYLENE
-
CARBONATE MARKET, BY REGION, 2025-2034 (USD THOUSAND) 68
-
TABLE 45 OTHERS: GLOBAL
-
ETHYLENE CARBONATE MARKET, BY REGION, 2025-2034 (TONS) 68
-
TABLE 46 GLOBAL ETHYLENE
-
CARBONATE MARKET, BY REGION, 2025-2034 (USD THOUSAND) 70
-
TABLE 47 GLOBAL ETHYLENE
-
CARBONATE MARKET, BY REGION, 2025-2034 (TONS) 71
-
TABLE 48 GLOBAL ETHYLENE CARBONATE
-
MARKET, BY FORM, 2025-2034 (USD THOUSAND) 71
-
TABLE 49 GLOBAL ETHYLENE CARBONATE
-
MARKET, BY FORM, 2025-2034 (TONS) 71
-
TABLE 50 GLOBAL ETHYLENE CARBONATE MARKET,
-
BY APPLICATION, 2025-2034 (USD THOUSAND) 72
-
TABLE 51 GLOBAL ETHYLENE CARBONATE
-
MARKET, BY APPLICATION, 2025-2034 (TONS) 72
-
TABLE 52 GLOBAL ETHYLENE CARBONATE
-
MARKET, BY END-USE INDUSTRY, 2025-2034 (USD THOUSAND) 73
-
TABLE 53 GLOBAL ETHYLENE
-
CARBONATE MARKET, BY END-USE INDUSTRY, 2025-2034 (TONS) 73
-
TABLE 54 NORTH AMERICA:
-
ETHYLENE CARBONATE MARKET, BY COUNTRY, 2025-2034 (USD THOUSAND) 74
-
TABLE 55
-
NORTH AMERICA: ETHYLENE CARBONATE MARKET, BY COUNTRY, 2025-2034 (TONS) 74
-
NORTH AMERICA: ETHYLENE CARBONATE MARKET, BY FORM, 2025-2034 (USD THOUSAND) 74
-
TABLE 57 NORTH AMERICA: ETHYLENE CARBONATE MARKET, BY FORM, 2025-2034 (TONS) 75
-
TABLE 58 NORTH AMERICA: ETHYLENE CARBONATE MARKET, BY APPLICATION, 2025-2034 (USD
-
THOUSAND) 75
-
TABLE 59 NORTH AMERICA: ETHYLENE CARBONATE MARKET, BY APPLICATION,
-
2034 (TONS) 76
-
TABLE 60 NORTH AMERICA: ETHYLENE CARBONATE MARKET, BY END-USE
-
INDUSTRY, 2025-2034 (USD THOUSAND) 76
-
TABLE 61 NORTH AMERICA: ETHYLENE CARBONATE
-
MARKET, BY END-USE INDUSTRY, 2025-2034 (TONS) 77
-
TABLE 62 US: ETHYLENE CARBONATE
-
MARKET, BY FORM, 2025-2034 (USD THOUSAND) 77
-
TABLE 63 US: ETHYLENE CARBONATE
-
MARKET, BY FORM, 2025-2034 (TONS) 78
-
TABLE 64 US: ETHYLENE CARBONATE MARKET,
-
BY APPLICATION, 2025-2034 (USD THOUSAND) 78
-
TABLE 65 US: ETHYLENE CARBONATE
-
MARKET, BY APPLICATION, 2025-2034 (TONS) 79
-
TABLE 66 US: ETHYLENE CARBONATE
-
MARKET, BY END-USE INDUSTRY, 2025-2034 (USD THOUSAND) 79
-
TABLE 67 US: ETHYLENE
-
CARBONATE MARKET, BY END-USE INDUSTRY, 2025-2034 (TONS) 80
-
TABLE 68 CANADA:
-
ETHYLENE CARBONATE MARKET, BY FORM, 2025-2034 (USD THOUSAND) 80
-
TABLE 69 CANADA:
-
ETHYLENE CARBONATE MARKET, BY FORM, 2025-2034 (TONS) 80
-
TABLE 70 CANADA: ETHYLENE
-
CARBONATE MARKET, BY APPLICATION, 2025-2034 (USD THOUSAND) 81
-
TABLE 71 CANADA:
-
ETHYLENE CARBONATE MARKET, BY APPLICATION, 2025-2034 (TONS) 81
-
TABLE 72 CANADA:
-
ETHYLENE CARBONATE MARKET, BY END-USE INDUSTRY, 2025-2034 (USD THOUSAND) 82
-
CANADA: ETHYLENE CARBONATE MARKET, BY END-USE INDUSTRY, 2025-2034 (TONS) 82
-
TABLE 74 EUROPE: ETHYLENE CARBONATE MARKET, BY COUNTRY, 2025-2034 (USD THOUSAND)
-
83
-
TABLE 75 EUROPE: ETHYLENE CARBONATE MARKET, BY COUNTRY, 2025-2034 (TONS)
-
TABLE 76 EUROPE: ETHYLENE CARBONATE MARKET, BY FORM, 2025-2034 (USD THOUSAND)
-
84
-
TABLE 77 EUROPE: ETHYLENE CARBONATE MARKET, BY FORM, 2025-2034 (TONS) 84
-
TABLE 78 EUROPE: ETHYLENE CARBONATE MARKET, BY APPLICATION, 2025-2034 (USD THOUSAND)
-
85
-
TABLE 79 EUROPE: ETHYLENE CARBONATE MARKET, BY APPLICATION, 2025-2034 (TONS)
-
TABLE 80 EUROPE: ETHYLENE CARBONATE MARKET, BY END-USE INDUSTRY, 2025-2034
-
(USD THOUSAND) 86
-
TABLE 81 EUROPE: ETHYLENE CARBONATE MARKET, BY END-USE INDUSTRY,
-
2034 (TONS) 86
-
TABLE 82 GERMANY: ETHYLENE CARBONATE MARKET, BY FORM, 2025-2034
-
(USD THOUSAND) 87
-
TABLE 83 GERMANY: ETHYLENE CARBONATE MARKET, BY FORM, 2025-2034
-
(TONS) 87
-
TABLE 84 GERMANY: ETHYLENE CARBONATE MARKET, BY APPLICATION, 2025-2034
-
TABLE 85 GERMANY: ETHYLENE CARBONATE MARKET, BY APPLICATION,
-
2034 (TONS) 88
-
TABLE 86 GERMANY: ETHYLENE CARBONATE MARKET, BY END-USE
-
INDUSTRY, 2025-2034 (USD THOUSAND) 88
-
TABLE 87 GERMANY: ETHYLENE CARBONATE
-
MARKET, BY END-USE INDUSTRY, 2025-2034 (TONS) 89
-
TABLE 88 FRANCE: ETHYLENE
-
CARBONATE MARKET, BY FORM, 2025-2034 (USD THOUSAND) 89
-
TABLE 89 FRANCE: ETHYLENE
-
CARBONATE MARKET, BY FORM, 2025-2034 (TONS) 90
-
TABLE 90 FRANCE: ETHYLENE CARBONATE
-
MARKET, BY APPLICATION, 2025-2034 (USD THOUSAND) 90
-
TABLE 91 FRANCE: ETHYLENE
-
CARBONATE MARKET, BY APPLICATION, 2025-2034 (TONS) 91
-
TABLE 92 FRANCE: ETHYLENE
-
CARBONATE MARKET, BY END-USE INDUSTRY, 2025-2034 (USD THOUSAND) 91
-
TABLE 93
-
FRANCE: ETHYLENE CARBONATE MARKET, BY END-USE INDUSTRY, 2025-2034 (TONS) 92
-
UK: ETHYLENE CARBONATE MARKET, BY FORM, 2025-2034 (USD THOUSAND) 92
-
UK: ETHYLENE CARBONATE MARKET, BY FORM, 2025-2034 (TONS) 92
-
TABLE 96 UK:
-
ETHYLENE CARBONATE MARKET, BY APPLICATION, 2025-2034 (USD THOUSAND) 93
-
UK: ETHYLENE CARBONATE MARKET, BY APPLICATION, 2025-2034 (TONS) 93
-
UK: ETHYLENE CARBONATE MARKET, BY END-USE INDUSTRY, 2025-2034 (USD THOUSAND)
-
94
-
TABLE 99 UK: ETHYLENE CARBONATE MARKET, BY END-USE INDUSTRY, 2025-2034 (TONS)
-
TABLE 100 ITALY: ETHYLENE CARBONATE MARKET, BY FORM, 2025-2034 (USD THOUSAND)
-
95
-
TABLE 101 ITALY: ETHYLENE CARBONATE MARKET, BY FORM, 2025-2034 (TONS) 95
-
TABLE 102 ITALY: ETHYLENE CARBONATE MARKET, BY APPLICATION, 2025-2034 (USD THOUSAND)
-
96
-
TABLE 103 ITALY: ETHYLENE CARBONATE MARKET, BY APPLICATION, 2025-2034 (TONS)
-
TABLE 104 ITALY: ETHYLENE CARBONATE MARKET, BY END-USE INDUSTRY, 2025-2034
-
(USD THOUSAND) 97
-
TABLE 105 ITALY: ETHYLENE CARBONATE MARKET, BY END-USE INDUSTRY,
-
2034 (TONS) 97
-
TABLE 106 RUSSIA: ETHYLENE CARBONATE MARKET, BY FORM, 2025-2034
-
(USD THOUSAND) 98
-
TABLE 107 RUSSIA: ETHYLENE CARBONATE MARKET, BY FORM, 2025-2034
-
(TONS) 98
-
TABLE 108 RUSSIA: ETHYLENE CARBONATE MARKET, BY APPLICATION, 2025-2034
-
TABLE 109 RUSSIA: ETHYLENE CARBONATE MARKET, BY APPLICATION,
-
2034 (TONS) 99
-
TABLE 110 RUSSIA: ETHYLENE CARBONATE MARKET, BY END-USE
-
INDUSTRY, 2025-2034 (USD THOUSAND) 99
-
TABLE 111 RUSSIA: ETHYLENE CARBONATE
-
MARKET, BY END-USE INDUSTRY, 2025-2034 (TONS) 100
-
TABLE 112 SPAIN: ETHYLENE
-
CARBONATE MARKET, BY FORM, 2025-2034 (USD THOUSAND) 100
-
TABLE 113 SPAIN: ETHYLENE
-
CARBONATE MARKET, BY FORM, 2025-2034 (TONS) 101
-
TABLE 114 SPAIN: ETHYLENE CARBONATE
-
MARKET, BY APPLICATION, 2025-2034 (USD THOUSAND) 101
-
TABLE 115 SPAIN: ETHYLENE
-
CARBONATE MARKET, BY APPLICATION, 2025-2034 (TONS) 102
-
TABLE 116 SPAIN: ETHYLENE
-
CARBONATE MARKET, BY END-USE INDUSTRY, 2025-2034 (USD THOUSAND) 102
-
TABLE 117
-
SPAIN: ETHYLENE CARBONATE MARKET, BY END-USE INDUSTRY, 2025-2034 (TONS) 103
-
THE NETHERLANDS: ETHYLENE CARBONATE MARKET, BY FORM, 2025-2034 (USD THOUSAND)
-
103
-
TABLE 119 THE NETHERLANDS: ETHYLENE CARBONATE MARKET, BY FORM, 2025-2034
-
(TONS) 103
-
TABLE 120 THE NETHERLANDS: ETHYLENE CARBONATE MARKET, BY APPLICATION,
-
2034 (USD THOUSAND) 104
-
TABLE 121 THE NETHERLANDS: ETHYLENE CARBONATE
-
MARKET, BY APPLICATION, 2025-2034 (TONS) 104
-
TABLE 122 THE NETHERLANDS: ETHYLENE
-
CARBONATE MARKET, BY END-USE INDUSTRY, 2025-2034 (USD THOUSAND) 105
-
TABLE 123
-
THE NETHERLANDS: ETHYLENE CARBONATE MARKET, BY END-USE INDUSTRY, 2025-2034 (TONS)
-
105
-
TABLE 124 BELGIUM: ETHYLENE CARBONATE MARKET, BY FORM, 2025-2034 (USD THOUSAND)
-
106
-
TABLE 125 BELGIUM: ETHYLENE CARBONATE MARKET, BY FORM, 2025-2034 (TONS)
-
TABLE 126 BELGIUM: ETHYLENE CARBONATE MARKET, BY APPLICATION, 2025-2034
-
(USD THOUSAND) 107
-
TABLE 127 BELGIUM: ETHYLENE CARBONATE MARKET, BY APPLICATION,
-
2034 (TONS) 107
-
TABLE 128 BELGIUM: ETHYLENE CARBONATE MARKET, BY END-USE
-
INDUSTRY, 2025-2034 (USD THOUSAND) 108
-
TABLE 129 BELGIUM: ETHYLENE CARBONATE
-
MARKET, BY END-USE INDUSTRY, 2025-2034 (TONS) 108
-
TABLE 130 POLAND: ETHYLENE
-
CARBONATE MARKET, BY FORM, 2025-2034 (USD THOUSAND) 109
-
TABLE 131 POLAND: ETHYLENE
-
CARBONATE MARKET, BY FORM, 2025-2034 (TONS) 109
-
TABLE 132 POLAND: ETHYLENE
-
CARBONATE MARKET, BY APPLICATION, 2025-2034 (USD THOUSAND) 109
-
TABLE 133 POLAND:
-
ETHYLENE CARBONATE MARKET, BY APPLICATION, 2025-2034 (TONS) 110
-
TABLE 134 POLAND:
-
ETHYLENE CARBONATE MARKET, BY END-USE INDUSTRY, 2025-2034 (USD THOUSAND) 110
-
TABLE 135 POLAND: ETHYLENE CARBONATE MARKET, BY END-USE INDUSTRY, 2025-2034 (TONS)
-
111
-
TABLE 136 REST OF EUROPE: ETHYLENE CARBONATE MARKET, BY FORM, 2025-2034
-
(USD THOUSAND) 111
-
TABLE 137 REST OF EUROPE: ETHYLENE CARBONATE MARKET, BY
-
FORM, 2025-2034 (TONS) 112
-
TABLE 138 REST OF EUROPE: ETHYLENE CARBONATE MARKET,
-
BY APPLICATION, 2025-2034 (USD THOUSAND) 112
-
TABLE 139 REST OF EUROPE: ETHYLENE
-
CARBONATE MARKET, BY APPLICATION, 2025-2034 (TONS) 113
-
TABLE 140 REST OF EUROPE:
-
ETHYLENE CARBONATE MARKET, BY END-USE INDUSTRY, 2025-2034 (USD THOUSAND) 113
-
TABLE 141 REST OF EUROPE: ETHYLENE CARBONATE MARKET, BY END-USE INDUSTRY, 2025-2034
-
(TONS) 114
-
TABLE 142 ASIA-PACIFIC: ETHYLENE CARBONATE MARKET, BY COUNTRY, 2025-2034
-
(USD THOUSAND) 115
-
TABLE 143 ASIA-PACIFIC: ETHYLENE CARBONATE MARKET, BY COUNTRY,
-
2034 (TONS) 115
-
TABLE 144 ASIA-PACIFIC: ETHYLENE CARBONATE MARKET, BY
-
FORM, 2025-2034 (USD THOUSAND) 116
-
TABLE 145 ASIA-PACIFIC: ETHYLENE CARBONATE
-
MARKET, BY FORM, 2025-2034 (TONS) 116
-
TABLE 146 ASIA-PACIFIC: ETHYLENE CARBONATE
-
MARKET, BY APPLICATION, 2025-2034 (USD THOUSAND) 116
-
TABLE 147 ASIA-PACIFIC:
-
ETHYLENE CARBONATE MARKET, BY APPLICATION, 2025-2034 (TONS) 117
-
TABLE 148 ASIA-PACIFIC:
-
ETHYLENE CARBONATE MARKET, BY END-USE INDUSTRY, 2025-2034 (USD THOUSAND) 117
-
TABLE 149 ASIA-PACIFIC: ETHYLENE CARBONATE MARKET, BY END-USE INDUSTRY, 2025-2034
-
(TONS) 118
-
TABLE 150 CHINA: ETHYLENE CARBONATE MARKET, BY FORM, 2025-2034 (USD
-
THOUSAND) 118
-
TABLE 151 CHINA: ETHYLENE CARBONATE MARKET, BY FORM, 2025-2034
-
(TONS) 119
-
TABLE 152 CHINA: ETHYLENE CARBONATE MARKET, BY APPLICATION, 2025-2034
-
(USD THOUSAND) 119
-
TABLE 153 CHINA: ETHYLENE CARBONATE MARKET, BY APPLICATION,
-
2034 (TONS) 120
-
TABLE 154 CHINA: ETHYLENE CARBONATE MARKET, BY END-USE
-
INDUSTRY, 2025-2034 (USD THOUSAND) 120
-
TABLE 155 CHINA: ETHYLENE CARBONATE
-
MARKET, BY END-USE INDUSTRY, 2025-2034 (TONS) 121
-
TABLE 156 JAPAN: ETHYLENE
-
CARBONATE MARKET, BY FORM, 2025-2034 (USD THOUSAND) 121
-
TABLE 157 JAPAN: ETHYLENE
-
CARBONATE MARKET, BY FORM, 2025-2034 (TONS) 121
-
TABLE 158 JAPAN: ETHYLENE CARBONATE
-
MARKET, BY APPLICATION, 2025-2034 (USD THOUSAND) 122
-
TABLE 159 JAPAN: ETHYLENE
-
CARBONATE MARKET, BY APPLICATION, 2025-2034 (TONS) 122
-
TABLE 160 JAPAN: ETHYLENE
-
CARBONATE MARKET, BY END-USE INDUSTRY, 2025-2034 (USD THOUSAND) 123
-
TABLE 161
-
JAPAN: ETHYLENE CARBONATE MARKET, BY END-USE INDUSTRY, 2025-2034 (TONS) 123
-
INDIA: ETHYLENE CARBONATE MARKET, BY FORM, 2025-2034 (USD THOUSAND) 124
-
INDIA: ETHYLENE CARBONATE MARKET, BY FORM, 2025-2034 (TONS) 124
-
TABLE 164
-
INDIA: ETHYLENE CARBONATE MARKET, BY APPLICATION, 2025-2034 (USD THOUSAND) 125
-
TABLE 165 INDIA: ETHYLENE CARBONATE MARKET, BY APPLICATION, 2025-2034 (TONS) 125
-
TABLE 166 INDIA: ETHYLENE CARBONATE MARKET, BY END-USE INDUSTRY, 2025-2034 (USD
-
THOUSAND) 126
-
TABLE 167 INDIA: ETHYLENE CARBONATE MARKET, BY END-USE INDUSTRY,
-
2034 (TONS) 126
-
TABLE 168 SOUTH KOREA: ETHYLENE CARBONATE MARKET, BY FORM,
-
2034 (USD THOUSAND) 127
-
TABLE 169 SOUTH KOREA: ETHYLENE CARBONATE MARKET,
-
BY FORM, 2025-2034 (TONS) 127
-
TABLE 170 SOUTH KOREA: ETHYLENE CARBONATE MARKET,
-
BY APPLICATION, 2025-2034 (USD THOUSAND) 127
-
TABLE 171 SOUTH KOREA: ETHYLENE
-
CARBONATE MARKET, BY APPLICATION, 2025-2034 (TONS) 128
-
TABLE 172 SOUTH KOREA:
-
ETHYLENE CARBONATE MARKET, BY END-USE INDUSTRY, 2025-2034 (USD THOUSAND) 128
-
TABLE 173 SOUTH KOREA: ETHYLENE CARBONATE MARKET, BY END-USE INDUSTRY, 2025-2034
-
(TONS) 129
-
TABLE 174 AUSTRALIA AND NEW ZEALAND: ETHYLENE CARBONATE MARKET,
-
BY FORM, 2025-2034 (USD THOUSAND) 129
-
TABLE 175 AUSTRALIA AND NEW ZEALAND:
-
ETHYLENE CARBONATE MARKET, BY FORM, 2025-2034 (TONS) 130
-
TABLE 176 AUSTRALIA
-
AND NEW ZEALAND: ETHYLENE CARBONATE MARKET, BY APPLICATION, 2025-2034 (USD THOUSAND)
-
130
-
TABLE 177 AUSTRALIA AND NEW ZEALAND: ETHYLENE CARBONATE MARKET, BY APPLICATION,
-
2034 (TONS) 131
-
TABLE 178 AUSTRALIA AND NEW ZEALAND: ETHYLENE CARBONATE
-
MARKET, BY END-USE INDUSTRY, 2025-2034 (USD THOUSAND) 131
-
TABLE 179 AUSTRALIA
-
AND NEW ZEALAND: ETHYLENE CARBONATE MARKET, BY END-USE INDUSTRY, 2025-2034 (TONS)
-
132
-
TABLE 180 MALAYSIA: ETHYLENE CARBONATE MARKET, BY FORM, 2025-2034 (USD
-
THOUSAND) 132
-
TABLE 181 MALAYSIA: ETHYLENE CARBONATE MARKET, BY FORM, 2025-2034
-
(TONS) 132
-
TABLE 182 MALAYSIA: ETHYLENE CARBONATE MARKET, BY APPLICATION, 2025-2034
-
(USD THOUSAND) 133
-
TABLE 183 MALAYSIA: ETHYLENE CARBONATE MARKET, BY APPLICATION,
-
2034 (TONS) 133
-
TABLE 184 MALAYSIA: ETHYLENE CARBONATE MARKET, BY END-USE
-
INDUSTRY, 2025-2034 (USD THOUSAND) 134
-
TABLE 185 MALAYSIA: ETHYLENE CARBONATE
-
MARKET, BY END-USE INDUSTRY, 2025-2034 (TONS) 134
-
TABLE 186 INDONESIA: ETHYLENE
-
CARBONATE MARKET, BY FORM, 2025-2034 (USD THOUSAND) 135
-
TABLE 187 INDONESIA:
-
ETHYLENE CARBONATE MARKET, BY FORM, 2025-2034 (TONS) 135
-
TABLE 188 INDONESIA:
-
ETHYLENE CARBONATE MARKET, BY APPLICATION, 2025-2034 (USD THOUSAND) 136
-
INDONESIA: ETHYLENE CARBONATE MARKET, BY APPLICATION, 2025-2034 (TONS) 136
-
TABLE 190 INDONESIA: ETHYLENE CARBONATE MARKET, BY END-USE INDUSTRY, 2025-2034
-
(USD THOUSAND) 137
-
TABLE 191 INDONESIA: ETHYLENE CARBONATE MARKET, BY END-USE
-
INDUSTRY, 2025-2034 (TONS) 137
-
TABLE 192 REST OF ASIA-PACIFIC: ETHYLENE CARBONATE
-
MARKET, BY FORM, 2025-2034 (USD THOUSAND) 138
-
TABLE 193 REST OF ASIA-PACIFIC:
-
ETHYLENE CARBONATE MARKET, BY FORM, 2025-2034 (TONS) 138
-
TABLE 194 REST OF
-
ASIA-PACIFIC: ETHYLENE CARBONATE MARKET, BY APPLICATION, 2025-2034 (USD THOUSAND)
-
138
-
TABLE 195 REST OF ASIA-PACIFIC: ETHYLENE CARBONATE MARKET, BY APPLICATION,
-
2034 (TONS) 139
-
TABLE 196 REST OF ASIA-PACIFIC: ETHYLENE CARBONATE MARKET,
-
BY END-USE INDUSTRY, 2025-2034 (USD THOUSAND) 139
-
TABLE 197 REST OF ASIA-PACIFIC:
-
ETHYLENE CARBONATE MARKET, BY END-USE INDUSTRY, 2025-2034 (TONS) 140
-
LATIN AMERICA: ETHYLENE CARBONATE MARKET, BY COUNTRY, 2025-2034 (USD THOUSAND)
-
141
-
TABLE 199 LATIN AMERICA: ETHYLENE CARBONATE MARKET, BY COUNTRY, 2025-2034
-
(TONS) 141
-
TABLE 200 LATIN AMERICA: ETHYLENE CARBONATE MARKET, BY FORM, 2025-2034
-
(USD THOUSAND) 141
-
TABLE 201 LATIN AMERICA: ETHYLENE CARBONATE MARKET, BY FORM,
-
2034 (TONS) 142
-
TABLE 202 LATIN AMERICA: ETHYLENE CARBONATE MARKET, BY
-
APPLICATION, 2025-2034 (USD THOUSAND) 142
-
TABLE 203 LATIN AMERICA: ETHYLENE
-
CARBONATE MARKET, BY APPLICATION, 2025-2034 (TONS) 143
-
TABLE 204 LATIN AMERICA:
-
ETHYLENE CARBONATE MARKET, BY END-USE INDUSTRY, 2025-2034 (USD THOUSAND) 143
-
TABLE 205 LATIN AMERICA: ETHYLENE CARBONATE MARKET, BY END-USE INDUSTRY, 2025-2034
-
(TONS) 144
-
TABLE 206 MEXICO: ETHYLENE CARBONATE MARKET, BY FORM, 2025-2034
-
(USD THOUSAND) 144
-
TABLE 207 MEXICO: ETHYLENE CARBONATE MARKET, BY FORM, 2025-2034
-
TABLE 208 MEXICO: ETHYLENE CARBONATE MARKET, BY APPLICATION, 2025-2034
-
(USD THOUSAND) 145
-
TABLE 209 MEXICO: ETHYLENE CARBONATE MARKET, BY APPLICATION,
-
2034 (TONS) 145
-
TABLE 210 MEXICO: ETHYLENE CARBONATE MARKET, BY END-USE
-
INDUSTRY, 2025-2034 (USD THOUSAND) 146
-
TABLE 211 MEXICO: ETHYLENE CARBONATE
-
MARKET, BY END-USE INDUSTRY, 2025-2034 (TONS) 146
-
TABLE 212 BRAZIL: ETHYLENE
-
CARBONATE MARKET, BY FORM, 2025-2034 (USD THOUSAND) 147
-
TABLE 213 BRAZIL: ETHYLENE
-
CARBONATE MARKET, BY FORM, 2025-2034 (TONS) 147
-
TABLE 214 BRAZIL: ETHYLENE
-
CARBONATE MARKET, BY APPLICATION, 2025-2034 (USD THOUSAND) 148
-
TABLE 215 BRAZIL:
-
ETHYLENE CARBONATE MARKET, BY APPLICATION, 2025-2034 (TONS) 148
-
TABLE 216 BRAZIL:
-
ETHYLENE CARBONATE MARKET, BY END-USE INDUSTRY, 2025-2034 (USD THOUSAND) 149
-
TABLE 217 BRAZIL: ETHYLENE CARBONATE MARKET, BY END-USE INDUSTRY, 2025-2034 (TONS)
-
149
-
TABLE 218 ARGENTINA: ETHYLENE CARBONATE MARKET, BY FORM, 2025-2034 (USD
-
THOUSAND) 150
-
TABLE 219 ARGENTINA: ETHYLENE CARBONATE MARKET, BY FORM, 2025-2034
-
(TONS) 150
-
TABLE 220 ARGENTINA: ETHYLENE CARBONATE MARKET, BY APPLICATION,
-
2034 (USD THOUSAND) 150
-
TABLE 221 ARGENTINA: ETHYLENE CARBONATE MARKET,
-
BY APPLICATION, 2025-2034 (TONS) 151
-
TABLE 222 ARGENTINA: ETHYLENE CARBONATE
-
MARKET, BY END-USE INDUSTRY, 2025-2034 (USD THOUSAND) 151
-
TABLE 223 ARGENTINA:
-
ETHYLENE CARBONATE MARKET, BY END-USE INDUSTRY, 2025-2034 (TONS) 152
-
REST OF LATIN AMERICA: ETHYLENE CARBONATE MARKET, BY FORM, 2025-2034 (USD THOUSAND)
-
TABLE 225 REST OF LATIN AMERICA: ETHYLENE CARBONATE MARKET, BY FORM, 2025-2034
-
(TONS) 153
-
TABLE 226 REST OF LATIN AMERICA: ETHYLENE CARBONATE MARKET, BY APPLICATION,
-
2034 (USD THOUSAND) 153
-
TABLE 227 REST OF LATIN AMERICA: ETHYLENE CARBONATE
-
MARKET, BY APPLICATION, 2025-2034 (TONS) 154
-
TABLE 228 REST OF LATIN AMERICA:
-
ETHYLENE CARBONATE MARKET, BY END-USE INDUSTRY, 2025-2034 (USD THOUSAND) 154
-
TABLE 229 REST OF LATIN AMERICA: ETHYLENE CARBONATE MARKET, BY END-USE INDUSTRY,
-
2034 (TONS) 155
-
TABLE 230 MIDDLE EAST & AFRICA: ETHYLENE CARBONATE
-
MARKET, BY COUNTRY, 2025-2034 (USD THOUSAND) 156
-
TABLE 231 MIDDLE EAST &
-
AFRICA: ETHYLENE CARBONATE MARKET, BY COUNTRY, 2025-2034 (TONS) 156
-
TABLE 232
-
MIDDLE EAST & AFRICA: ETHYLENE CARBONATE MARKET, BY FORM, 2025-2034 (USD THOUSAND)
-
157
-
TABLE 233 MIDDLE EAST & AFRICA: ETHYLENE CARBONATE MARKET, BY FORM,
-
2034 (TONS) 157
-
TABLE 234 MIDDLE EAST & AFRICA: ETHYLENE CARBONATE
-
MARKET, BY APPLICATION, 2025-2034 (USD THOUSAND) 157
-
TABLE 235 MIDDLE EAST
-
& AFRICA: ETHYLENE CARBONATE MARKET, BY APPLICATION, 2025-2034 (TONS) 158
-
TABLE 236 MIDDLE EAST & AFRICA: ETHYLENE CARBONATE MARKET, BY END-USE INDUSTRY,
-
2034 (USD THOUSAND) 158
-
TABLE 237 MIDDLE EAST & AFRICA: ETHYLENE CARBONATE
-
MARKET, BY END-USE INDUSTRY, 2025-2034 (TONS) 159
-
TABLE 238 TURKEY: ETHYLENE
-
CARBONATE MARKET, BY FORM, 2025-2034 (USD THOUSAND) 159
-
TABLE 239 TURKEY: ETHYLENE
-
CARBONATE MARKET, BY FORM, 2025-2034 (TONS) 160
-
TABLE 240 TURKEY: ETHYLENE
-
CARBONATE MARKET, BY APPLICATION, 2025-2034 (USD THOUSAND) 160
-
TABLE 241 TURKEY:
-
ETHYLENE CARBONATE MARKET, BY APPLICATION, 2025-2034 (TONS) 161
-
TABLE 242 TURKEY:
-
ETHYLENE CARBONATE MARKET, BY END-USE INDUSTRY, 2025-2034 (USD THOUSAND) 161
-
TABLE 243 TURKEY: ETHYLENE CARBONATE MARKET, BY END-USE INDUSTRY, 2025-2034 (TONS)
-
TABLE 244 UAE: ETHYLENE CARBONATE MARKET, BY FORM, 2025-2034 (USD THOUSAND)
-
TABLE 245 UAE: ETHYLENE CARBONATE MARKET, BY FORM, 2025-2034 (TONS) 162
-
TABLE 246 UAE: ETHYLENE CARBONATE MARKET, BY APPLICATION, 2025-2034 (USD THOUSAND)
-
163
-
TABLE 247 UAE: ETHYLENE CARBONATE MARKET, BY APPLICATION, 2025-2034 (TONS)
-
TABLE 248 UAE: ETHYLENE CARBONATE MARKET, BY END-USE INDUSTRY, 2025-2034
-
(USD THOUSAND) 164
-
TABLE 249 UAE: ETHYLENE CARBONATE MARKET, BY END-USE INDUSTRY,
-
2034 (TONS) 164
-
TABLE 250 SAUDI ARABIA: ETHYLENE CARBONATE MARKET, BY
-
FORM, 2025-2034 (USD THOUSAND) 165
-
TABLE 251 SAUDI ARABIA: ETHYLENE CARBONATE
-
MARKET, BY FORM, 2025-2034 (TONS) 165
-
TABLE 252 SAUDI ARABIA: ETHYLENE CARBONATE
-
MARKET, BY APPLICATION, 2025-2034 (USD THOUSAND) 166
-
TABLE 253 SAUDI ARABIA:
-
ETHYLENE CARBONATE MARKET, BY APPLICATION, 2025-2034 (TONS) 166
-
TABLE 254 SAUDI
-
ARABIA: ETHYLENE CARBONATE MARKET, BY END-USE INDUSTRY, 2025-2034 (USD THOUSAND)
-
167
-
TABLE 255 SAUDI ARABIA: ETHYLENE CARBONATE MARKET, BY END-USE INDUSTRY,
-
2034 (TONS) 167
-
TABLE 256 ISRAEL: ETHYLENE CARBONATE MARKET, BY FORM,
-
2034 (USD THOUSAND) 168
-
TABLE 257 ISRAEL: ETHYLENE CARBONATE MARKET, BY
-
FORM, 2025-2034 (TONS) 168
-
TABLE 258 ISRAEL: ETHYLENE CARBONATE MARKET, BY
-
APPLICATION, 2025-2034 (USD THOUSAND) 168
-
TABLE 259 ISRAEL: ETHYLENE CARBONATE
-
MARKET, BY APPLICATION, 2025-2034 (TONS) 169
-
TABLE 260 ISRAEL: ETHYLENE CARBONATE
-
MARKET, BY END-USE INDUSTRY, 2025-2034 (USD THOUSAND) 169
-
TABLE 261 ISRAEL:
-
ETHYLENE CARBONATE MARKET, BY END-USE INDUSTRY, 2025-2034 (TONS) 170
-
EGYPT: ETHYLENE CARBONATE MARKET, BY FORM, 2025-2034 (USD THOUSAND) 170
-
EGYPT: ETHYLENE CARBONATE MARKET, BY FORM, 2025-2034 (TONS) 171
-
TABLE 264
-
EGYPT: ETHYLENE CARBONATE MARKET, BY APPLICATION, 2025-2034 (USD THOUSAND) 171
-
TABLE 265 EGYPT: ETHYLENE CARBONATE MARKET, BY APPLICATION, 2025-2034 (TONS) 172
-
TABLE 266 EGYPT: ETHYLENE CARBONATE MARKET, BY END-USE INDUSTRY, 2025-2034 (USD
-
THOUSAND) 172
-
TABLE 267 EGYPT: ETHYLENE CARBONATE MARKET, BY END-USE INDUSTRY,
-
2034 (TONS) 173
-
TABLE 268 REST OF MIDDLE EAST & AFRICA: ETHYLENE CARBONATE
-
MARKET, BY FORM, 2025-2034 (USD THOUSAND) 173
-
TABLE 269 REST OF MIDDLE EAST
-
& AFRICA: ETHYLENE CARBONATE MARKET, BY FORM, 2025-2034 (TONS) 173
-
REST OF MIDDLE EAST & AFRICA: ETHYLENE CARBONATE MARKET, BY APPLICATION,
-
2034 (USD THOUSAND) 174
-
TABLE 271 REST OF MIDDLE EAST & AFRICA: ETHYLENE
-
CARBONATE MARKET, BY APPLICATION, 2025-2034 (TONS) 174
-
TABLE 272 REST OF MIDDLE
-
EAST & AFRICA: ETHYLENE CARBONATE MARKET, BY END-USE INDUSTRY, 2025-2034 (USD
-
THOUSAND) 175
-
TABLE 273 REST OF MIDDLE EAST & AFRICA: ETHYLENE CARBONATE
-
MARKET, BY END-USE INDUSTRY, 2025-2034 (TONS) 175
-
TABLE 274 KEY DEVELOPMENTS
-
OVERVIEW 177
-
-
List Of Figures
-
FIGURE 1 GLOBAL ETHYLENE CARBONATE
-
MARKET: MARKET STRUCTURE 20
-
FIGURE 2 NORTH AMERICA MARKET SIZE & MARKET
-
SHARE BY COUNTRY (2025-2034) 21
-
FIGURE 3 EUROPE MARKET SIZE & MARKET SHARE
-
BY COUNTRY (2025-2034) 21
-
FIGURE 4 ASIA-PACIFIC & MARKET SHARE BY COUNTRY
-
(2025-2034) 22
-
FIGURE 5 LATIN AMERICA MARKET SIZE & MARKET SHARE BY COUNTRY
-
FIGURE 6 MIDDLE EAST & AFRICA MARKET SIZE & MARKET SHARE
-
BY COUNTRY (2025-2034) 23
-
FIGURE 7 RESEARCH PROCESS OF MRFR 24
-
FIGURE
-
TOP-DOWN & Bottom-up Approach 27
-
FIGURE 9 MARKET DYNAMICS OVERVIEW 29
-
FIGURE 10 NUMBER OF ELECTRIC CARS IN CIRCULATION (MILLION) 30
-
FIGURE 11 ELECTRIC
-
CAR MARKET SHARE, 2020 31
-
FIGURE 12 PLANNED INVESTMENT IN ENERGY SECTOR BY
-
MIDDLE EAST & AFRICA REGION (2025-2034) 32
-
FIGURE 13 GLOBAL AUTOMOTIVE
-
PRODUCTION (2025-2034) 33
-
FIGURE 14 DRIVERS IMPACT ANALYSIS 34
-
CRUDE OIL PRICE TRENDS FOR PAST 5 YEARS 35
-
FIGURE 16 RESTRAINTS IMPACT ANALYSIS
-
FIGURE 1'
Ethylene Carbonate Market Segmentation
Market Segmentation Overview
- Detailed segmentation data will be available in the full report
- Comprehensive analysis by multiple parameters
- Regional and country-level breakdowns
- Market size forecasts by segment

Free Sample Request
Kindly complete the form below to receive a free sample of this Report
Customer Strories
“I am very pleased with how market segments have been defined in a relevant way for my purposes (such as "Portable Freezers & refrigerators" and "last-mile"). In general the report is well structured. Thanks very much for your efforts.”
Leave a Comment