• Cat-intel
  • MedIntelliX
  • Resources
  • About Us
  • Hero Background
    English
    Chinese
    French
    Japanese
    Korean
    German
    Spanish

    Energy Retrofit Systems Market Size

    ID: MRFR/E&P/10238-HCR
    128 Pages
    Anshula Mandaokar
    October 2025

    Energy Retrofit Systems Market Research Report Information By Product (Envelope, LED Retrofit Lighting, HVAC Retrofit, and Appliances), By Application (Residential and Non-Residential), and By Region (North America, Europe, Asia-Pacific, and Rest of The World) – Global Industry Size, Share, Growth, Trends and Forecast To 2035

    Share:
    Download PDF ×

    We do not share your information with anyone. However, we may send you emails based on your report interest from time to time. You may contact us at any time to opt-out.

    Energy Retrofit Systems Market Infographic
    $ 4,950.0
    $ 5,950.0
    $ 7,250.0

    Energy Retrofit Systems Size

    Energy Retrofit Systems Market Growth Projections and Opportunities

    The energy retrofit systems market is impacted by overall maintainability and natural protection contemplations, which are pushed by the rising acknowledgment of the need to diminish fossil fuel byproducts and energy use. Energy retrofit systems are being used all the more much of the time by state run administrations, organizations, and buyers to further develop the energy proficiency of existing foundation and designs, featuring the market's rising accentuation on supportability.

    The administrative climate altogether affects the energy retrofit systems market, as legislatures across the globe carry out thorough energy proficiency guidelines with an end goal to decrease fossil fuel byproducts and support maintainable strategic policies. This has expanded the interest in energy retrofit arrangements among ventures and organizations, which are currently committed to adjusting their items and administrations to developing ecological guidelines.

    Financial variables, for example, the similar expense viability of retrofitting prior structures as opposed to recently developed energy-effective structures, move the Energy Retrofit Systems Market. Interest in energy retrofit drives is empowered by government appropriations and motivations, as well as the developing quest for financially savvy strategies to upgrade energy proficiency by organizations.

    The energy retrofit systems market is significantly impacted by mechanical progressions, as clever arrangements arise to further develop execution and effectiveness. Retrofit arrangements that integrate smart advancements, information examination, and mechanization increment energy proficiency and give constant checking and control capacities. This is reliable with the patterns of Industry 4.0 and the rising execution of advanced arrangements in different businesses.

    Because of cost decreases and natural advantages, the Energy Retrofit Systems Market extends at a quicker rate during times of expanded development and remodel action. On the other hand, withdrawals in the market might be impacted by financial slumps and a decrease in development.

    Expanding consciousness of limited energy sources and fluctuating energy costs impact the Market, convincing ventures and organizations to put resources into energy-productive answers for a reasonable future.

    Because of the rising accentuation on manageability, administrative structures, and innovative progressions — as legislatures and organizations focus on tending to environmental change and advancing energy effectiveness — the market for energy retrofit systems is expected to grow at a consistent rate.

    Energy Retrofit Systems Market Size Graph

    Market Summary

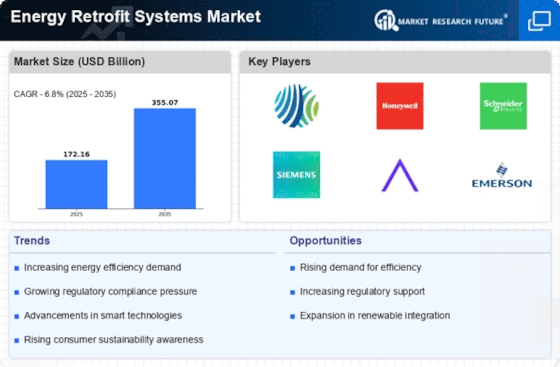
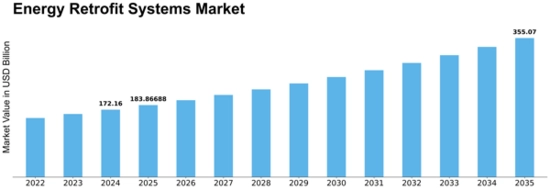
    As per Market Research Future Analysis, the Energy Retrofit Systems Market was valued at 172.16 USD Billion in 2024 and is projected to grow to 355.07 USD Billion by 2035, with a CAGR of 6.80% from 2025 to 2035. The market is driven by increasing concerns over greenhouse gas emissions and stringent regulations aimed at reducing carbon footprints. The demand for HVAC systems and energy-efficient technologies is expected to rise, supported by government incentives and technological advancements. Key players are focusing on R&D and strategic partnerships to enhance their offerings.

    Key Market Trends & Highlights

    The Energy Retrofit Systems Market is witnessing significant growth due to various factors.

    • Market Size in 2024: 172.16 USD Billion
    • Projected Market Size by 2035: 355.07 USD Billion
    • CAGR from 2025 to 2035: 6.80%
    • Largest Regional Market Share in 2022: North America (45.80%)

    Market Size & Forecast

    2024 Market Size USD 172.16 Billion
    2035 Market Size USD 355.07 Billion
    CAGR (2025-2035) 6.80%

    Major Players

    Key players include DAIKIN INDUSTRIES, Ltd., Ameresco, Eaton, AECOM, Johnson Controls, Orion Energy Systems, Inc., Siemens, Trane, Signify Holding, Engie, General Electric, and Schneider Electric.

    Market Trends

    Growing concerns about greenhouse gas (GHG) emissions is driving the market growth

    Growing worries about greenhouse gas (GHG) emissions and strict legislation to reduce carbon footprint are two factors that are anticipated to fuel the rise. It is anticipated that increased HVAC appliance deployment across a variety of businesses would further increase product demand. The typical lifespan of HVAC and lighting technologies is 25 years, after which time they must be replaced. Energy costs for homes and businesses are significantly reduced by retrofitting these systems. Additionally, because of the financial incentives provided by government organizations, it is anticipated that knowledge of the use of renewable energy will continue to rise rapidly.

    Modules for energy retrofit systems require constant technological advancement if they are to function better.

    In addition, the Department of Energy (DOE) has introduced the Commercial Buildings Integration initiative and allocated funds for the Solution to Improve the Energy Efficiency of Small and Medium Buildings. As a result of these efforts, a completed project achieved annual energy savings of 103,166 MMBtu, reduced greenhouse gas (GHG) emissions by 190,298 throughout the lifespan of the renovations, and provided annual utility savings of $4,008 per building.

    The manufacturers and developers of these components allocate a significant portion of their annual budget towards research and development (R&D). The functionality of these systems relies on the seamless integration of all components to meet system requirements. Integrators and assemblers combine all the components to create energy retrofit systems as a comprehensive offering. Companies such as Siemens, General Electric, Schneider Electric, and Johnson Controls are involved in the design and integration of such systems for various applications.

    The ongoing transition towards energy efficiency in buildings is expected to drive substantial growth in the energy retrofit systems market, as stakeholders increasingly prioritize sustainability and cost savings.

    U.S. Department of Energy

    Energy Retrofit Systems Market Market Drivers

    Market Growth Projections

    The Global Energy Retrofit Systems Market Industry is projected to witness robust growth in the coming years. The market is expected to reach 172.2 USD Billion in 2024 and further expand to 355.1 USD Billion by 2035, indicating a strong upward trajectory. The anticipated CAGR of 6.8% from 2025 to 2035 suggests a sustained interest in energy efficiency and retrofitting solutions. This growth is likely driven by various factors, including regulatory changes, technological advancements, and increasing awareness of sustainability. As the market evolves, it will be essential to monitor these trends and their implications for future developments.

    Rising Awareness of Sustainability

    Growing awareness of sustainability and environmental impact is a key driver for the Global Energy Retrofit Systems Market Industry. As individuals and organizations become increasingly conscious of their carbon footprints, there is a heightened demand for energy-efficient solutions. This trend is particularly evident in urban areas where energy consumption is high. For example, cities are investing in retrofitting public buildings to reduce energy use and promote sustainability. This shift towards greener practices is anticipated to boost the market significantly, with a projected CAGR of 6.8% from 2025 to 2035, reflecting a long-term commitment to energy efficiency.

    Economic Incentives and Funding Programs

    Economic incentives and funding programs are playing a crucial role in the expansion of the Global Energy Retrofit Systems Market Industry. Governments and financial institutions are increasingly offering grants, tax credits, and low-interest loans to encourage energy retrofitting. These financial incentives make it more feasible for property owners to invest in energy-efficient upgrades. For example, the U.S. Department of Energy provides various funding opportunities for energy efficiency projects. Such initiatives not only stimulate market growth but also contribute to achieving national energy reduction goals, further solidifying the importance of retrofitting in the energy landscape.

    Increasing Energy Efficiency Regulations

    The Global Energy Retrofit Systems Market Industry is experiencing a surge in demand due to the implementation of stringent energy efficiency regulations. Governments worldwide are mandating higher energy performance standards for buildings, which drives the adoption of retrofit solutions. For instance, the European Union's Energy Performance of Buildings Directive aims to significantly reduce energy consumption in existing structures. This regulatory push is expected to contribute to the market's growth, with projections indicating a market size of 172.2 USD Billion in 2024. As these regulations become more prevalent, the need for energy-efficient retrofitting solutions will likely escalate.

    Technological Advancements in Retrofit Solutions

    Technological advancements are transforming the Global Energy Retrofit Systems Market Industry, enabling more effective and efficient retrofit solutions. Innovations such as smart building technologies, energy management systems, and advanced insulation materials are enhancing the performance of retrofitted buildings. For instance, the integration of IoT devices allows for real-time monitoring and optimization of energy use, leading to substantial savings. As these technologies become more accessible and affordable, they are likely to drive market growth. The anticipated market size of 355.1 USD Billion by 2035 underscores the potential impact of these advancements on energy efficiency.

    Growing Urbanization and Infrastructure Development

    The rapid pace of urbanization and infrastructure development is significantly influencing the Global Energy Retrofit Systems Market Industry. As urban populations expand, the demand for energy-efficient buildings increases, necessitating retrofitting of existing structures. Many cities are focusing on modernizing their infrastructure to meet energy efficiency standards. For instance, initiatives in developing countries aim to retrofit older buildings to accommodate growing populations sustainably. This trend is expected to drive substantial market growth, with the industry poised to reach 172.2 USD Billion in 2024, reflecting the urgent need for energy-efficient solutions in urban settings.

    Market Segment Insights

    Energy Retrofit Systems Product Insights

    The Energy Retrofit Systems Market segmentation, based on product, includes envelope, LED retrofit lighting, HVAC retrofit, and appliances. In 2022, the envelope sector held the greatest market share. Retrofitting the building envelope adds insulation and an air barrier to the walls, improving thermal comfort and lowering drafts. As a result, there is less heat loss, which lowers energy use and lowers carbon footprints for both tenants and owners. By displaying a dedication to environmental sustainability, this will also positively affect public impression.

    Energy Retrofit Systems Application Insights

    The Energy Retrofit Systems Market segmentation, based on application, includes residential and non-residential. In 2022, the non-residential sector held the highest market share. Large-scale HVAC system installation and the outdated technology of conventional systems used in non-residential buildings are both responsible for the expansion. The factories' activities and machinery require enormous quantities of energy to run. Implementing energy retrofit technologies in these sites reduces energy costs and greenhouse gas emissions as a result. Areas that experience harsh winters will benefit the market throughout the forecast period due to their reliance on HVAC and lighting systems.

    Figure 1: Energy Retrofit Systems Market, by Application, 2022 & 2032 (USD Billion)

    Product: Secondary Research, Primary Research, MRFR Database and Analyst Review

    Get more detailed insights about Energy Retrofit Systems Market Research Report—Global Forecast till 2034

    Regional Insights

    By region, the study provides the market insights into North America, Europe, Asia-Pacific and Rest of the World. The North America Energy Retrofit Systems Market dominated this market in 2022 (45.80%). New policies are being implemented by the North American government for the construction of energy infrastructure. Government policy is centered on lowering energy costs and assisting in the reduction of greenhouse gases. Additionally, the creation of new structures increases the need for energy. With the aid of energy retrofit solutions, the energy is used effectively.

    The market for energy retrofit solutions is expanding in North America due to all of these causes. Further, the U.S. Energy Retrofit Systems market held the largest market share, and the Canada Energy Retrofit Systems market was the fastest growing market in the North America region.

    Further, the major countries studied in the market report are The US, Canada, German, France, the UK, Italy, Spain, China, Japan, India, Australia, South Korea, and Brazil.

    Figure 2: Energy Retrofit Systems Market Share By Region 2022 (USD Billion)

    ENERGY RETROFIT SYSTEMS MARKET SHARE BY REGION 2022 (USD Billion)

    Product: Secondary Research, Primary Research, MRFR Database and Analyst Review

    The Asia Pacific Energy Retrofit Systems market is expected to register fastest growth from 2023 to 2032. Market expansion in the Asia-Pacific area is projected to be fueled by lower costs for renewable energy and infrastructure, as well as speedy production of energy modernization systems in the region and adoption of these systems by residential and commercial end users. The regional market for energy retrofits is also being pushed by government regulations and incentives like tax credits and building energy standards.

    Moreover, China’s Energy Retrofit Systems market held the largest market share, and the Indian Energy Retrofit Systems market was the fastest growing market in the Asia-Pacific region.

    Europe Energy Retrofit Systems market accounts for the significant market share. As worries over GHG emissions and strict regulations to reduce carbon footprint increase, product adoption is primarily driving the regional market. Additionally, it is anticipated that the demand for efficient and sustainable energy will rise along with the growing population. Further, the German Energy Retrofit Systems market held the largest market share, and the U.K Energy Retrofit Systems market was the fastest growing market in the European region

    Key Players and Competitive Insights

    Leading market players are investing heavily in research and development in order to expand their product lines, which will help the Energy Efficiency Retrofit market, grow even more. Market participants are also undertaking a variety of strategic activities to expand their global footprint, with important market developments including new product launches, contractual agreements, mergers and acquisitions, higher investments, and collaboration with other organizations. To expand and survive in a more competitive and rising market climate, Energy Retrofit Systems industry must offer cost-effective items.

    Manufacturing locally to minimize operational costs is one of the key business tactics used by manufacturers in the global Energy Retrofit Systems industry to benefit clients and increase the market sector. In recent years, the Energy Retrofit Systems industry has offered some of the most significant advantages to medicine. Major players in the Energy Retrofit Systems market, including DAIKIN INDUSTRIES, Ltd., Ameresco, Eaton, AECOM, Johnson Controls, Orion Energy Systems, Inc., Siemens, Trane, Signify Holding, Engie, General Electric, and Schneider Electric, are attempting to increase market demand by investing in research and development operations.

    Ameresco Inc is a provider of comprehensive renewable energy services, offering energy efficiency, infrastructure upgrades, asset sustainability and renewable energy solutions. They also develop, construct, and operate renewable energy plants, selling electricity, processed landfill gas, heat or cooling produced by their small-scale plants from renewable energy sources. Additionally, Ameresco provides consulting services, enterprise energy management services, and sells solar PV energy products and systems. Their services cater to federal, housing authorities, state and local governments, healthcare and educational institutions, and commercial and industrial customers in North America, the United Kingdom, and Europe.

    Headquartered in Framingham, Massachusetts, Ameresco signed an Energy Savings Performance Contract with Cannon Air Force Base and Defense Logistics Agency Energy in June 2021.

    Orion Energy Systems Inc. designs, manufactures, and implements energy management systems for commercial and industrial customers, offering energy savings and efficiency gains. Their management system includes a high-intensity fluorescent lighting system, InteLite intelligent lighting controls, and Apollo Light Pipe. In December 2020, they signed an agreement to extend their LED lighting and controls retrofit for almost 290 locations.

    Key Companies in the Energy Retrofit Systems Market market include

    Industry Developments

    October 2021 Ameresco, Inc. disclosed that it will collaborate with Wells County, Indiana, on a sizable rehabilitation and modernization project for the jail. Ameresco will renovate the parking lot, upgrade the controls system, renovate and create a new building addition, and repair the jail's current HVAC systems. They will also replace the lighting with LED retrofits both inside and out.

    Future Outlook

    Energy Retrofit Systems Market Future Outlook

    The Energy Retrofit Systems Market is projected to grow at a 6.80% CAGR from 2025 to 2035, driven by increasing energy efficiency regulations and technological advancements.

    New opportunities lie in:

    • Develop smart retrofit solutions integrating IoT for real-time energy monitoring.
    • Expand service offerings to include financing options for energy-efficient upgrades.
    • Leverage government incentives to promote residential energy retrofit programs.

    By 2035, the Energy Retrofit Systems Market is expected to be robust, reflecting substantial growth and innovation.

    Market Segmentation

    Energy Retrofit Systems Product Outlook

    • Envelope
    • LED Retrofit Lighting
    • HVAC Retrofit
    • Appliances

    Energy Retrofit Systems Regional Outlook

    North America
    • US
    • Canada

    Energy Retrofit Systems Application Outlook

    • Residential
    • Non-Residential

    Report Scope

    Report Attribute/Metric Details
    Market Size 2024  172.16 (USD Billion)
    Market Size 2025  183.88 (USD Billion)
    Market Size 2035 355.07 (USD Billion)
    Compound Annual Growth Rate (CAGR) 6.80% (2025 - 2035)
    Report Coverage Revenue Forecast, Competitive Landscape, Growth Factors, and Trends
    Base Year 2024
    Market Forecast Period 2025 - 2035
    Historical Data 2019 - 2023
    Report Coverage Revenue Forecast, Market Competitive Landscape, Growth Factors, and Trends
    Segments Covered Product, Application, and Region
    Geographies Covered North America, Europe, Asia Pacific, and the Rest of the World
    Countries Covered The US, Canada, German, France, UK, Italy, Spain, China, Japan, India, Australia, South Korea, and Brazil
    Key Companies Profiled DAIKIN INDUSTRIES, Ltd., Ameresco, Eaton, AECOM, Johnson Controls, Orion Energy Systems, Inc., Siemens, Trane, Signify Holding, Engie, General Electric, and Schneider Electric
    Key Market Opportunities Rising energy consumption
    Key Market Dynamics Growing concerns about greenhouse gas (GHG) emissions and stringent laws to reduce carbon footprint

    Market Highlights

    Author

    Anshula Mandaokar
    Team Lead - Research

    She holds an experience of about 6+ years in market research and business consulting, working under the spectrum of information communication technology, telecommunications and semiconductor domains. aarti conceptualizes and implements a scalable business strategy and provides strategic leadership to the clients. her expertise lies in market estimation, competitive intelligence, pipeline analysis, customer assessment, etc.

    Leave a Comment

    Latest Comments

    John Doe
    john@example.com

    This is a great article! Really helped me understand the topic better.

    Posted on July 23, 2025, 10:15 AM
    Jane Smith
    jane@domain.com

    Thanks for sharing this. I’ve bookmarked it for later reference.

    Posted on July 22, 2025, 7:45 PM

    FAQs

    How much is the Energy Retrofit Systems market?

    The Energy Retrofit Systems Market size was valued at USD 172.16 Billion in 2024.

    What is the growth rate of the Energy Retrofit Systems market?

    The global market is projected to grow at a CAGR of 6.80% during the forecast period, 2025-2034.

    Which region held the largest market share in the Energy Retrofit Systems market?

    North America had the largest share in the global market

    Who are the key players in the Energy Retrofit Systems market?

    The key players in the market are DAIKIN INDUSTRIES, Ltd., Ameresco, Eaton, AECOM, Johnson Controls, Orion Energy Systems, Inc., Siemens, Trane, Signify Holding, Engie, General Electric, and Schneider Electric

    Which Product led the Energy Retrofit Systems market?

    The envelope dominated the market in 2022.

    Which Application had the largest market share in the Energy Retrofit Systems market?

    The non-residential had the largest share in the global market.

    1. . EXECUTIVE SUMMARY
    2. . MARKET INTRODUCTION
    3. . Definition
    4. . Scope of the Study
    5. . Research Objective
    6. . Assumptions
    7. . Limitations
    8. . RESEARCH METHODOLOGY
    9. . Overview
    10. . Data Mining
    11. . Secondary Research
    12. . Primary Research
    13. . Primary Interviews and Information Gathering Process
    14. . Breakdown of Primary Respondents
    15. . Forecasting Modality
    16. . Market Size Estimation
    17. . Bottom-Up Approach
    18. . Top-Down Approach
    19. . Data Triangulation
    20. . Validation
    21. . MARKET DYNAMICS
    22. . Overview
    23. . Drivers
    24. . Restraints
    25. . Opportunities
    26. . MARKET FACTOR ANALYSIS
    27. . Value Chain Analysis
    28. . Porter’s Five Forces Analysis
    29. . Bargaining Power of Suppliers
    30. . Bargaining Power of Buyers
    31. . Threat of New Entrants
    32. . Threat of Substitutes
    33. . Intensity of Rivalry
    34. . COVID-19 Impact Analysis
    35. . Market Impact Analysis
    36. . Regional Impact
    37. . Opportunity and Threat Analysis
    38. . GLOBAL ENERGY RETROFIT SYSTEMS MARKET, BY PRODUCT
    39. . Overview
    40. . Envelope
    41. . LED Retrofit Lighting
    42. . HVAC Retrofit
    43. . Appliances
    44. . GLOBAL ENERGY RETROFIT SYSTEMS MARKET, BY APPLICATION
    45. . Overview
    46. . Residential
    47. . Non-Residential
    48. . GLOBAL ENERGY RETROFIT SYSTEMS MARKET, BY REGION
    49. . Overview
    50. . North America
    51. . U.S.
    52. . Canada
    53. . Europe
    54. . Germany
    55. . France
    56. . U.K
    57. . Italy
    58. . Spain
    59. . Rest of Europe
    60. . Asia-Pacific
    61. . China
    62. . India
    63. . Japan
    64. . South Korea
    65. . Australia
    66. . Rest of Asia-Pacific
    67. . Rest of the World
    68. . Middle East
    69. . Africa
    70. . Latin America
    71. . COMPETITIVE LANDSCAPE
    72. . Overview
    73. . Competitive Analysis
    74. . Market Share Analysis
    75. . Major Growth Strategy in the Global Energy Retrofit Systems Market,
    76. . Competitive Benchmarking
    77. . Leading Players in Terms of Number of Developments in the Global Energy Retrofit Systems Market,
    78. . Key developments and Growth Strategies
    79. . New PRODUCT Launch/Application Deployment
    80. . Merger & Acquisitions
    81. . Joint Ventures
    82. . Major Players Financial Matrix
    83. . Sales & Operating Income, 2022
    84. . Major Players R&D Expenditure. 2022
    85. . COMPANY PROFILES
    86. . DAIKIN INDUSTRIES, LTD.
    87. . Company Overview
    88. . Financial Overview
    89. . PRODUCTs Offered
    90. . Key Developments
    91. . SWOT Analysis
    92. . Key Strategies
    93. . AMERESCO
    94. . Company Overview
    95. . Financial Overview
    96. . PRODUCTs Offered
    97. . Key Developments
    98. . SWOT Analysis
    99. . Key Strategies
    100. . EATON
    101. . Company Overview
    102. . Financial Overview
    103. . PRODUCTs Offered
    104. . Key Developments
    105. . SWOT Analysis
    106. . Key Strategies
    107. . AECOM
    108. . Company Overview
    109. . Financial Overview
    110. . PRODUCTs Offered
    111. . Key Developments
    112. . SWOT Analysis
    113. . Key Strategies
    114. . JOHNSON CONTROLS
    115. . Company Overview
    116. . Financial Overview
    117. . PRODUCTs Offered
    118. . Key Developments
    119. . SWOT Analysis
    120. . Key Strategies
    121. . ORION ENERGY SYSTEMS, INC.
    122. . Company Overview
    123. . Financial Overview
    124. . PRODUCTs Offered
    125. . Key Developments
    126. . SWOT Analysis
    127. . Key Strategies
    128. . SIEMENS
    129. . Company Overview
    130. . Financial Overview
    131. . PRODUCTs Offered
    132. . Key Developments
    133. . SWOT Analysis
    134. . Key Strategies
    135. . TRANE
    136. . Company Overview
    137. . Financial Overview
    138. . PRODUCTs Offered
    139. . Key Developments
    140. . SWOT Analysis
    141. . Key Strategies
    142. . SIGNIFY HOLDING
    143. . Company Overview
    144. . Financial Overview
    145. . PRODUCTs Offered
    146. . Key Developments
    147. . SWOT Analysis
    148. . Key Strategies
    149. . ENGIE
    150. . Company Overview
    151. . Financial Overview
    152. . PRODUCTs Offered
    153. . Key Developments
    154. . SWOT Analysis
    155. . Key Strategies
    156. . General Electric
    157. . Company Overview
    158. . Financial Overview
    159. . PRODUCTs Offered
    160. . Key Developments
    161. . SWOT Analysis
    162. . Key Strategies
    163. . Schneider Electric
    164. . Company Overview
    165. . Financial Overview
    166. . PRODUCTs Offered
    167. . Key Developments
    168. . SWOT Analysis
    169. . Key Strategies
    170. . APPENDIX
    171. . References
    172. . Related Reports   LIST OF TABLES TABLE 1 GLOBAL ENERGY RETROFIT SYSTEMS MARKET, SYNOPSIS, 2018-2032 TABLE 2 GLOBAL ENERGY RETROFIT SYSTEMS MARKET, ESTIMATES & FORECAST, 2018-2032 (USD BILLION) TABLE 3 GLOBAL ENERGY RETROFIT SYSTEMS MARKET, BY PRODUCT, 2018-2032 (USD BILLION) TABLE 4 GLOBAL ENERGY RETROFIT SYSTEMS MARKET, BY APPLICATION, 2018-2032 (USD BILLION) TABLE 5 NORTH AMERICA ENERGY RETROFIT SYSTEMS MARKET, BY PRODUCT, 2018-2032 (USD BILLION) TABLE 6 NORTH AMERICA ENERGY RETROFIT SYSTEMS MARKET, BY APPLICATION, 2018-2032 (USD BILLION) TABLE 7 NORTH AMERICA ENERGY RETROFIT SYSTEMS MARKET, BY COUNTRY, 2018-2032 (USD BILLION) TABLE 8 U.S. ENERGY RETROFIT SYSTEMS MARKET, BY PRODUCT, 2018-2032 (USD BILLION) TABLE 9 U.S. ENERGY RETROFIT SYSTEMS MARKET, BY APPLICATION, 2018-2032 (USD BILLION) TABLE 10 CANADA ENERGY RETROFIT SYSTEMS MARKET, BY PRODUCT, 2018-2032 (USD BILLION) TABLE 11 CANADA ENERGY RETROFIT SYSTEMS MARKET, BY APPLICATION, 2018-2032 (USD BILLION) TABLE 12 EUROPE ENERGY RETROFIT SYSTEMS MARKET, BY PRODUCT, 2018-2032 (USD BILLION) TABLE 13 EUROPE ENERGY RETROFIT SYSTEMS MARKET, BY APPLICATION, 2018-2032 (USD BILLION) TABLE 14 EUROPE ENERGY RETROFIT SYSTEMS MARKET, BY COUNTRY, 2018-2032 (USD BILLION) TABLE 15 GERMANY ENERGY RETROFIT SYSTEMS MARKET, BY PRODUCT, 2018-2032 (USD BILLION) TABLE 16 GERMANY ENERGY RETROFIT SYSTEMS MARKET, BY APPLICATION, 2018-2032 (USD BILLION) TABLE 17 FRANCE ENERGY RETROFIT SYSTEMS MARKET, BY PRODUCT, 2018-2032 (USD BILLION) TABLE 18 FRANCE ENERGY RETROFIT SYSTEMS MARKET, BY APPLICATION, 2018-2032 (USD BILLION) TABLE 19 ITALY ENERGY RETROFIT SYSTEMS MARKET, BY PRODUCT, 2018-2032 (USD BILLION) TABLE 20 ITALY ENERGY RETROFIT SYSTEMS MARKET, BY APPLICATION, 2018-2032 (USD BILLION) TABLE 21 SPAIN ENERGY RETROFIT SYSTEMS MARKET, BY PRODUCT, 2018-2032 (USD BILLION) TABLE 22 SPAIN ENERGY RETROFIT SYSTEMS MARKET, BY APPLICATION, 2018-2032 (USD BILLION) TABLE 23 U.K ENERGY RETROFIT SYSTEMS MARKET, BY PRODUCT, 2018-2032 (USD BILLION) TABLE 24 U.K ENERGY RETROFIT SYSTEMS MARKET, BY APPLICATION, 2018-2032 (USD BILLION) TABLE 25 REST OF EUROPE ENERGY RETROFIT SYSTEMS MARKET, BY PRODUCT, 2018-2032 (USD BILLION) TABLE 26 REST OF EUROPE ENERGY RETROFIT SYSTEMS MARKET, BY APPLICATION, 2018-2032 (USD BILLION) TABLE 27 ASIA PACIFIC ENERGY RETROFIT SYSTEMS MARKET, BY PRODUCT, 2018-2032 (USD BILLION) TABLE 28 ASIA PACIFIC ENERGY RETROFIT SYSTEMS MARKET, BY APPLICATION, 2018-2032 (USD BILLION) TABLE 29 ASIA PACIFIC ENERGY RETROFIT SYSTEMS MARKET, BY COUNTRY, 2018-2032 (USD BILLION) TABLE 30 JAPAN ENERGY RETROFIT SYSTEMS MARKET, BY PRODUCT, 2018-2032 (USD BILLION) TABLE 31 JAPAN ENERGY RETROFIT SYSTEMS MARKET, BY APPLICATION, 2018-2032 (USD BILLION) TABLE 32 CHINA ENERGY RETROFIT SYSTEMS MARKET, BY PRODUCT, 2018-2032 (USD BILLION) TABLE 33 CHINA ENERGY RETROFIT SYSTEMS MARKET, BY APPLICATION, 2018-2032 (USD BILLION) TABLE 34 INDIA ENERGY RETROFIT SYSTEMS MARKET, BY PRODUCT, 2018-2032 (USD BILLION) TABLE 35 INDIA ENERGY RETROFIT SYSTEMS MARKET, BY APPLICATION, 2018-2032 (USD BILLION) TABLE 36 AUSTRALIA ENERGY RETROFIT SYSTEMS MARKET, BY PRODUCT, 2018-2032 (USD BILLION) TABLE 37 AUSTRALIA ENERGY RETROFIT SYSTEMS MARKET, BY APPLICATION, 2018-2032 (USD BILLION) TABLE 38 SOUTH KOREA ENERGY RETROFIT SYSTEMS MARKET, BY PRODUCT, 2018-2032 (USD BILLION) TABLE 39 SOUTH KOREA ENERGY RETROFIT SYSTEMS MARKET, BY APPLICATION, 2018-2032 (USD BILLION) TABLE 40 REST OF ASIA-PACIFIC ENERGY RETROFIT SYSTEMS MARKET, BY PRODUCT, 2018-2032 (USD BILLION) TABLE 41 REST OF ASIA-PACIFIC ENERGY RETROFIT SYSTEMS MARKET, BY APPLICATION, 2018-2032 (USD BILLION) TABLE 42 REST OF WORLD ENERGY RETROFIT SYSTEMS MARKET, BY PRODUCT, 2018-2032 (USD BILLION) TABLE 43 REST OF WORLD ENERGY RETROFIT SYSTEMS MARKET, BY APPLICATION, 2018-2032 (USD BILLION) TABLE 44 REST OF WORLD ENERGY RETROFIT SYSTEMS MARKET, BY COUNTRY, 2018-2032 (USD BILLION) TABLE 45 MIDDLE EAST ENERGY RETROFIT SYSTEMS MARKET, BY PRODUCT, 2018-2032 (USD BILLION) TABLE 46 MIDDLE EAST ENERGY RETROFIT SYSTEMS MARKET, BY APPLICATION, 2018-2032 (USD BILLION) TABLE 47 AFRICA ENERGY RETROFIT SYSTEMS MARKET, BY PRODUCT, 2018-2032 (USD BILLION) TABLE 48 AFRICA ENERGY RETROFIT SYSTEMS MARKET, BY APPLICATION, 2018-2032 (USD BILLION) TABLE 49 LATIN AMERICA ENERGY RETROFIT SYSTEMS MARKET, BY PRODUCT, 2018-2032 (USD BILLION) TABLE 50 LATIN AMERICA ENERGY RETROFIT SYSTEMS MARKET, BY APPLICATION, 2018-2032 (USD BILLION)   LIST OF FIGURES FIGURE 1 RESEARCH PROCESS FIGURE 2 MARKET STRUCTURE FOR THE GLOBAL ENERGY RETROFIT SYSTEMS MARKET FIGURE 3 MARKET DYNAMICS FOR THE GLOBAL ENERGY RETROFIT SYSTEMS MARKET FIGURE 4 GLOBAL ENERGY RETROFIT SYSTEMS MARKET, SHARE (%), BY PRODUCT, 2022 FIGURE 5 GLOBAL ENERGY RETROFIT SYSTEMS MARKET, SHARE (%), BY APPLICATION, 2022 FIGURE 6 GLOBAL ENERGY RETROFIT SYSTEMS MARKET, SHARE (%), BY REGION, 2022 FIGURE 7 NORTH AMERICA: ENERGY RETROFIT SYSTEMS MARKET, SHARE (%), BY REGION, 2022 FIGURE 8 EUROPE: ENERGY RETROFIT SYSTEMS MARKET, SHARE (%), BY REGION, 2022 FIGURE 9 ASIA-PACIFIC: ENERGY RETROFIT SYSTEMS MARKET, SHARE (%), BY REGION, 2022 FIGURE 10 REST OF THE WORLD: ENERGY RETROFIT SYSTEMS MARKET, SHARE (%), BY REGION, 2022 FIGURE 11 GLOBAL ENERGY RETROFIT SYSTEMS MARKET: COMPANY SHARE ANALYSIS, 2022 (%) FIGURE 12 DAIKIN INDUSTRIES, LTD.: FINANCIAL OVERVIEW SNAPSHOT FIGURE 13 DAIKIN INDUSTRIES, LTD.: SWOT ANALYSIS FIGURE 14 AMERESCO: FINANCIAL OVERVIEW SNAPSHOT FIGURE 15 AMERESCO: SWOT ANALYSIS FIGURE 16 EATON: FINANCIAL OVERVIEW SNAPSHOT FIGURE 17 EATON: SWOT ANALYSIS FIGURE 18 AECOM: FINANCIAL OVERVIEW SNAPSHOT FIGURE 19 AECOM: SWOT ANALYSIS FIGURE 20 JOHNSON CONTROLS.: FINANCIAL OVERVIEW SNAPSHOT FIGURE 21 JOHNSON CONTROLS.: SWOT ANALYSIS FIGURE 22 ORION ENERGY SYSTEMS, INC.: FINANCIAL OVERVIEW SNAPSHOT FIGURE 23 ORION ENERGY SYSTEMS, INC.: SWOT ANALYSIS FIGURE 24 SIEMENS: FINANCIAL OVERVIEW SNAPSHOT FIGURE 25 SIEMENS: SWOT ANALYSIS FIGURE 26 TRANE: FINANCIAL OVERVIEW SNAPSHOT FIGURE 27 TRANE: SWOT ANALYSIS FIGURE 28 SIGNIFY HOLDING: FINANCIAL OVERVIEW SNAPSHOT FIGURE 29 SIGNIFY HOLDING: SWOT ANALYSIS FIGURE 30 ENGIE: FINANCIAL OVERVIEW SNAPSHOT FIGURE 31 ENGIE: SWOT ANALYSIS FIGURE 32 GENERAL ELECTRIC: FINANCIAL OVERVIEW SNAPSHOT FIGURE 33 GENERAL ELECTRIC: SWOT ANALYSIS FIGURE 34 SCHNEIDER ELECTRIC: FINANCIAL OVERVIEW SNAPSHOT FIGURE 35 SCHNEIDER ELECTRIC: SWOT ANALYSIS
    173. List of Tables and Figures
      1. Table FIGURE 1 RESEARCH PROCESS FIGURE 2 MARKET STRUCTURE FOR THE GLOBAL ENERGY RETROFIT SYSTEMS MARKET FIGURE 3 MARKET DYNAMICS FOR THE GLOBAL ENERGY RETROFIT SYSTEMS MARKET FIGURE 4 GLOBAL ENERGY RETROFIT SYSTEMS MARKET, SHARE (%), BY PRODUCT, 2022 FIGURE 5 GLOBAL ENERGY RETROFIT SYSTEMS MARKET, SHARE (%), BY APPLICATION, 2022 FIGURE 6 GLOBAL ENERGY RETROFIT SYSTEMS MARKET, SHARE (%), BY REGION, 2022 FIGURE 7 NORTH AMERICA: ENERGY RETROFIT SYSTEMS MARKET, SHARE (%), BY REGION, 2022 FIGURE 8 EUROPE: ENERGY RETROFIT SYSTEMS MARKET, SHARE (%), BY REGION, 2022 FIGURE 9 ASIA-PACIFIC: ENERGY RETROFIT SYSTEMS MARKET, SHARE (%), BY REGION, 2022 FIGURE 10 REST OF THE WORLD: ENERGY RETROFIT SYSTEMS MARKET, SHARE (%), BY REGION, 2022 FIGURE 11 GLOBAL ENERGY RETROFIT SYSTEMS MARKET: COMPANY SHARE ANALYSIS, 2022 (%) FIGURE 12 DAIKIN INDUSTRIES, LTD.: FINANCIAL OVERVIEW SNAPSHOT FIGURE 13 DAIKIN INDUSTRIES, LTD.: SWOT ANALYSIS FIGURE 14 AMERESCO: FINANCIAL OVERVIEW SNAPSHOT FIGURE 15 AMERESCO: SWOT ANALYSIS FIGURE 16 EATON: FINANCIAL OVERVIEW SNAPSHOT FIGURE 17 EATON: SWOT ANALYSIS FIGURE 18 AECOM: FINANCIAL OVERVIEW SNAPSHOT FIGURE 19 AECOM: SWOT ANALYSIS FIGURE 20 JOHNSON CONTROLS.: FINANCIAL OVERVIEW SNAPSHOT FIGURE 21 JOHNSON CONTROLS.: SWOT ANALYSIS FIGURE 22 ORION ENERGY SYSTEMS, INC.: FINANCIAL OVERVIEW SNAPSHOT FIGURE 23 ORION ENERGY SYSTEMS, INC.: SWOT ANALYSIS FIGURE 24 SIEMENS: FINANCIAL OVERVIEW SNAPSHOT FIGURE 25 SIEMENS: SWOT ANALYSIS FIGURE 26 TRANE: FINANCIAL OVERVIEW SNAPSHOT FIGURE 27 TRANE: SWOT ANALYSIS FIGURE 28 SIGNIFY HOLDING: FINANCIAL OVERVIEW SNAPSHOT FIGURE 29 SIGNIFY HOLDING: SWOT ANALYSIS FIGURE 30 ENGIE: FINANCIAL OVERVIEW SNAPSHOT FIGURE 31 ENGIE: SWOT ANALYSIS FIGURE 32 GENERAL ELECTRIC: FINANCIAL OVERVIEW SNAPSHOT FIGURE 33 GENERAL ELECTRIC: SWOT ANALYSIS FIGURE 34 SCHNEIDER ELECTRIC: FINANCIAL OVERVIEW SNAPSHOT FIGURE 35 SCHNEIDER ELECTRIC: SWOT ANALYSIS
    174. Table FIGURE 1 RESEARCH PROCESS FIGURE 2 MARKET STRUCTURE FOR THE GLOBAL ENERGY RETROFIT SYSTEMS MARKET FIGURE 3 MARKET DYNAMICS FOR THE GLOBAL ENERGY RETROFIT SYSTEMS MARKET FIGURE 4 GLOBAL ENERGY RETROFIT SYSTEMS MARKET, SHARE (%), BY PRODUCT, 2022 FIGURE 5 GLOBAL ENERGY RETROFIT SYSTEMS MARKET, SHARE (%), BY APPLICATION, 2022 FIGURE 6 GLOBAL ENERGY RETROFIT SYSTEMS MARKET, SHARE (%), BY REGION, 2022 FIGURE 7 NORTH AMERICA: ENERGY RETROFIT SYSTEMS MARKET, SHARE (%), BY REGION, 2022 FIGURE 8 EUROPE: ENERGY RETROFIT SYSTEMS MARKET, SHARE (%), BY REGION, 2022 FIGURE 9 ASIA-PACIFIC: ENERGY RETROFIT SYSTEMS MARKET, SHARE (%), BY REGION, 2022 FIGURE 10 REST OF THE WORLD: ENERGY RETROFIT SYSTEMS MARKET, SHARE (%), BY REGION, 2022 FIGURE 11 GLOBAL ENERGY RETROFIT SYSTEMS MARKET: COMPANY SHARE ANALYSIS, 2022 (%) FIGURE 12 DAIKIN INDUSTRIES, LTD.: FINANCIAL OVERVIEW SNAPSHOT FIGURE 13 DAIKIN INDUSTRIES, LTD.: SWOT ANALYSIS FIGURE 14 AMERESCO: FINANCIAL OVERVIEW SNAPSHOT FIGURE 15 AMERESCO: SWOT ANALYSIS FIGURE 16 EATON: FINANCIAL OVERVIEW SNAPSHOT FIGURE 17 EATON: SWOT ANALYSIS FIGURE 18 AECOM: FINANCIAL OVERVIEW SNAPSHOT FIGURE 19 AECOM: SWOT ANALYSIS FIGURE 20 JOHNSON CONTROLS.: FINANCIAL OVERVIEW SNAPSHOT FIGURE 21 JOHNSON CONTROLS.: SWOT ANALYSIS FIGURE 22 ORION ENERGY SYSTEMS, INC.: FINANCIAL OVERVIEW SNAPSHOT FIGURE 23 ORION ENERGY SYSTEMS, INC.: SWOT ANALYSIS FIGURE 24 SIEMENS: FINANCIAL OVERVIEW SNAPSHOT FIGURE 25 SIEMENS: SWOT ANALYSIS FIGURE 26 TRANE: FINANCIAL OVERVIEW SNAPSHOT FIGURE 27 TRANE: SWOT ANALYSIS FIGURE 28 SIGNIFY HOLDING: FINANCIAL OVERVIEW SNAPSHOT FIGURE 29 SIGNIFY HOLDING: SWOT ANALYSIS FIGURE 30 ENGIE: FINANCIAL OVERVIEW SNAPSHOT FIGURE 31 ENGIE: SWOT ANALYSIS FIGURE 32 GENERAL ELECTRIC: FINANCIAL OVERVIEW SNAPSHOT FIGURE 33 GENERAL ELECTRIC: SWOT ANALYSIS FIGURE 34 SCHNEIDER ELECTRIC: FINANCIAL OVERVIEW SNAPSHOT FIGURE 35 SCHNEIDER ELECTRIC: SWOT ANALYSIS

    Energy Retrofit Systems Market Segmentation

    Energy Retrofit Systems Product Outlook (USD Billion, 2018-2032)

    • Envelope
    • LED Retrofit Lighting
    • HVAC Retrofit
    • Appliances

    Energy Retrofit Systems Application Outlook (USD Billion, 2018-2032)

    • Residential
    • Non-Residential

    Energy Retrofit Systems Regional Outlook (USD Billion, 2018-2032)

    • North America Outlook (USD Billion, 2018-2032)

      • Energy Retrofit Systems by Product
        • Envelope
        • LED Retrofit Lighting
        • HVAC Retrofit
        • Appliances
      • Energy Retrofit Systems by Application
        • Residential
        • Non-Residential
      • US Outlook (USD Billion, 2018-2032)

      • Energy Retrofit Systems by Product
        • Envelope
        • LED Retrofit Lighting
        • HVAC Retrofit
        • Appliances
      • Energy Retrofit Systems by Application
        • Residential
        • Non-Residential
      • Canada Outlook (USD Billion, 2018-2032)

      • Energy Retrofit Systems by Product
        • Envelope
        • LED Retrofit Lighting
        • HVAC Retrofit
        • Appliances
      • Energy Retrofit Systems by Application
        • Residential
        • Non-Residential
    • Europe Outlook (USD Billion, 2018-2032)

      • Energy Retrofit Systems by Product
        • Envelope
        • LED Retrofit Lighting
        • HVAC Retrofit
        • Appliances
      • Energy Retrofit Systems by Application
        • Residential
        • Non-Residential
      • Germany Outlook (USD Billion, 2018-2032)

      • Energy Retrofit Systems by Product
        • Envelope
        • LED Retrofit Lighting
        • HVAC Retrofit
        • Appliances
      • Energy Retrofit Systems by Application
        • Residential
        • Non-Residential
      • France Outlook (USD Billion, 2018-2032)

      • Energy Retrofit Systems by Product
        • Envelope
        • LED Retrofit Lighting
        • HVAC Retrofit
        • Appliances
      • Energy Retrofit Systems by Application
        • Residential
        • Non-Residential
      • UK Outlook (USD Billion, 2018-2032)

      • Energy Retrofit Systems by Product
        • Envelope
        • LED Retrofit Lighting
        • HVAC Retrofit
        • Appliances
      • Energy Retrofit Systems by Application
        • Residential
        • Non-Residential
      • Italy Outlook (USD Billion, 2018-2032)

      • Energy Retrofit Systems by Product
        • Envelope
        • LED Retrofit Lighting
        • HVAC Retrofit
        • Appliances
      • Energy Retrofit Systems by Application
        • Residential
        • Non-Residential
      • Spain Outlook (USD Billion, 2018-2032)

      • Energy Retrofit Systems by Product
        • Envelope
        • LED Retrofit Lighting
        • HVAC Retrofit
        • Appliances
      • Energy Retrofit Systems by Application
        • Residential
        • Non-Residential
      • Rest Of Europe Outlook (USD Billion, 2018-2032)

      • Energy Retrofit Systems by Product
        • Envelope
        • LED Retrofit Lighting
        • HVAC Retrofit
        • Appliances
      • Energy Retrofit Systems by Application
        • Residential
        • Non-Residential
    • Asia-Pacific Outlook (USD Billion, 2018-2032)

      • Energy Retrofit Systems by Product
        • Envelope
        • LED Retrofit Lighting
        • HVAC Retrofit
        • Appliances
      • Energy Retrofit Systems by Application
        • Residential
        • Non-Residential
      • China Outlook (USD Billion, 2018-2032)

      • Energy Retrofit Systems by Product
        • Envelope
        • LED Retrofit Lighting
        • HVAC Retrofit
        • Appliances
      • Energy Retrofit Systems by Application
        • Residential
        • Non-Residential
      • Japan Outlook (USD Billion, 2018-2032)

      • Energy Retrofit Systems by Product
        • Envelope
        • LED Retrofit Lighting
        • HVAC Retrofit
        • Appliances
      • Energy Retrofit Systems by Application
        • Residential
        • Non-Residential
      • India Outlook (USD Billion, 2018-2032)

      • Energy Retrofit Systems by Product
        • Envelope
        • LED Retrofit Lighting
        • HVAC Retrofit
        • Appliances
      • Energy Retrofit Systems by Application
        • Residential
        • Non-Residential
      • Australia Outlook (USD Billion, 2018-2032)

      • Energy Retrofit Systems by Product
        • Envelope
        • LED Retrofit Lighting
        • HVAC Retrofit
        • Appliances
      • Energy Retrofit Systems by Application
        • Residential
        • Non-Residential
      • Rest of Asia-Pacific Outlook (USD Billion, 2018-2032)

      • Energy Retrofit Systems by Product
        • Envelope
        • LED Retrofit Lighting
        • HVAC Retrofit
        • Appliances
      • Energy Retrofit Systems by Application
        • Residential
        • Non-Residential
    • Rest of the World Outlook (USD Billion, 2018-2032)

      • Energy Retrofit Systems by Product
        • Envelope
        • LED Retrofit Lighting
        • HVAC Retrofit
        • Appliances
      • Energy Retrofit Systems by Application
        • Residential
        • Non-Residential
      • Middle East Outlook (USD Billion, 2018-2032)

      • Energy Retrofit Systems by Product
        • Envelope
        • LED Retrofit Lighting
        • HVAC Retrofit
        • Appliances
      • Energy Retrofit Systems by Application
        • Residential
        • Non-Residential
      • Africa Outlook (USD Billion, 2018-2032)

      • Energy Retrofit Systems by Product
        • Envelope
        • LED Retrofit Lighting
        • HVAC Retrofit
        • Appliances
      • Energy Retrofit Systems by Application
        • Residential
        • Non-Residential
      • Latin America Outlook (USD Billion, 2018-2032)

      • Energy Retrofit Systems by Product
        • Envelope
        • LED Retrofit Lighting
        • HVAC Retrofit
        • Appliances
      • Energy Retrofit Systems by Application
        • Residential
        • Non-Residential


    Infographic

    Free Sample Request

    Kindly complete the form below to receive a free sample of this Report

    Get Free Sample

    Customer Strories

    “I am very pleased with how market segments have been defined in a relevant way for my purposes (such as "Portable Freezers & refrigerators" and "last-mile"). In general the report is well structured. Thanks very much for your efforts.”

    Victoria Milne

    Founder
    Case Study
    Chemicals and Materials