Request Free Sample ×

Kindly complete the form below to receive a free sample of this Report

* Please use a valid business email

Leading companies partner with us for data-driven Insights

clients tt-cursor
Hero Background

Semantischer Wissensgraph-Markt

ID: MRFR/ICT/31134-HCR
100 Pages
Aarti Dhapte
Last Updated: May 15, 2026

Marktforschungsbericht zum Thema Semantic Knowledge Graphing nach Anwendung (Datenintegration, Künstliche Intelligenz, Business Intelligence, Suche und Navigation), nach Bereitstellungstyp (Vor Ort, Cloud-basiert), nach Endnutzung (Gesundheitswesen, Finanzen, Einzelhandel, Telekommunikation), nach Technologie (Natural Language Processing, Maschinelles Lernen, Graphdatenbanken) und nach Region (Nordamerika, Europa, Südamerika, Asien-Pazifik, Naher Osten und Afrika) - Prognose bis 2035.

Teilen
Download PDF ×

We do not share your information with anyone. However, we may send you emails based on your report interest from time to time. You may contact us at any time to opt-out.

Semantic Knowledge Graphing Market Infographic
Purchase Options
  1. 1 ABSCHNITT I: ZUSAMMENFASSUNG UND WICHTIGE HIGHLIGHTS
    1. 1.1 ZUSAMMENFASSUNG
      1. 1.1.1 MARKTÜBERSICHT
      2. 1.1.2 WICHTIGE ERGEBNISSE
      3. 1.1.3 MARKTSEGMENTIERUNG
      4. 1.1.4 WETTBEWERBSLANDSCHAFT
      5. 1.1.5 HERAUSFORDERUNGEN UND CHANCEN
      6. 1.1.6 ZUKUNFTSAUSSICHTEN
  2. 2 ABSCHNITT II: ABGRENZUNG, METHODOLOGIE UND MARKTSTRUKTUR
    1. 2.1 MARKTEINFÜHRUNG
      1. 2.1.1 DEFINITION
      2. 2.1.2 UMFANG DER STUDIE
        1. 2.1.2.1 FORSCHUNGSZIEL
        2. 2.1.2.2 ANNAHMEN
        3. 2.1.2.3 EINSCHRÄNKUNGEN
    2. 2.2 FORSCHUNGSMETHODOLOGIE
      1. 2.2.1 ÜBERBLICK
      2. 2.2.2 DATENABBAU
      3. 2.2.3 SEKUNDÄRFORSCHUNG
      4. 2.2.4 PRIMÄRFORSCHUNG
        1. 2.2.4.1 PROZESS DER PRIMÄREN INTERVIEWS UND INFORMATIONSSAMMLUNG
        2. 2.2.4.2 AUFTEILUNG DER PRIMÄREN ANTWORTGEBER
      5. 2.2.5 PROGNOSEMODELL
      6. 2.2.6 MARKTGROßENBESCHÄTZUNG
        1. 2.2.6.1 UNTERE ANSATZ
        2. 2.2.6.2 OBERE ANSATZ
      7. 2.2.7 DATENTRIANGULATION
      8. 2.2.8 VALIDIERUNG
  3. 3 ABSCHNITT III: QUALITATIVE ANALYSE
    1. 3.1 MARKTDYNAMIK
      1. 3.1.1 ÜBERBLICK
      2. 3.1.2 TREIBER
      3. 3.1.3 EINSCHRÄNKUNGEN
      4. 3.1.4 CHANCEN
    2. 3.2 MARKTFACHTANALYSE
      1. 3.2.1 WERTSCHÖPFUNGSKETTENANALYSE
      2. 3.2.2 PORTER'S FIVE FORCES ANALYSE
        1. 3.2.2.1 VERHANDLUNGSMACHT DER LIEFERANTEN
        2. 3.2.2.2 VERHANDLUNGSMACHT DER KÄUFER
        3. 3.2.2.3 BEDROHUNG DURCH NEUEINSTEIGER
        4. 3.2.2.4 BEDROHUNG DURCH SUBSTITUTE
        5. 3.2.2.5 INTENSITÄT DES WETTBEWERBS
      3. 3.2.3 COVID-19 IMPAKTANALYSE
        1. 3.2.3.1 MARKTAUSWIRKUNGSANALYSE
        2. 3.2.3.2 REGIONALE AUSWIRKUNGEN
        3. 3.2.3.3 CHANCEN- UND BEDROHUNGSANALYSE
  4. 4 ABSCHNITT IV: QUANTITATIVE ANALYSE
    1. 4.1 INFORMATIONSTECHNOLOGIE UND KOMMUNIKATION, NACH ANWENDUNG (MILLIARDEN USD)
      1. 4.1.1 DATENINTEGRATION
      2. 4.1.2 KÜNSTLICHE INTELLIGENZ
      3. 4.1.3 GESCHÄFTSINTELLIGENZ
      4. 4.1.4 SUCHE UND NAVIGATION
    2. 4.2 INFORMATIONSTECHNOLOGIE UND KOMMUNIKATION, NACH BEREITSTELLUNGSTYP (MILLIARDEN USD)
      1. 4.2.1 VOR ORT
      2. 4.2.2 CLOUD-BASED
    3. 4.3 INFORMATIONSTECHNOLOGIE UND KOMMUNIKATION, NACH ENDNUTZUNG (MILLIARDEN USD)
      1. 4.3.1 GESUNDHEITSWESEN
      2. 4.3.2 FINANZEN
      3. 4.3.3 EINZELHANDEL
      4. 4.3.4 TELEKOMMUNIKATION
    4. 4.4 INFORMATIONSTECHNOLOGIE UND KOMMUNIKATION, NACH TECHNOLOGIE (MILLIARDEN USD)
      1. 4.4.1 NATÜRLICHE SPRACHVERARBEITUNG
      2. 4.4.2 MASCHINENLERNEN
      3. 4.4.3 GRAPH-DATENBANKEN
    5. 4.5 INFORMATIONSTECHNOLOGIE UND KOMMUNIKATION, NACH REGION (MILLIARDEN USD)
      1. 4.5.1 NORDAMERIKA
        1. 4.5.1.1 USA
        2. 4.5.1.2 KANADA
      2. 4.5.2 EUROPA
        1. 4.5.2.1 DEUTSCHLAND
        2. 4.5.2.2 VEREINIGTES KÖNIGREICH
        3. 4.5.2.3 FRANKREICH
        4. 4.5.2.4 RUSSLAND
        5. 4.5.2.5 ITALIEN
        6. 4.5.2.6 SPANIEN
        7. 4.5.2.7 RESTEUROPA
      3. 4.5.3 APAC
        1. 4.5.3.1 CHINA
        2. 4.5.3.2 INDIEN
        3. 4.5.3.3 JAPAN
        4. 4.5.3.4 SÜDKOREA
        5. 4.5.3.5 MALAYSIA
        6. 4.5.3.6 THAILAND
        7. 4.5.3.7 INDONESIEN
        8. 4.5.3.8 REST APAC
      4. 4.5.4 SÜDAMERIKA
        1. 4.5.4.1 BRASILIEN
        2. 4.5.4.2 MEXIKO
        3. 4.5.4.3 ARGENTINIEN
        4. 4.5.4.4 REST SÜDAMERIKA
      5. 4.5.5 MEA
        1. 4.5.5.1 GCC-LÄNDER
        2. 4.5.5.2 SÜDAFRIKA
        3. 4.5.5.3 REST MEA
  5. 5 ABSCHNITT V: WETTBEWERBSANALYSE
    1. 5.1 WETTBEWERBSLANDSCHAFT
      1. 5.1.1 ÜBERBLICK
      2. 5.1.2 WETTBEWERBSANALYSE
      3. 5.1.3 MARKTANTEILSANALYSE
      4. 5.1.4 WICHTIGSTE WACHSTUMSSTRATEGIE IM BEREICH INFORMATIONSTECHNOLOGIE UND KOMMUNIKATION
      5. 5.1.5 WETTBEWERBSBENCHMARKING
      6. 5.1.6 FÜHRENDE UNTERNEHMEN IN BEZUG AUF ANZAHL DER ENTWICKLUNGEN IM BEREICH INFORMATIONSTECHNOLOGIE UND KOMMUNIKATION
      7. 5.1.7 WICHTIGE ENTWICKLUNGEN UND WACHSTUMSSTRATEGIEN
        1. 5.1.7.1 NEUE PRODUKTEINFÜHRUNG/SERVICEBEREITSTELLUNG
        2. 5.1.7.2 FUSIONEN & AKQUISITIONEN
        3. 5.1.7.3 GEMEINSAME UNTERNEHMEN
      8. 5.1.8 WICHTIGE SPIELER FINANZMATRIK
        1. 5.1.8.1 UMSATZ UND BETRIEBSGEWINN
        2. 5.1.8.2 WICHTIGE SPIELER F&E-AUSGABEN. 2023
    2. 5.2 UNTERNEHMENSPROFILE
      1. 5.2.1 GOOGLE (USA)
        1. 5.2.1.1 FINANZÜBERBLICK
        2. 5.2.1.2 ANGEBOTENE PRODUKTE
        3. 5.2.1.3 WICHTIGE ENTWICKLUNGEN
        4. 5.2.1.4 SWOT-ANALYSE
        5. 5.2.1.5 WICHTIGE STRATEGIEN
      2. 5.2.2 MICROSOFT (USA)
        1. 5.2.2.1 FINANZÜBERBLICK
        2. 5.2.2.2 ANGEBOTENE PRODUKTE
        3. 5.2.2.3 WICHTIGE ENTWICKLUNGEN
        4. 5.2.2.4 SWOT-ANALYSE
        5. 5.2.2.5 WICHTIGE STRATEGIEN
      3. 5.2.3 AMAZON (USA)
        1. 5.2.3.1 FINANZÜBERBLICK
        2. 5.2.3.2 ANGEBOTENE PRODUKTE
        3. 5.2.3.3 WICHTIGE ENTWICKLUNGEN
        4. 5.2.3.4 SWOT-ANALYSE
        5. 5.2.3.5 WICHTIGE STRATEGIEN
      4. 5.2.4 IBM (USA)
        1. 5.2.4.1 FINANZÜBERBLICK
        2. 5.2.4.2 ANGEBOTENE PRODUKTE
        3. 5.2.4.3 WICHTIGE ENTWICKLUNGEN
        4. 5.2.4.4 SWOT-ANALYSE
        5. 5.2.4.5 WICHTIGE STRATEGIEN
      5. 5.2.5 ORACLE (USA)
        1. 5.2.5.1 FINANZÜBERBLICK
        2. 5.2.5.2 ANGEBOTENE PRODUKTE
        3. 5.2.5.3 WICHTIGE ENTWICKLUNGEN
        4. 5.2.5.4 SWOT-ANALYSE
        5. 5.2.5.5 WICHTIGE STRATEGIEN
      6. 5.2.6 SAP (DE)
        1. 5.2.6.1 FINANZÜBERBLICK
        2. 5.2.6.2 ANGEBOTENE PRODUKTE
        3. 5.2.6.3 WICHTIGE ENTWICKLUNGEN
        4. 5.2.6.4 SWOT-ANALYSE
        5. 5.2.6.5 WICHTIGE STRATEGIEN
      7. 5.2.7 NEO4J (USA)
        1. 5.2.7.1 FINANZÜBERBLICK
        2. 5.2.7.2 ANGEBOTENE PRODUKTE
        3. 5.2.7.3 WICHTIGE ENTWICKLUNGEN
        4. 5.2.7.4 SWOT-ANALYSE
        5. 5.2.7.5 WICHTIGE STRATEGIEN
      8. 5.2.8 STARDOG (USA)
        1. 5.2.8.1 FINANZÜBERBLICK
        2. 5.2.8.2 ANGEBOTENE PRODUKTE
        3. 5.2.8.3 WICHTIGE ENTWICKLUNGEN
        4. 5.2.8.4 SWOT-ANALYSE
        5. 5.2.8.5 WICHTIGE STRATEGIEN
      9. 5.2.9 GRAPHDB (GB)
        1. 5.2.9.1 FINANZÜBERBLICK
        2. 5.2.9.2 ANGEBOTENE PRODUKTE
        3. 5.2.9.3 WICHTIGE ENTWICKLUNGEN
        4. 5.2.9.4 SWOT-ANALYSE
        5. 5.2.9.5 WICHTIGE STRATEGIEN
    3. 5.3 ANHANG
      1. 5.3.1 QUELLEN
      2. 5.3.2 VERWANDTE BERICHTE
  6. 6 LISTE DER ABBILDUNGEN
    1. 6.1 MARKTSYNOPSIS
    2. 6.2 NORDAMERIKANISCHE MARKTANALYSE
    3. 6.3 USA MARKTANALYSE NACH ANWENDUNG
    4. 6.4 USA MARKTANALYSE NACH BEREITSTELLUNGSTYP
    5. 6.5 USA MARKTANALYSE NACH ENDNUTZUNG
    6. 6.6 USA MARKTANALYSE NACH TECHNOLOGIE
    7. 6.7 KANADA MARKTANALYSE NACH ANWENDUNG
    8. 6.8 KANADA MARKTANALYSE NACH BEREITSTELLUNGSTYP
    9. 6.9 KANADA MARKTANALYSE NACH ENDNUTZUNG
    10. 6.10 KANADA MARKTANALYSE NACH TECHNOLOGIE
    11. 6.11 EUROPA MARKTANALYSE
    12. 6.12 DEUTSCHLAND MARKTANALYSE NACH ANWENDUNG
    13. 6.13 DEUTSCHLAND MARKTANALYSE NACH BEREITSTELLUNGSTYP
    14. 6.14 DEUTSCHLAND MARKTANALYSE NACH ENDNUTZUNG
    15. 6.15 DEUTSCHLAND MARKTANALYSE NACH TECHNOLOGIE
    16. 6.16 VEREINIGTES KÖNIGREICH MARKTANALYSE NACH ANWENDUNG
    17. 6.17 VEREINIGTES KÖNIGREICH MARKTANALYSE NACH BEREITSTELLUNGSTYP
    18. 6.18 VEREINIGTES KÖNIGREICH MARKTANALYSE NACH ENDNUTZUNG
    19. 6.19 VEREINIGTES KÖNIGREICH MARKTANALYSE NACH TECHNOLOGIE
    20. 6.20 FRANKREICH MARKTANALYSE NACH ANWENDUNG
    21. 6.21 FRANKREICH MARKTANALYSE NACH BEREITSTELLUNGSTYP
    22. 6.22 FRANKREICH MARKTANALYSE NACH ENDNUTZUNG
    23. 6.23 FRANKREICH MARKTANALYSE NACH TECHNOLOGIE
    24. 6.24 RUSSLAND MARKTANALYSE NACH ANWENDUNG
    25. 6.25 RUSSLAND MARKTANALYSE NACH BEREITSTELLUNGSTYP
    26. 6.26 RUSSLAND MARKTANALYSE NACH ENDNUTZUNG
    27. 6.27 RUSSLAND MARKTANALYSE NACH TECHNOLOGIE
    28. 6.28 ITALIEN MARKTANALYSE NACH ANWENDUNG
    29. 6.29 ITALIEN MARKTANALYSE NACH BEREITSTELLUNGSTYP
    30. 6.30 ITALIEN MARKTANALYSE NACH ENDNUTZUNG
    31. 6.31 ITALIEN MARKTANALYSE NACH TECHNOLOGIE
    32. 6.32 SPANIEN MARKTANALYSE NACH ANWENDUNG
    33. 6.33 SPANIEN MARKTANALYSE NACH BEREITSTELLUNGSTYP
    34. 6.34 SPANIEN MARKTANALYSE NACH ENDNUTZUNG
    35. 6.35 SPANIEN MARKTANALYSE NACH TECHNOLOGIE
    36. 6.36 RESTEUROPA MARKTANALYSE NACH ANWENDUNG
    37. 6.37 RESTEUROPA MARKTANALYSE NACH BEREITSTELLUNGSTYP
    38. 6.38 RESTEUROPA MARKTANALYSE NACH ENDNUTZUNG
    39. 6.39 RESTEUROPA MARKTANALYSE NACH TECHNOLOGIE
    40. 6.40 APAC MARKTANALYSE
    41. 6.41 CHINA MARKTANALYSE NACH ANWENDUNG
    42. 6.42 CHINA MARKTANALYSE NACH BEREITSTELLUNGSTYP
    43. 6.43 CHINA MARKTANALYSE NACH ENDNUTZUNG
    44. 6.44 CHINA MARKTANALYSE NACH TECHNOLOGIE
    45. 6.45 INDIEN MARKTANALYSE NACH ANWENDUNG
    46. 6.46 INDIEN MARKTANALYSE NACH BEREITSTELLUNGSTYP
    47. 6.47 INDIEN MARKTANALYSE NACH ENDNUTZUNG
    48. 6.48 INDIEN MARKTANALYSE NACH TECHNOLOGIE
    49. 6.49 JAPAN MARKTANALYSE NACH ANWENDUNG
    50. 6.50 JAPAN MARKTANALYSE NACH BEREITSTELLUNGSTYP
    51. 6.51 JAPAN MARKTANALYSE NACH ENDNUTZUNG
    52. 6.52 JAPAN MARKTANALYSE NACH TECHNOLOGIE
    53. 6.53 SÜDKOREA MARKTANALYSE NACH ANWENDUNG
    54. 6.54 SÜDKOREA MARKTANALYSE NACH BEREITSTELLUNGSTYP
    55. 6.55 SÜDKOREA MARKTANALYSE NACH ENDNUTZUNG
    56. 6.56 SÜDKOREA MARKTANALYSE NACH TECHNOLOGIE
    57. 6.57 MALAYSIA MARKTANALYSE NACH ANWENDUNG
    58. 6.58 MALAYSIA MARKTANALYSE NACH BEREITSTELLUNGSTYP
    59. 6.59 MALAYSIA MARKTANALYSE NACH ENDNUTZUNG
    60. 6.60 MALAYSIA MARKTANALYSE NACH TECHNOLOGIE
    61. 6.61 THAILAND MARKTANALYSE NACH ANWENDUNG
    62. 6.62 THAILAND MARKTANALYSE NACH BEREITSTELLUNGSTYP
    63. 6.63 THAILAND MARKTANALYSE NACH ENDNUTZUNG
    64. 6.64 THAILAND MARKTANALYSE NACH TECHNOLOGIE
    65. 6.65 INDONESIEN MARKTANALYSE NACH ANWENDUNG
    66. 6.66 INDONESIEN MARKTANALYSE NACH BEREITSTELLUNGSTYP
    67. 6.67 INDONESIEN MARKTANALYSE NACH ENDNUTZUNG
    68. 6.68 INDONESIEN MARKTANALYSE NACH TECHNOLOGIE
    69. 6.69 REST APAC MARKTANALYSE NACH ANWENDUNG
    70. 6.70 REST APAC MARKTANALYSE NACH BEREITSTELLUNGSTYP
    71. 6.71 REST APAC MARKTANALYSE NACH ENDNUTZUNG
    72. 6.72 REST APAC MARKTANALYSE NACH TECHNOLOGIE
    73. 6.73 SÜDAMERIKA MARKTANALYSE
    74. 6.74 BRASILIEN MARKTANALYSE NACH ANWENDUNG
    75. 6.75 BRASILIEN MARKTANALYSE NACH BEREITSTELLUNGSTYP
    76. 6.76 BRASILIEN MARKTANALYSE NACH ENDNUTZUNG
    77. 6.77 BRASILIEN MARKTANALYSE NACH TECHNOLOGIE
    78. 6.78 MEXIKO MARKTANALYSE NACH ANWENDUNG
    79. 6.79 MEXIKO MARKTANALYSE NACH BEREITSTELLUNGSTYP
    80. 6.80 MEXIKO MARKTANALYSE NACH ENDNUTZUNG
    81. 6.81 MEXIKO MARKTANALYSE NACH TECHNOLOGIE
    82. 6.82 ARGENTINIEN MARKTANALYSE NACH ANWENDUNG
    83. 6.83 ARGENTINIEN MARKTANALYSE NACH BEREITSTELLUNGSTYP
    84. 6.84 ARGENTINIEN MARKTANALYSE NACH ENDNUTZUNG
    85. 6.85 ARGENTINIEN MARKTANALYSE NACH TECHNOLOGIE
    86. 6.86 REST SÜDAMERIKA MARKTANALYSE NACH ANWENDUNG
    87. 6.87 REST SÜDAMERIKA MARKTANALYSE NACH BEREITSTELLUNGSTYP
    88. 6.88 REST SÜDAMERIKA MARKTANALYSE NACH ENDNUTZUNG
    89. 6.89 REST SÜDAMERIKA MARKTANALYSE NACH TECHNOLOGIE
    90. 6.90 MEA MARKTANALYSE
    91. 6.91 GCC-LÄNDER MARKTANALYSE NACH ANWENDUNG
    92. 6.92 GCC-LÄNDER MARKTANALYSE NACH BEREITSTELLUNGSTYP
    93. 6.93 GCC-LÄNDER MARKTANALYSE NACH ENDNUTZUNG
    94. 6.94 GCC-LÄNDER MARKTANALYSE NACH TECHNOLOGIE
    95. 6.95 SÜDAFRIKA MARKTANALYSE NACH ANWENDUNG
    96. 6.96 SÜDAFRIKA MARKTANALYSE NACH BEREITSTELLUNGSTYP
    97. 6.97 SÜDAFRIKA MARKTANALYSE NACH ENDNUTZUNG
    98. 6.98 SÜDAFRIKA MARKTANALYSE NACH TECHNOLOGIE
    99. 6.99 REST MEA MARKTANALYSE NACH ANWENDUNG
    100. 6.100 REST MEA MARKTANALYSE NACH BEREITSTELLUNGSTYP
    101. 6.101 REST MEA MARKTANALYSE NACH ENDNUTZUNG
    102. 6.102 REST MEA MARKTANALYSE NACH TECHNOLOGIE
    103. 6.103 WICHTIGE KAUFKRITERIEN FÜR INFORMATIONSTECHNOLOGIE UND KOMMUNIKATION
    104. 6.104 FORSCHUNGSPROZESS VON MRFR
    105. 6.105 DRO-ANALYSE FÜR INFORMATIONSTECHNOLOGIE UND KOMMUNIKATION
    106. 6.106 TREIBERWIRKUNGSANALYSE: INFORMATIONSTECHNOLOGIE UND KOMMUNIKATION
    107. 6.107 EINSCHRÄNKUNGENWIRKUNGSANALYSE: INFORMATIONSTECHNOLOGIE UND KOMMUNIKATION
    108. 6.108 LIEFER-/WERTSCHÖPFUNGSKETTE: INFORMATIONSTECHNOLOGIE UND KOMMUNIKATION
    109. 6.109 INFORMATIONSTECHNOLOGIE UND KOMMUNIKATION, NACH ANWENDUNG, 2024 (% ANTEIL)
    110. 6.110 INFORMATIONSTECHNOLOGIE UND KOMMUNIKATION, NACH ANWENDUNG, 2024 BIS 2035 (MILLIARDEN USD)
    111. 6.111 INFORMATIONSTECHNOLOGIE UND KOMMUNIKATION, NACH BEREITSTELLUNGSTYP, 2024 (% ANTEIL)
    112. 6.112 INFORMATIONSTECHNOLOGIE UND KOMMUNIKATION, NACH BEREITSTELLUNGSTYP, 2024 BIS 2035 (MILLIARDEN USD)
    113. 6.113 INFORMATIONSTECHNOLOGIE UND KOMMUNIKATION, NACH ENDNUTZUNG, 2024 (% ANTEIL)
    114. 6.114 INFORMATIONSTECHNOLOGIE UND KOMMUNIKATION, NACH ENDNUTZUNG, 2024 BIS 2035 (MILLIARDEN USD)
    115. 6.115 INFORMATIONSTECHNOLOGIE UND KOMMUNIKATION, NACH TECHNOLOGIE, 2024 (% ANTEIL)
    116. 6.116 INFORMATIONSTECHNOLOGIE UND KOMMUNIKATION, NACH TECHNOLOGIE, 2024 BIS 2035 (MILLIARDEN USD)
    117. 6.117 BENCHMARKING DER WICHTIGSTEN WETTBEWERBER
  7. 7 LISTE DER TABELLEN
    1. 7.1 LISTE DER ANNAHMEN
    2. 7.2 NORDAMERIKANISCHE MARKTGROßENBESCHÄTZUNGEN; PROGNOSE
      1. 7.2.1 NACH ANWENDUNG, 2025-2035 (MILLIARDEN USD)
      2. 7.2.2 NACH BEREITSTELLUNGSTYP, 2025-2035 (MILLIARDEN USD)
      3. 7.2.3 NACH ENDNUTZUNG, 2025-2035 (MILLIARDEN USD)
      4. 7.2.4 NACH TECHNOLOGIE, 2025-2035 (MILLIARDEN USD)
    3. 7.3 USA MARKTGROßENBESCHÄTZUNGEN; PROGNOSE
      1. 7.3.1 NACH ANWENDUNG, 2025-2035 (MILLIARDEN USD)
      2. 7.3.2 NACH BEREITSTELLUNGSTYP, 2025-2035 (MILLIARDEN USD)
      3. 7.3.3 NACH ENDNUTZUNG, 2025-2035 (MILLIARDEN USD)
      4. 7.3.4 NACH TECHNOLOGIE, 2025-2035 (MILLIARDEN USD)
    4. 7.4 KANADA MARKTGROßENBESCHÄTZUNGEN; PROGNOSE
      1. 7.4.1 NACH ANWENDUNG, 2025-2035 (MILLIARDEN USD)
      2. 7.4.2 NACH BEREITSTELLUNGSTYP, 2025-2035 (MILLIARDEN USD)
      3. 7.4.3 NACH ENDNUTZUNG, 2025-2035 (MILLIARDEN USD)
      4. 7.4.4 NACH TECHNOLOGIE, 2025-2035 (MILLIARDEN USD)
    5. 7.5 EUROPA MARKTGROßENBESCHÄTZUNGEN; PROGNOSE
      1. 7.5.1 NACH ANWENDUNG, 2025-2035 (MILLIARDEN USD)
      2. 7.5.2 NACH BEREITSTELLUNGSTYP, 2025-2035 (MILLIARDEN USD)
      3. 7.5.3 NACH ENDNUTZUNG, 2025-2035 (MILLIARDEN USD)
      4. 7.5.4 NACH TECHNOLOGIE, 2025-2035 (MILLIARDEN USD)
    6. 7.6 DEUTSCHLAND MARKTGROßENBESCHÄTZUNGEN; PROGNOSE
      1. 7.6.1 NACH ANWENDUNG, 2025-2035 (MILLIARDEN USD)
      2. 7.6.2 NACH BEREITSTELLUNGSTYP, 2025-2035 (MILLIARDEN USD)
      3. 7.6.3 NACH ENDNUTZUNG, 2025-2035 (MILLIARDEN USD)
      4. 7.6.4 NACH TECHNOLOGIE, 2025-2035 (MILLIARDEN USD)
    7. 7.7 VEREINIGTES KÖNIGREICH MARKTGROßENBESCHÄTZUNGEN; PROGNOSE
      1. 7.7.1 NACH ANWENDUNG, 2025-2035 (MILLIARDEN USD)
      2. 7.7.2 NACH BEREITSTELLUNGSTYP, 2025-2035 (MILLIARDEN USD)
      3. 7.7.3 NACH ENDNUTZUNG, 2025-2035 (MILLIARDEN USD)
      4. 7.7.4 NACH TECHNOLOGIE, 2025-2035 (MILLIARDEN USD)
    8. 7.8 FRANKREICH MARKTGROßENBESCHÄTZUNGEN; PROGNOSE
      1. 7.8.1 NACH ANWENDUNG, 2025-2035 (MILLIARDEN USD)
      2. 7.8.2 NACH BEREITSTELLUNGSTYP, 2025-2035 (MILLIARDEN USD)
      3. 7.8.3 NACH ENDNUTZUNG, 2025-2035 (MILLIARDEN USD)
      4. 7.8.4 NACH TECHNOLOGIE, 2025-2035 (MILLIARDEN USD)
    9. 7.9 RUSSLAND MARKTGROßENBESCHÄTZUNGEN; PROGNOSE
      1. 7.9.1 NACH ANWENDUNG, 2025-2035 (MILLIARDEN USD)
      2. 7.9.2 NACH BEREITSTELLUNGSTYP, 2025-2035 (MILLIARDEN USD)
      3. 7.9.3 NACH ENDNUTZUNG, 2025-2035 (MILLIARDEN USD)
      4. 7.9.4 NACH TECHNOLOGIE, 2025-2035 (MILLIARDEN USD)
    10. 7.10 ITALIEN MARKTGROßENBESCHÄTZUNGEN; PROGNOSE
      1. 7.10.1 NACH ANWENDUNG, 2025-2035 (MILLIARDEN USD)
      2. 7.10.2 NACH BEREITSTELLUNGSTYP, 2025-2035 (MILLIARDEN USD)
      3. 7.10.3 NACH ENDNUTZUNG, 2025-2035 (MILLIARDEN USD)
      4. 7.10.4 NACH TECHNOLOGIE, 2025-2035 (MILLIARDEN USD)
    11. 7.11 SPANIEN MARKTGROßENBESCHÄTZUNGEN; PROGNOSE
      1. 7.11.1 NACH ANWENDUNG, 2025-2035 (MILLIARDEN USD)
      2. 7.11.2 NACH BEREITSTELLUNGSTYP, 2025-2035 (MILLIARDEN USD)
      3. 7.11.3 NACH ENDNUTZUNG, 2025-2035 (MILLIARDEN USD)
      4. 7.11.4 NACH TECHNOLOGIE, 2025-2035 (MILLIARDEN USD)
    12. 7.12 RESTEUROPA MARKTGROßENBESCHÄTZUNGEN; PROGNOSE
      1. 7.12.1 NACH ANWENDUNG, 2025-2035 (MILLIARDEN USD)
      2. 7.12.2 NACH BEREITSTELLUNGSTYP, 2025-2035 (MILLIARDEN USD)
      3. 7.12.3 NACH ENDNUTZUNG, 2025-2035 (MILLIARDEN USD)
      4. 7.12.4 NACH TECHNOLOGIE, 2025-2035 (MILLIARDEN USD)
    13. 7.13 APAC MARKTGROßENBESCHÄTZUNGEN; PROGNOSE
      1. 7.13.1 NACH ANWENDUNG, 2025-2035 (MILLIARDEN USD)
      2. 7.13.2 NACH BEREITSTELLUNGSTYP, 2025-2035 (MILLIARDEN USD)
      3. 7.13.3 NACH ENDNUTZUNG, 2025-2035 (MILLIARDEN USD)
      4. 7.13.4 NACH TECHNOLOGIE, 2025-2035 (MILLIARDEN USD)
    14. 7.14 CHINA MARKTGROßENBESCHÄTZUNGEN; PROGNOSE
      1. 7.14.1 NACH ANWENDUNG, 2025-2035 (MILLIARDEN USD)
      2. 7.14.2 NACH BEREITSTELLUNGSTYP, 2025-2035 (MILLIARDEN USD)
      3. 7.14.3 NACH ENDNUTZUNG, 2025-2035 (MILLIARDEN USD)
      4. 7.14.4 NACH TECHNOLOGIE, 2025-2035 (MILLIARDEN USD)
    15. 7.15 INDIEN MARKTGROßENBESCHÄTZUNGEN; PROGNOSE
      1. 7.15.1 NACH ANWENDUNG, 2025-2035 (MILLIARDEN USD)
      2. 7.15.2 NACH BEREITSTELLUNGSTYP, 2025-2035 (MILLIARDEN USD)
      3. 7.15.3 NACH ENDNUTZUNG, 2025-2035 (MILLIARDEN USD)
      4. 7.15.4 NACH TECHNOLOGIE, 2025-2035 (MILLIARDEN USD)
    16. 7.16 JAPAN MARKTGROßENBESCHÄTZUNGEN; PROGNOSE
      1. 7.16.1 NACH ANWENDUNG, 2025-2035 (MILLIARDEN USD)
      2. 7.16.2 NACH BEREITSTELLUNGSTYP, 2025-2035 (MILLIARDEN USD)
      3. 7.16.3 NACH ENDNUTZUNG, 2025-2035 (MILLIARDEN USD)
      4. 7.16.4 NACH TECHNOLOGIE, 2025-2035 (MILLIARDEN USD)
    17. 7.17 SÜDKOREA MARKTGROßENBESCHÄTZUNGEN; PROGNOSE
      1. 7.17.1 NACH ANWENDUNG, 2025-2035 (MILLIARDEN USD)
      2. 7.17.2 NACH BEREITSTELLUNGSTYP, 2025-2035 (MILLIARDEN USD)
      3. 7.17.3 NACH ENDNUTZUNG, 2025-2035 (MILLIARDEN USD)
      4. 7.17.4 NACH TECHNOLOGIE, 2025-2035 (MILLIARDEN USD)
    18. 7.18 MALAYSIA MARKTGROßENBESCHÄTZUNGEN; PROGNOSE
      1. 7.18.1 NACH ANWENDUNG, 2025-2035 (MILLIARDEN USD)
      2. 7.18.2 NACH BEREITSTELLUNGSTYP, 2025-2035 (MILLIARDEN USD)
      3. 7.18.3 NACH ENDNUTZUNG, 2025-2035 (MILLIARDEN USD)
      4. 7.18.4 NACH TECHNOLOGIE, 2025-2035 (MILLIARDEN USD)
    19. 7.19 THAILAND MARKTGROßENBESCHÄTZUNGEN; PROGNOSE
      1. 7.19.1 NACH ANWENDUNG, 2025-2035 (MILLIARDEN USD)
      2. 7.19.2 NACH BEREITSTELLUNGSTYP, 2025-2035 (MILLIARDEN USD)
      3. 7.19.3 NACH ENDNUTZUNG, 2025-2035 (MILLIARDEN USD)
      4. 7.19.4 NACH TECHNOLOGIE, 2025-2035 (MILLIARDEN USD)
    20. 7.20 INDONESIEN MARKTGROßENBESCHÄTZUNGEN; PROGNOSE
      1. 7.20.1 NACH ANWENDUNG, 2025-2035 (MILLIARDEN USD)
      2. 7.20.2 NACH BEREITSTELLUNGSTYP, 2025-2035 (MILLIARDEN USD)
      3. 7.20.3 NACH ENDNUTZUNG, 2025-2035 (MILLIARDEN USD)
      4. 7.20.4 NACH TECHNOLOGIE, 2025-2035 (MILLIARDEN USD)
    21. 7.21 REST APAC MARKTGROßENBESCHÄTZUNGEN; PROGNOSE
      1. 7.21.1 NACH ANWENDUNG, 2025-2035 (MILLIARDEN USD)
      2. 7.21.2 NACH BEREITSTELLUNGSTYP, 2025-2035 (MILLIARDEN USD)
      3. 7.21.3 NACH ENDNUTZUNG, 2025-2035 (MILLIARDEN USD)
      4. 7.21.4 NACH TECHNOLOGIE, 2025-2035 (MILLIARDEN USD)
    22. 7.22 SÜDAMERIKA MARKTGROßENBESCHÄTZUNGEN; PROGNOSE
      1. 7.22.1 NACH ANWENDUNG, 2025-2035 (MILLIARDEN USD)
      2. 7.22.2 NACH BEREITSTELLUNGSTYP, 2025-2035 (MILLIARDEN USD)
      3. 7.22.3 NACH ENDNUTZUNG, 2025-2035 (MILLIARDEN USD)
      4. 7.22.4 NACH TECHNOLOGIE, 2025-2035 (MILLIARDEN USD)
    23. 7.23 BRASILIEN MARKTGROßENBESCHÄTZUNGEN; PROGNOSE
      1. 7.23.1 NACH ANWENDUNG, 2025-2035 (MILLIARDEN USD)
      2. 7.23.2 NACH BEREITSTELLUNGSTYP, 2025-2035 (MILLIARDEN USD)
      3. 7.23.3 NACH ENDNUTZUNG, 2025-2035 (MILLIARDEN USD)
      4. 7.23.4 NACH TECHNOLOGIE, 2025-2035 (MILLIARDEN USD)
    24. 7.24 MEXIKO MARKTGROßENBESCHÄTZUNGEN; PROGNOSE
      1. 7.24.1 NACH ANWENDUNG, 2025-2035 (MILLIARDEN USD)
      2. 7.24.2 NACH BEREITSTELLUNGSTYP, 2025-2035 (MILLIARDEN USD)
      3. 7.24.3 NACH ENDNUTZUNG, 2025-2035 (MILLIARDEN USD)
      4. 7.24.4 NACH TECHNOLOGIE, 2025-2035 (MILLIARDEN USD)
    25. 7.25 ARGENTINIEN MARKTGROßENBESCHÄTZUNGEN; PROGNOSE
      1. 7.25.1 NACH ANWENDUNG, 2025-2035 (MILLIARDEN USD)
      2. 7.25.2 NACH BEREITSTELLUNGSTYP, 2025-2035 (MILLIARDEN USD)
      3. 7.25.3 NACH ENDNUTZUNG, 2025-2035 (MILLIARDEN USD)
      4. 7.25.4 NACH TECHNOLOGIE, 2025-2035 (MILLIARDEN USD)
    26. 7.26 REST SÜDAMERIKA MARKTGROßENBESCHÄTZUNGEN; PROGNOSE
      1. 7.26.1 NACH ANWENDUNG, 2025-2035 (MILLIARDEN USD)
      2. 7.26.2 NACH BEREITSTELLUNGSTYP, 2025-2035 (MILLIARDEN USD)
      3. 7.26.3 NACH ENDNUTZUNG, 2025-2035 (MILLIARDEN USD)
      4. 7.26.4 NACH TECHNOLOGIE, 2025-2035 (MILLIARDEN USD)
    27. 7.27 MEA MARKTGROßENBESCHÄTZUNGEN; PROGNOSE
      1. 7.27.1 NACH ANWENDUNG, 2025-2035 (MILLIARDEN USD)
      2. 7.27.2 NACH BEREITSTELLUNGSTYP, 2025-2035 (MILLIARDEN USD)
      3. 7.27.3 NACH ENDNUTZUNG, 2025-2035 (MILLIARDEN USD)
      4. 7.27.4 NACH TECHNOLOGIE, 2025-2035 (MILLIARDEN USD)
    28. 7.28 GCC-LÄNDER MARKTGROßENBESCHÄTZUNGEN; PROGNOSE
      1. 7.28.1 NACH ANWENDUNG, 2025-2035 (MILLIARDEN USD)
      2. 7.28.2 NACH BEREITSTELLUNGSTYP, 2025-2035 (MILLIARDEN USD)
      3. 7.28.3 NACH ENDNUTZUNG, 2025-2035 (MILLIARDEN USD)
      4. 7.28.4 NACH TECHNOLOGIE, 2025-2035 (MILLIARDEN USD)
    29. 7.29 SÜDAFRIKA MARKTGROßENBESCHÄTZUNGEN; PROGNOSE
      1. 7.29.1 NACH ANWENDUNG, 2025-2035 (MILLIARDEN USD)
      2. 7.29.2 NACH BEREITSTELLUNGSTYP, 2025-2035 (MILLIARDEN USD)
      3. 7.29.3 NACH ENDNUTZUNG, 2025-2035 (MILLIARDEN USD)
      4. 7.29.4 NACH TECHNOLOGIE, 2025-2035 (MILLIARDEN USD)
    30. 7.30 REST MEA MARKTGROßENBESCHÄTZUNGEN; PROGNOSE
      1. 7.30.1 NACH ANWENDUNG, 2025-2035 (MILLIARDEN USD)
      2. 7.30.2 NACH BEREITSTELLUNGSTYP, 2025-2035 (MILLIARDEN USD)
      3. 7.30.3 NACH ENDNUTZUNG, 2025-2035 (MILLIARDEN USD)
      4. 7.30.4 NACH TECHNOLOGIE, 2025-2035 (MILLIARDEN USD)
    31. 7.31 PRODUKTEINFÜHRUNG/PRODUKTENTWICKLUNG/GENEHMIGUNG
    32. 7.32 AKQUISITION/PARTNERSCHAFT

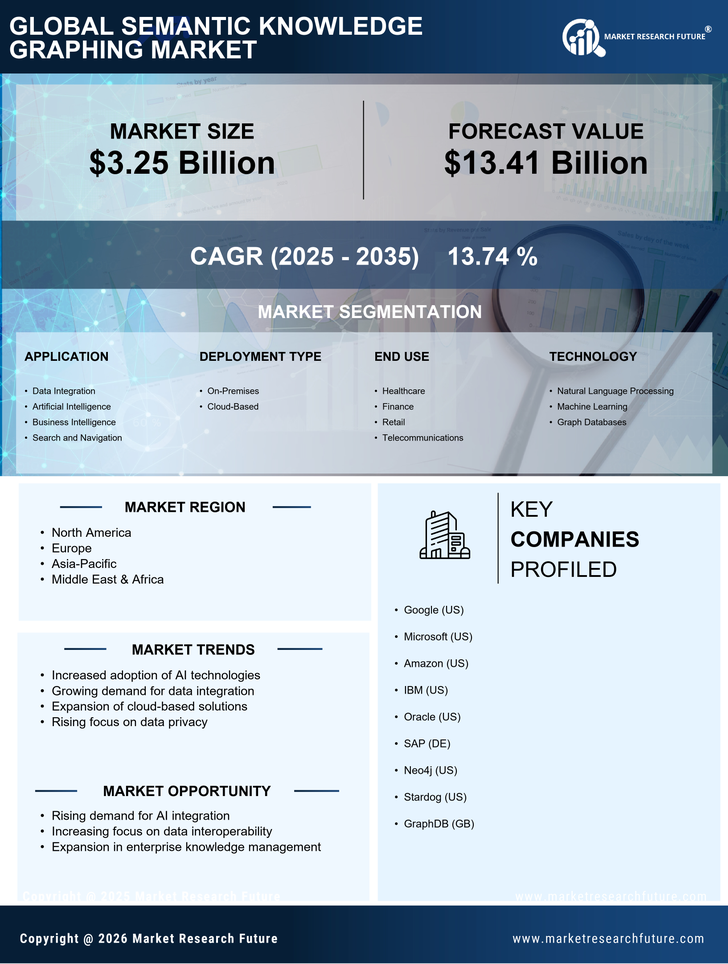
Segmentierung des Marktes für semantische Wissensgraphen

  • Markt für semantische Wissensgraphen nach Anwendung (Milliarden USD, 2019-2032)

    • Datenintegration

    • Künstliche Intelligenz

    • Business Intelligence

    • Suche und Navigation

  • Markt für semantische Wissensgraphen nach Bereitstellungstyp (Milliarden USD, 2019-2032)

    • Vor Ort

    • Cloud-basiert

  • Markt für semantische Wissensgraphen nach Endnutzung (Milliarden USD, 2019-2032)

    • Gesundheitswesen

    • Finanzen

    • Einzelhandel

    • Telekommunikation

  • Markt für semantische Wissensgraphen nach Technologie (Milliarden USD, 2019-2032)

    • Verarbeitung natürlicher Sprache

    • Maschinenlernen

    • Graphdatenbanken

  • Markt für semantische Wissensgraphen nach Region (Milliarden USD, 2019-2032)

    • Nordamerika

    • Europa

    • Südamerika

    • Asien-Pazifik

    • Mittlerer Osten und Afrika

Regionale Perspektive des Marktes für semantische Wissensgraphen (Milliarden USD, 2019-2032)

  • Perspektive Nordamerika (Milliarden USD, 2019-2032)

    • Markt für semantische Wissensgraphen in Nordamerika nach Anwendungstyp

      • Datenintegration

      • Künstliche Intelligenz

      • Business Intelligence

      • Suche und Navigation

    • Markt für semantische Wissensgraphen in Nordamerika nach Bereitstellungstyp

      • Vor Ort

      • Cloud-basiert

    • Markt für semantische Wissensgraphen in Nordamerika nach Endnutzungstyp

      • Gesundheitswesen

      • Finanzen

      • Einzelhandel

      • Telekommunikation

    • Markt für semantische Wissensgraphen in Nordamerika nach Technologietyp

      • Verarbeitung natürlicher Sprache

      • Maschinenlernen

      • Graphdatenbanken

    • Markt für semantische Wissensgraphen in Nordamerika nach regionalem Typ

      • USA

      • Kanada

    • Perspektive USA (Milliarden USD, 2019-2032)

    • Markt für semantische Wissensgraphen in den USA nach Anwendungstyp

      • Datenintegration

      • Künstliche Intelligenz

      • Business Intelligence

      • Suche und Navigation

    • Markt für semantische Wissensgraphen in den USA nach Bereitstellungstyp

      • Vor Ort

      • Cloud-basiert

    • Markt für semantische Wissensgraphen in den USA nach Endnutzungstyp

      • Gesundheitswesen

      • Finanzen

      • Einzelhandel

      • Telekommunikation

    • Markt für semantische Wissensgraphen in den USA nach Technologietyp

      • Verarbeitung natürlicher Sprache

      • Maschinenlernen

      • Graphdatenbanken

    • Perspektive KANADA (Milliarden USD, 2019-2032)

    • Markt für semantische Wissensgraphen in KANADA nach Anwendungstyp

      • Datenintegration

      • Künstliche Intelligenz

      • Business Intelligence

      • Suche und Navigation

    • Markt für semantische Wissensgraphen in KANADA nach Bereitstellungstyp

      • Vor Ort

      • Cloud-basiert

    • Markt für semantische Wissensgraphen in KANADA nach Endnutzungstyp

      • Gesundheitswesen

      • Finanzen

      • Einzelhandel

      • Telekommunikation

    • Markt für semantische Wissensgraphen in KANADA nach Technologietyp

      • Verarbeitung natürlicher Sprache

      • Maschinenlernen

      • Graphdatenbanken

  • Perspektive Europa (Milliarden USD, 2019-2032)

    • Markt für semantische Wissensgraphen in Europa nach Anwendungstyp

      • Datenintegration

      • Künstliche Intelligenz

      • Business Intelligence

      • Suche und Navigation

    • Markt für semantische Wissensgraphen in Europa nach Bereitstellungstyp

      • Vor Ort

      • Cloud-basiert

    • Markt für semantische Wissensgraphen in Europa nach Endnutzungstyp

      • Gesundheitswesen

      • Finanzen

      • Einzelhandel

      • Telekommunikation

    • Markt für semantische Wissensgraphen in Europa nach Technologietyp

      • Verarbeitung natürlicher Sprache

      • Maschinenlernen

      • Graphdatenbanken

    • Markt für semantische Wissensgraphen in Europa nach regionalem Typ

      • Deutschland

      • Vereinigtes Königreich

      • Frankreich

      • Russland

      • Italien

      • Spanien

      • Rest von Europa

    • Perspektive DEUTSCHLAND (Milliarden USD, 2019-2032)

    • Markt für semantische Wissensgraphen in DEUTSCHLAND nach Anwendungstyp

      • Datenintegration

      • Künstliche Intelligenz

      • Business Intelligence

      • Suche und Navigation

    • Markt für semantische Wissensgraphen in DEUTSCHLAND nach Bereitstellungstyp

      • Vor Ort

      • Cloud-basiert

    • Markt für semantische Wissensgraphen in DEUTSCHLAND nach Endnutzungstyp

      • Gesundheitswesen

      • Finanzen

      • Einzelhandel

      • Telekommunikation

    • Markt für semantische Wissensgraphen in DEUTSCHLAND nach Technologietyp

      • Verarbeitung natürlicher Sprache

      • Maschinenlernen

      • Graphdatenbanken

    • Perspektive VEREINIGTES KÖNIGREICH (Milliarden USD, 2019-2032)

    • Markt für semantische Wissensgraphen im VEREINIGTEN KÖNIGREICH nach Anwendungstyp

      • Datenintegration

      • Künstliche Intelligenz

      • Business Intelligence

      • Suche und Navigation

    • Markt für semantische Wissensgraphen im VEREINIGTEN KÖNIGREICH nach Bereitstellungstyp

      • Vor Ort

      • Cloud-basiert

    • Markt für semantische Wissensgraphen im VEREINIGTEN KÖNIGREICH nach Endnutzungstyp

      • Gesundheitswesen

      • Finanzen

      • Einzelhandel

      • Telekommunikation

    • Markt für semantische Wissensgraphen im VEREINIGTEN KÖNIGREICH nach Technologietyp

      • Verarbeitung natürlicher Sprache

      • Maschinenlernen

      • Graphdatenbanken

    • Perspektive FRANKREICH (Milliarden USD, 2019-2032)

    • Markt für semantische Wissensgraphen in FRANKREICH nach Anwendungstyp

      • Datenintegration

      • Künstliche Intelligenz

      • Business Intelligence

      • Suche und Navigation

    • Markt für semantische Wissensgraphen in FRANKREICH nach Bereitstellungstyp

      • Vor Ort

      • Cloud-basiert

    • Markt für semantische Wissensgraphen in FRANKREICH nach Endnutzungstyp

      • Gesundheitswesen

      • Finanzen

      • Einzelhandel

      • Telekommunikation

    • Markt für semantische Wissensgraphen in FRANKREICH nach Technologietyp

      • Verarbeitung natürlicher Sprache

      • Maschinenlernen

      • Graphdatenbanken

    • Perspektive RUSSLAND (Milliarden USD, 2019-2032)

    • Markt für semantische Wissensgraphen in RUSSLAND nach Anwendungstyp

      • Datenintegration

      • Künstliche Intelligenz

      • Business Intelligence

      • Suche und Navigation

    • Markt für semantische Wissensgraphen in RUSSLAND nach Bereitstellungstyp

      • Vor Ort

      • Cloud-basiert

    • Markt für semantische Wissensgraphen in RUSSLAND nach Endnutzungstyp

      • Gesundheitswesen

      • Finanzen

      • Einzelhandel

      • Telekommunikation

    • Markt für semantische Wissensgraphen in RUSSLAND nach Technologietyp

      • Verarbeitung natürlicher Sprache

      • Maschinenlernen

      • Graphdatenbanken

    • Perspektive ITALIEN (Milliarden USD, 2019-2032)

    • Markt für semantische Wissensgraphen in ITALIEN nach Anwendungstyp

      • Datenintegration

      • Künstliche Intelligenz

      • Business Intelligence

      • Suche und Navigation

    • Markt für semantische Wissensgraphen in ITALIEN nach Bereitstellungstyp

      • Vor Ort

      • Cloud-basiert

    • Markt für semantische Wissensgraphen in ITALIEN nach Endnutzungstyp

      • Gesundheitswesen

      • Finanzen

      • Einzelhandel

      • Telekommunikation

    • Markt für semantische Wissensgraphen in ITALIEN nach Technologietyp

      • Verarbeitung natürlicher Sprache

      • Maschinenlernen

      • Graphdatenbanken

    • Perspektive SPANIEN (Milliarden USD, 2019-2032)

    • Markt für semantische Wissensgraphen in SPANIEN nach Anwendungstyp

      • Datenintegration

      • Künstliche Intelligenz

      • Business Intelligence

      • Suche und Navigation

    • Markt für semantische Wissensgraphen in SPANIEN nach Bereitstellungstyp

      • Vor Ort

      • Cloud-basiert

    • Markt für semantische Wissensgraphen in SPANIEN nach Endnutzungstyp

      • Gesundheitswesen

      • Finanzen

      • Einzelhandel

      • Telekommunikation

    • Markt für semantische Wissensgraphen in SPANIEN nach Technologietyp

      • Verarbeitung natürlicher Sprache

      • Maschinenlernen

      • Graphdatenbanken

    • Perspektive REST VON EUROPA (Milliarden USD, 2019-2032)

    • Markt für semantische Wissensgraphen im REST VON EUROPA nach Anwendungstyp

      • Datenintegration

      • Künstliche Intelligenz

      • Business Intelligence

      • Suche und Navigation

    • Markt für semantische Wissensgraphen im REST VON EUROPA nach Bereitstellungstyp

      • Vor Ort

      • Cloud-basiert

    • Markt für semantische Wissensgraphen im REST VON EUROPA nach Endnutzungstyp

      • Gesundheitswesen

      • Finanzen

      • Einzelhandel

      • Telekommunikation

    • Markt für semantische Wissensgraphen im REST VON EUROPA nach Technologietyp

      • Verarbeitung natürlicher Sprache

      • Maschinenlernen

      • Graphdatenbanken

  • Perspektive APAC (Milliarden USD, 2019-2032)

    • Markt für semantische Wissensgraphen in APAC nach Anwendungstyp

      • Datenintegration

      • Künstliche Intelligenz

      • Business Intelligence

      • Suche und Navigation

    • Markt für semantische Wissensgraphen in APAC nach Bereitstellungstyp

      • Vor Ort

      • Cloud-basiert

    • Markt für semantische Wissensgraphen in APAC nach Endnutzungstyp

      • Gesundheitswesen

      • Finanzen

      • Einzelhandel

      • Telekommunikation

    • Markt für semantische Wissensgraphen in APAC nach Technologietyp

      • Verarbeitung natürlicher Sprache

      • Maschinenlernen

      • Graphdatenbanken

    • Markt für semantische Wissensgraphen in APAC nach regionalem Typ

      • China

      • Indien

      • Japan

      • Südkorea

      • Malaysia

      • Thailand

      • Indonesien

      • Rest von APAC

    • Perspektive CHINA (Milliarden USD, 2019-2032)

    • Markt für semantische Wissensgraphen in CHINA nach Anwendungstyp

      • Datenintegration

      • Künstliche Intelligenz

      • Business Intelligence

      • Suche und Navigation

    • Markt für semantische Wissensgraphen in CHINA nach Bereitstellungstyp

      • Vor Ort

      • Cloud-basiert

    • Markt für semantische Wissensgraphen in CHINA nach Endnutzungstyp

      • Gesundheitswesen

      • Finanzen

      • Einzelhandel

      • Telekommunikation

    • Markt für semantische Wissensgraphen in CHINA nach Technologietyp

      • Verarbeitung natürlicher Sprache

      • Maschinenlernen

      • Graphdatenbanken

    • Perspektive INDIEN (Milliarden USD, 2019-2032)

    • Markt für semantische Wissensgraphen in INDIEN nach Anwendungstyp

      • Datenintegration

      • Künstliche Intelligenz

      • Business Intelligence

      • Suche und Navigation

    • Markt für semantische Wissensgraphen in INDIEN nach Bereitstellungstyp

      • Vor Ort

      • Cloud-basiert

    • Markt für semantische Wissensgraphen in INDIEN nach Endnutzungstyp

      • Gesundheitswesen

      • Finanzen

      • Einzelhandel

      • Telekommunikation

    • Markt für semantische Wissensgraphen in INDIEN nach Technologietyp

      • Verarbeitung natürlicher Sprache

      • Maschinenlernen

      • Graphdatenbanken

    • Perspektive JAPAN (Milliarden USD, 2019-2032)

    • Markt für semantische Wissensgraphen in JAPAN nach Anwendungstyp

      • Datenintegration

      • Künstliche Intelligenz

      • Business Intelligence

      • Suche und Navigation

    • Markt für semantische Wissensgraphen in JAPAN nach Bereitstellungstyp

      • Vor Ort

      • Cloud-basiert

    • Markt für semantische Wissensgraphen in JAPAN nach Endnutzungstyp

      • Gesundheitswesen

      • Finanzen

      • Einzelhandel

      • Telekommunikation

    • Markt für semantische Wissensgraphen in JAPAN nach Technologietyp

      • Verarbeitung natürlicher Sprache

      • Maschinenlernen

      • Graphdatenbanken

    • Perspektive SÜDKOREA (Milliarden USD, 2019-2032)

    • Markt für semantische Wissensgraphen in SÜDKOREA nach Anwendungstyp

      • Datenintegration

      • Künstliche Intelligenz

      • Business Intelligence

      • Suche und Navigation

    • Markt für semantische Wissensgraphen in SÜDKOREA nach Bereitstellungstyp

      • Vor Ort

      • Cloud-basiert

    • Markt für semantische Wissensgraphen in SÜDKOREA nach Endnutzungstyp

      • Gesundheitswesen

      • Finanzen

      • Einzelhandel

      • Telekommunikation

    • Markt für semantische Wissensgraphen in SÜDKOREA nach Technologietyp

      • Verarbeitung natürlicher Sprache

      • Maschinenlernen

      • Graphdatenbanken

    • Perspektive MALAYSIA (Milliarden USD, 2019-2032)

    • Markt für semantische Wissensgraphen in MALAYSIA nach Anwendungstyp

      • Datenintegration

      • Künstliche Intelligenz

      • Business Intelligence

      • Suche und Navigation

    • Markt für semantische Wissensgraphen in MALAYSIA nach Bereitstellungstyp

      • Vor Ort

      • Cloud-basiert

    • Markt für semantische Wissensgraphen in MALAYSIA nach Endnutzungstyp

      • Gesundheitswesen

      • Finanzen

      • Einzelhandel

      • Telekommunikation

    • Markt für semantische Wissensgraphen in MALAYSIA nach Technologietyp

      • Verarbeitung natürlicher Sprache

      • Maschinenlernen

      • Graphdatenbanken

    • Perspektive THAILAND (Milliarden USD, 2019-2032)

    • Markt für semantische Wissensgraphen in THAILAND nach Anwendungstyp

      • Datenintegration

      • Künstliche Intelligenz

      • Business Intelligence

      • Suche und Navigation

    • Markt für semantische Wissensgraphen in THAILAND nach Bereitstellungstyp

      • Vor Ort

      • Cloud-basiert

    • Markt für semantische Wissensgraphen in THAILAND nach Endnutzungstyp

      • Gesundheitswesen

      • Finanzen

      • Einzelhandel

      • Telekommunikation

    • Markt für semantische Wissensgraphen in THAILAND nach Technologietyp

      • Verarbeitung natürlicher Sprache

      • Maschinenlernen

      • Graphdatenbanken

    • Perspektive INDONESIEN (Milliarden USD, 2019-2032)

    • Markt für semantische Wissensgraphen in INDONESIEN nach Anwendungstyp

      • Datenintegration

      • Künstliche Intelligenz

      • Business Intelligence

      • Suche und Navigation

    • Markt für semantische Wissensgraphen in INDONESIEN nach Bereitstellungstyp

      • Vor Ort

      • Cloud-basiert

    • Markt für semantische Wissensgraphen in INDONESIEN nach Endnutzungstyp

      • Gesundheitswesen

      • Finanzen

      • Einzelhandel

      • Telekommunikation

    • Markt für semantische Wissensgraphen in INDONESIEN nach Technologietyp

      • Verarbeitung natürlicher Sprache

      • Maschinenlernen

      • Graphdatenbanken

    • Perspektive REST VON APAC (Milliarden USD, 2019-2032)

    • Markt für semantische Wissensgraphen im REST VON APAC nach Anwendungstyp

      • Datenintegration

      • Künstliche Intelligenz

      • Business Intelligence

      • Suche und Navigation

    • Markt für semantische Wissensgraphen im REST VON APAC nach Bereitstellungstyp

      • Vor Ort

      • Cloud-basiert

    • Markt für semantische Wissensgraphen im REST VON APAC nach Endnutzungstyp

      • Gesundheitswesen

      • Finanzen

      • Einzelhandel

      • Telekommunikation

    • Markt für semantische Wissensgraphen im REST VON APAC nach Technologietyp

      • Verarbeitung natürlicher Sprache

      • Maschinenlernen

      • Graphdatenbanken

  • Perspektive Südamerika (Milliarden USD, 2019-2032)

    • Markt für semantische Wissensgraphen in Südamerika nach Anwendungstyp

      • Datenintegration

      • Künstliche Intelligenz

      • Business Intelligence

      • Suche und Navigation

    • Markt für semantische Wissensgraphen in Südamerika nach Bereitstellungstyp

      • Vor Ort

      • Cloud-basiert

    • Markt für semantische Wissensgraphen in Südamerika nach Endnutzungstyp

      • Gesundheitswesen

      • Finanzen

      • Einzelhandel

      • Telekommunikation

    • Markt für semantische Wissensgraphen in Südamerika nach Technologietyp

      • Verarbeitung natürlicher Sprache

      • Maschinenlernen

      • Graphdatenbanken

    • Markt für semantische Wissensgraphen in Südamerika nach regionalem Typ

      • Brasilien

      • Mexiko

      • Argentinien

      • Rest von Südamerika

    • Perspektive BRASILIEN (Milliarden USD, 2019-2032)

    • Markt für semantische Wissensgraphen in BRASILIEN nach Anwendungstyp

      • Datenintegration

      • Künstliche Intelligenz

      • Business Intelligence

      • Suche und Navigation

    • Markt für semantische Wissensgraphen in BRASILIEN nach Bereitstellungstyp

      • Vor Ort

      • Cloud-basiert

    • Markt für semantische Wissensgraphen in BRASILIEN nach Endnutzungstyp

      • Gesundheitswesen

      • Finanzen

      • Einzelhandel

      • Telekommunikation

    • Markt für semantische Wissensgraphen in BRASILIEN nach Technologietyp

      • Verarbeitung natürlicher Sprache

      • Maschinenlernen

      • Graphdatenbanken

    • Perspektive MEXIKO (Milliarden USD, 2019-2032)

    • Markt für semantische Wissensgraphen in MEXIKO nach Anwendungstyp

      • Datenintegration

      • Künstliche Intelligenz

      • Business Intelligence

      • Suche und Navigation

    • Markt für semantische Wissensgraphen in MEXIKO nach Bereitstellungstyp

      • Vor Ort

      • Cloud-basiert

    • Markt für semantische Wissensgraphen in MEXIKO nach Endnutzungstyp

      • Gesundheitswesen

      • Finanzen

      • Einzelhandel

      • Telekommunikation

    • Markt für semantische Wissensgraphen in MEXIKO nach Technologietyp

      • Verarbeitung natürlicher Sprache

      • Maschinenlernen

      • Graphdatenbanken

    • Perspektive ARGENTINIEN (Milliarden USD, 2019-2032)

    • Markt für semantische Wissensgraphen in ARGENTINIEN nach Anwendungstyp

      • Datenintegration

      • Künstliche Intelligenz

      • Business Intelligence

      • Suche und Navigation

    • Markt für semantische Wissensgraphen in ARGENTINIEN nach Bereitstellungstyp

      • Vor Ort

      • Cloud-basiert

    • Markt für semantische Wissensgraphen in ARGENTINIEN nach Endnutzungstyp

      • Gesundheitswesen

      • Finanzen

      • Einzelhandel

      • Telekommunikation

    • Markt für semantische Wissensgraphen in ARGENTINIEN nach Technologietyp

      • Verarbeitung natürlicher Sprache

      • Maschinenlernen

      • Graphdatenbanken

    • Perspektive REST VON SÜDAMERIKA (Milliarden USD, 2019-2032)

    • Markt für semantische Wissensgraphen im REST VON SÜDAMERIKA nach Anwendungstyp

      • Datenintegration

      • Künstliche Intelligenz

      • Business Intelligence

      • Suche und Navigation

    • Markt für semantische Wissensgraphen im REST VON SÜDAMERIKA nach Bereitstellungstyp

      • Vor Ort

      • Cloud-basiert

    • Markt für semantische Wissensgraphen im REST VON SÜDAMERIKA nach Endnutzungstyp

      • Gesundheitswesen

      • Finanzen

      • Einzelhandel

      • Telekommunikation

    • Markt für semantische Wissensgraphen im REST VON SÜDAMERIKA nach Technologietyp

      • Verarbeitung natürlicher Sprache

      • Maschinenlernen

      • Graphdatenbanken

  • Perspektive MEA (Milliarden USD, 2019-2032)

    • Markt für semantische Wissensgraphen in MEA nach Anwendungstyp

      • Datenintegration

      • Künstliche Intelligenz

      • Business Intelligence

      • Suche und Navigation

    • Markt für semantische Wissensgraphen in MEA nach Bereitstellungstyp

      • Vor Ort

      • Cloud-basiert

    • Markt für semantische Wissensgraphen in MEA nach Endnutzungstyp

      • Gesundheitswesen

      • Finanzen

      • Einzelhandel

      • Telekommunikation

    • Markt für semantische Wissensgraphen in MEA nach Technologietyp

      • Verarbeitung natürlicher Sprache

      • Maschinenlernen

      • Graphdatenbanken

    • Markt für semantische Wissensgraphen in MEA nach regionalem Typ

      • GCC-Länder

      • Südafrika

      • Rest von MEA

    • Perspektive GCC-LÄNDER (Milliarden USD, 2019-2032)

    • Markt für semantische Wissensgraphen in GCC-LÄNDERN nach Anwendungstyp

      • Datenintegration

      • Künstliche Intelligenz

      • Business Intelligence

      • Suche und Navigation

    • Markt für semantische Wissensgraphen in GCC-LÄNDERN nach Bereitstellungstyp

      • Vor Ort

      • Cloud-basiert

    • Markt für semantische Wissensgraphen in GCC-LÄNDERN nach Endnutzungstyp

      • Gesundheitswesen

      • Finanzen

      • Einzelhandel

      • Telekommunikation

    • Markt für semantische Wissensgraphen in GCC-LÄNDERN nach Technologietyp

      • Verarbeitung natürlicher Sprache

      • Maschinenlernen

      • Graphdatenbanken

    • Perspektive SÜDAFRIKA (Milliarden USD, 2019-2032)

    • Markt für semantische Wissensgraphen in SÜDAFRIKA nach Anwendungstyp

      • Datenintegration

      • Künstliche Intelligenz

      • Business Intelligence

      • Suche und Navigation

    • Markt für semantische Wissensgraphen in SÜDAFRIKA nach Bereitstellungstyp

      • Vor Ort

      • Cloud-basiert

    • Markt für semantische Wissensgraphen in SÜDAFRIKA nach Endnutzungstyp

      • Gesundheitswesen

      • Finanzen

      • Einzelhandel

      • Telekommunikation

    • Markt für semantische Wissensgraphen in SÜDAFRIKA nach Technologietyp

      • Verarbeitung natürlicher Sprache

      • Maschinenlernen

      • Graphdatenbanken

    • Perspektive REST VON MEA (Milliarden USD, 2019-2032)

    • Markt für semantische Wissensgraphen im REST VON MEA nach Anwendungstyp

      • Datenintegration

      • Künstliche Intelligenz

      • Business Intelligence

      • Suche und Navigation

    • Markt für semantische Wissensgraphen im REST VON MEA nach Bereitstellungstyp

      • Vor Ort

      • Cloud-basiert

    • Markt für semantische Wissensgraphen im REST VON MEA nach Endnutzungstyp

      • Gesundheitswesen

      • Finanzen

      • Einzelhandel

      • Telekommunikation

    • Markt für semantische Wissensgraphen im REST VON MEA nach Technologietyp

      • Verarbeitung natürlicher Sprache

      • Maschinenlernen

      • Graphdatenbanken

Compare Licence

×
Features License Type
Single User Multiuser License Enterprise User
Price $4,950 $5,950 $7,250
Maximum User Access Limit 1 User Upto 10 Users Unrestricted Access Throughout the Organization
Free Customization
Direct Access to Analyst
Deliverable Format
Platform Access
Discount on Next Purchase 10% 15% 15%
Printable Versions