Augmented Reality Mixed Reality Market Summary
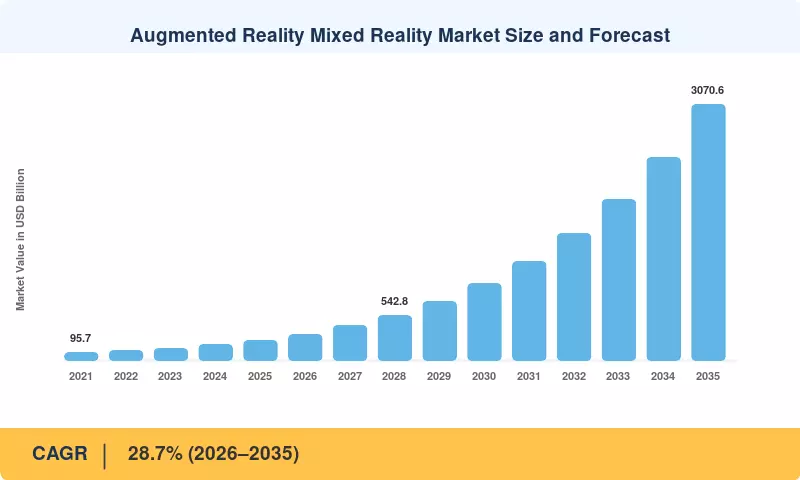
The Augmented Reality Mixed Reality Market was valued at USD 241.5 billion in 2025 and is projected to reach USD 316.8 billion in 2026, rising to USD 3,070.6 billion by 2035 at a CAGR of 28.7% over 2026–2035. Two catalysts anchor the outlook. Commercial 5G coverage keeps widening, with Ericsson projecting about 6.3 billion 5G subscriptions by 2030 [1]. China's national action plan for virtual reality and industry integration targets an industry scale above RMB 350 billion by 2026 [8].
Legacy tools are being displaced. Paperwork instructions, 2D CAD reviews on desktop monitors, and travel-heavy field service are giving way to head-worn displays that anchor digital content to physical space, a shift the industry now calls spatial computing. Capital is following the shift: Meta's Reality Labs posted an operating loss of roughly USD 17.7 billion in 2024 as the company kept funding headsets, glasses, and neural interfaces [4], while Apple, Samsung, and Google have each launched premium platforms since 2024 [5][7].
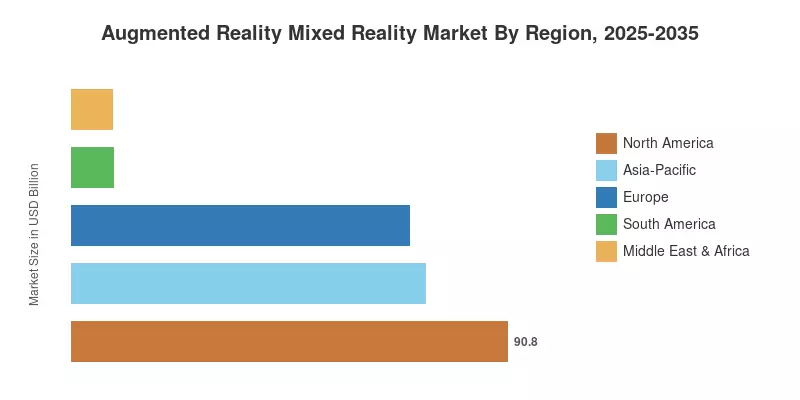
North America holds the largest share at 37.6% in 2025, supported by enterprise software budgets and defense training programs. Asia-Pacific is the fastest-growing region at a 30.5% CAGR, driven by device manufacturing depth in China and South Korea. Europe ranks second with USD 70.3 billion in 2025, led by industrial digitalization in Germany and the UK. Over the next decade, lighter glasses and on-device AI assistants should move the Augmented Reality Mixed Reality Market from pilot-heavy adoption to everyday use.
Key Report Takeaways
• By Component
- Hardware accounted for 56.8% of the Augmented Reality Mixed Reality Market in 2025, reflecting premium headset and optics pricing
- Services are forecast to grow at a 30.4% CAGR through 2035 as buyers shift to managed device fleets and content subscriptions
• By Device Type
- Stand-Alone Head-Mounted Display (HMD) units held 44.6% revenue share in 2025
- Smart Glasses are projected to expand at a 30.8% CAGR, the fastest among device types
• By End-user Industry
-
Gaming and Entertainment captured 38.9% of the Augmented Reality Mixed Reality Market in 2025
- Healthcare is set to grow at a 30.1% CAGR on surgical visualization and clinical training demand
• By Application
- Remote Collaboration and Assistance led applications with 26.1% share in 2025
- Training and Simulation is the fastest-growing application at a 29.6% CAGR
• By Region
- North America held 37.6% share in 2025
- Asia-Pacific is forecast to grow at a 30.5% CAGR over 2026–2035
- Europe generated USD 70.3 billion in 2025
Market Size and Forecast (2021–2035)
Market Research Future built the Augmented Reality Mixed Reality Market estimate bottom-up from device shipments, average selling prices, software licensing, and services contract values, then cross-checked results against vendor filings, Counterpoint shipment trackers, and interviews with system integrators and component suppliers [11]. Historical values cover 2021–2024, 2025 is the base year, and 2026–2035 is the forecast window. Growth peaks in 2026 as new Android XR devices and AI-enabled glasses reach volume, then moderates as the installed base matures and average selling prices fall.
Driver Impact Analysis
| Driver |
~% Impact on CAGR |
Geographic Relevance |
Impact Timeline |
Ref |
| Enterprise remote assistance ROI |
~+5.6% |
North America, Europe |
Short-term (≤2 yr) |
[3] |
| 5G and edge compute rollout |
~+4.8% |
Global; strongest in Asia-Pacific |
Medium-term (2–4 yr) |
[1][2] |
| Display and waveguide cost decline |
~+4.1% |
Global; supply base in Asia-Pacific |
Medium-term (2–4 yr) |
[5][7][16] |
| Platform competition among ecosystem owners |
~+3.9% |
Global |
Short-term (≤2 yr) |
[4][6][7] |
| Generative AI for 3D content creation |
~+3.5% |
Global |
Long-term (≥4 yr) |
[10] |
| Government industrial digitalization programs |
~+3.2% |
Asia-Pacific, Middle East & Africa |
Medium-term (2–4 yr) |
[8][22][23] |
| Clinical adoption in healthcare |
~+2.7% |
North America, Europe |
Long-term (≥4 yr) |
[9][10] |
Enterprise Remote Assistance ROI
The most obvious payback is provided by field service and maintenance crews. After integrating RealWear head-mounted tablets with Microsoft Teams to enable professionals to mentor plant workers remotely, Mars Petcare reduced coaching trip expenses by 35% [3]. Similar outcomes are seen in the manufacturing of pharmaceuticals, utilities, and aircraft MRO, where each site visit avoided saves expert hours, flights, and downtime. Procurement teams can justify fleets of hundreds of devices without waiting for more comprehensive transformation results because savings appear in the first budget cycle.
5G and Edge Compute Rollout
Low-latency networks reduce the size of onboard CPUs and batteries by allowing lightweight devices to outsource rendering and AI inference to the edge. According to GSMA, operators will invest over USD 1.5 trillion in networks between 2023 and 2030, primarily in 5G [2]. Ericsson projects that 5G subscriptions will reach approximately 6.3 billion by 2030 [1]. By providing industrial users with deterministic connectivity for multi-user sessions, private 5G in ports and factories eliminates a common obstacle to scaled deployments.
Display and Waveguide Cost Decline
Displays and optics rank among the costliest components in premium headsets, and prices are falling. Samsung priced Galaxy XR at USD 1,799 in 2025, roughly half of Apple Vision Pro's USD 3,499 launch price [5][7]. Silicon-carbide and resin waveguides are moving from lab to volume lines, and Qualcomm's AR1+ Gen 1 chip moves more processing onto the glasses themselves [16]. Each step down in cost opens new buyer segments, particularly frontline enterprise roles.
Platform Competition Among Ecosystem Owners
Rivalry among ecosystem owners accelerates product cycles and developer funding. Meta absorbed an operating loss of about USD 17.7 billion at Reality Labs in 2024 while pricing Quest 3S at USD 299 [4]. Google opened Android XR to hardware partners in December 2024 [6], and Samsung shipped the first device on the platform in October 2025 [7]. Competing app stores, toolkits, and subsidies lower entry costs for developers and widen the content catalog available to buyers.
Generative AI for 3D Content Creation
Content creation has long been the slowest and costliest part of any deployment. Generative models now convert CAD files, photographs, and text prompts into usable 3D assets in minutes rather than weeks. Links about USD 294 billion of potential 2030 GDP uplift from immersive tools to training and development alone [10], and cheaper authoring is what unlocks that value. Lower costs matter most for training modules, where enterprises need hundreds of scenario variants.
Government Industrial Digitalization Programs
Public programs create anchor demand and local supply chains. China's five-ministry action plan targets more than 25 million VR terminal sales and an industry scale above RMB 350 billion by 2026 [8]. Saudi Arabia's Vision 2030 funds digital skills and giga-project design work that uses immersive visualization [22], while India's semiconductor mission, backed by about INR 76,000 crore, supports display and electronics assembly capacity [23]. These programs lower costs and seed early enterprise adopters.
Clinical Adoption in Healthcare
Hospitals are moving from demonstrations to procurement. The FDA maintains a public list of AR- and VR-enabled medical devices that now spans dozens of authorized products across surgery, radiology, and pain management [9]. Surgeons use head-worn overlays to view 3D scans without turning to wall monitors, and nursing schools report better skill retention from simulation. Estimates immersive tools could add USD 350.9 billion to healthcare-related GDP by 2030 [10], sustaining long-term demand.
Restraints Impact Analysis
| Restraint |
~% Impact on CAGR |
Geographic Relevance |
Impact Timeline |
Ref |
| High device prices and slow replacement cycles |
~−3.6% |
Global; acute in emerging markets |
Short-term (≤2 yr) |
|
| Ergonomics, motion sickness, and battery limits |
~−2.4% |
Global |
Medium-term (2–4 yr) |
[5] |
| Privacy and biometric data regulation |
~−2.1% |
Europe, North America |
Medium-term (2–4 yr) |
[13][14] |
| Content fragmentation and developer economics |
~−1.9% |
Global |
Medium-term (2–4 yr) |
[21] |
| Supply chain concentration and trade restrictions |
~−1.5% |
North America, Asia-Pacific |
Long-term (≥4 yr) |
[19] |
High Device Prices and Slow Replacement Cycles
Most households are still unable to afford high-end headsets. There was a 12% drop in shipments of VR headsets worldwide in 2024 as buyers awaited less expensive devices. The flagship gadgets are more expensive than the majority of laptops and smartphones, with the Vision Pro debuting at USD 3,499 and the Galaxy XR at USD 1,799. Refresh-driven income is slowed because many buyers keep handsets for three years or more.
Ergonomics, Motion Sickness, and Battery Limits
The duration of a session is still limited by comfort. After 30 to 60 minutes, many users report experiencing nausea or eye discomfort, and during full shifts, headsets weighing more than 500 grams cause neck fatigue. In industrial settings, tethering or battery swaps are necessary because Apple rated the Vision Pro's external battery for up to two hours of general use [5]. All-day wear will be restricted to lightweight glasses until weight and runtime improve.
Privacy and Biometric Data Regulation
Headsets and glasses collect eye movement, hand geometry, room scans, and sometimes faces. Under GDPR, violations can draw fines of up to 4% of global annual turnover [13], and Illinois' Biometric Information Privacy Act allows damages of USD 1,000 to USD 5,000 per violation [14]. Compliance reviews lengthen enterprise sales cycles, and some features ship later in regulated markets.
Content Fragmentation and Developer Economics
Developers face multiple runtimes, app stores, and input schemes. A title built for Quest may need significant rework for visionOS or Android XR, and small installed bases on newer platforms limit revenue per title. Unity's 2024 restructuring, which cut roughly 25% of its workforce, showed how thin margins in real-time 3D tooling can be [21]. Fragmentation slows the flow of new enterprise and consumer content.
Supply Chain Concentration and Trade Restrictions
Micro-displays, waveguides, and advanced chips come from a handful of suppliers concentrated in East Asia. U.S. export controls and tariff actions on electronics add cost uncertainty, while the CHIPS and Science Act's USD 52.7 billion program will take years to shift capacity [19]. A single supplier disruption can delay device launches by quarters and squeeze margins for smaller brands.
Augmented Reality Mixed Reality Market Opportunities
AI-First Smart Glasses for Everyday Use
Camera-and-audio glasses with voice assistants are the first head-worn category to sell at consumer scale. EssilorLuxottica reported that Ray-Ban Meta revenue more than tripled year-on-year in the first half of 2025 [18], and Meta added a display-equipped model at USD 799 in September 2025. Vendors that pair prescription eyewear distribution with AI services can reach users who would never buy a headset.
Emerging Markets: Smartphone-Led Adoption in India and ASEAN
India and Southeast Asia combine large smartphone bases, young populations, and rising data consumption, yet headset penetration remains low. Phone-based AR for retail try-on, education, and agritech advisory can build habits before glasses become affordable. India's semiconductor and electronics incentives [23] support local assembly that could push entry-level glasses below USD 300. India's 34.1% CAGR signals the size of the gap.
XR-as-a-Service and Data Monetization
Buyers increasingly prefer operating-expense models that bundle hardware, device management, content, and analytics. Subscription fleet platforms and per-seat remote-assistance licenses turn one-time device sales into recurring revenue. Anonymized operational data, such as task completion times, error rates, and gaze heatmaps, can feed productivity benchmarks and insurer safety scoring, provided vendors meet GDPR and AI Act obligations [12][13].
Surgical Navigation and Clinical Training
Operating rooms offer high-value, reimbursement-supported demand. Head-worn navigation for spine and orthopedic procedures reduces the need to look away at monitors, and FDA-authorized systems give hospitals a clear regulatory path to purchase [9]. Medical schools facing faculty shortages can scale simulation without expanding cadaver labs. Healthcare's 30.1% CAGR makes it the most attractive end-user growth pocket.
Industrial Digital Twins and Defense Training
Factories, utilities, and defense forces are linking head-worn displays to digital twins of plants and equipment. The U.S. Army's IVAS program, transferred from Microsoft to Anduril in 2025 [15], shows continued military appetite for soldier-worn mixed reality. Civilian operators can apply the same architecture to inspection, commissioning, and emergency drills, a use case well suited to Middle East giga-projects.
Augmented Reality Mixed Reality Market Future Outlook
AI-Native Interfaces Replace Menus
Multimodal AI assistants will become the primary interface on head-worn devices, reading the scene through cameras and answering by voice. Gemini on Android XR and Meta AI on Ray-Ban glasses point the way [6][18]. By the early 2030s, Market Research Future expects most new devices to ship with an on-device assistant, steering the Augmented Reality Mixed Reality Market toward context-aware services. The World Economic Forum expects 39% of workers' core skills to change by 2030, raising demand for on-the-job guidance [24].
Platform Economics and App Store Control
Three ecosystems now compete: Meta's Horizon OS, Apple's visionOS, and Google's Android XR. Smartphone-style winner-take-most outcomes may not repeat, because enterprises value device-agnostic fleet software and open standards such as OpenXR. Revenue will tilt toward software and services, whose 30.4% CAGR outpaces hardware. Expect more bundling of devices with productivity suites and cloud subscriptions.
Optics, Displays, and the Semiconductor Supply Chain
Display innovation sets the pace of adoption. Over the forecast period, waveguides, micro-LED projectors, and holographic displays should bring full-color AR glasses close to the weight of ordinary eyewear; Meta's Orion prototype already delivers a 70-degree field of view [17]. Governments are subsidizing this supply chain, with the U.S. CHIPS Act committing USD 52.7 billion [19] and India and China funding local display and chip capacity [8][23].
Sustainability and Responsible Hardware Design
Environmental reporting will increasingly reach device makers in the Augmented Reality Mixed Reality Market. The EU's Corporate Sustainability Reporting Directive requires large companies to disclose value-chain emissions, and replacing business travel with remote assistance gives buyers measurable reductions to report. Short device lifecycles raise e-waste concerns, and the EU's 2024 right-to-repair rules will push vendors toward replaceable batteries, modular parts, and certified refurbishment programs.
Regional Market Share Analysis
| Region |
Key Metric |
Primary Investment Themes |
| North America |
37.6% share |
Enterprise remote assistance, defense training, platform R&D |
| Europe |
USD 70.3 Billion |
Industrial digital twins, automotive design, medical devices |
| Asia-Pacific |
30.5% CAGR |
Device manufacturing, gaming, government VR programs |
| South America |
3.6% share |
Mobile AR retail, mining and energy field service |
| Middle East & Africa |
USD 8.5 Billion |
Giga-project visualization, smart government, workforce training |
| Total |
USD 241.5 Billion |
— |
North America leads the Augmented Reality Mixed Reality Market on enterprise spending and platform ownership, while Asia-Pacific grows fastest on manufacturing depth and state programs. Europe follows with industrial and automotive adoption; South America and Middle East & Africa are smaller but expanding from low bases.
North America
| Country |
Key Metric |
Key Driver |
| US |
84.1% of regional share |
Platform owners, enterprise software, defense programs |
| Canada |
27.9% CAGR |
Mining and energy remote assistance, game studios |
| Mexico |
USD 6.1 Billion |
Automotive and electronics plant training |
The US hosts the headquarters of Meta, Apple, Microsoft, Google, and Qualcomm, giving the Augmented Reality Mixed Reality Market its deepest developer and capital base in this region. Defense remains a steady buyer: the Army's IVAS program carried a potential value of up to about USD 22 billion over ten years when first awarded [15]. Canada's Montreal and Vancouver game-studio clusters feed content supply, and Mexico's nearshoring boom is bringing headset-guided training to automotive and electronics assembly lines.
Europe
| Country |
Key Metric |
Key Driver |
| Germany |
22.4% of regional share |
Automotive design, Industrie 4.0 programs |
| UK |
USD 14.2 Billion |
Healthcare, defense, creative industries |
| France |
27.6% CAGR |
Aerospace MRO, luxury retail |
| Italy |
9.1% of regional share |
Manufacturing, cultural heritage |
| Spain |
USD 5.4 Billion |
Tourism, telecom-led 5G pilots |
| Nordic Countries |
29.0% CAGR |
High digital literacy, maritime and energy |
| Russia |
4.3% of regional share |
Domestic substitution under sanctions |
| Rest of Europe |
USD 8.4 Billion |
Central European manufacturing |
Germany's carmakers and machine builders use head-worn displays for design reviews and assembly training, which anchors the region's enterprise demand. Regulation shapes product design more here than elsewhere, with GDPR pushing vendors toward on-device processing and strict consent flows [13]. The Nordic Countries grow fastest on digital literacy and maritime use cases, while Russia increasingly relies on domestic and Chinese devices after sanctions curtailed Western supply.
Asia-Pacific
| Country |
Key Metric |
Key Driver |
| China |
41.5% of regional share |
Device manufacturing, national VR action plan |
| India |
34.1% CAGR |
Smartphone AR, electronics incentives |
| Japan |
USD 10.6 Billion |
Consumer electronics, gaming, eldercare training |
| South Korea |
11.8% of regional share |
Samsung platform, display supply chain |
| ASEAN |
32.6% CAGR |
Retail, tourism, manufacturing relocation |
| Rest of Asia-Pacific |
USD 6.5 Billion |
Australian mining and defense |
Asia-Pacific is the fastest-growing region of the Augmented Reality Mixed Reality Market because it both builds and buys the hardware. China's action plan sets a target of more than 25 million VR terminal sales by 2026 [8], and domestic brands such as Pico, XREAL, and Rokid compete aggressively on price. South Korea supplies micro-OLED panels and memory, with Galaxy XR anchoring a domestic platform [7], while Japan's Sony leads in micro-displays and console gaming.
South America
| Country |
Key Metric |
Key Driver |
| Brazil |
58.2% of regional share |
Retail, agribusiness, mining |
| Argentina |
26.8% CAGR |
Software services, education |
| Rest of South America |
USD 2.2 Billion |
Chilean and Peruvian mining |
Brazil dominates regional spending, with retailers and banks deploying phone-based AR for product visualization and customer engagement. Import duties raise headset prices well above U.S. levels, so smartphone AR and enterprise leasing models prevail. Mining operators in Chile and Peru adopt remote assistance to reduce expert travel to high-altitude sites, echoing the 35% travel savings documented in manufacturing deployments [3].
Middle East & Africa
| Country |
Key Metric |
Key Driver |
| Saudi Arabia |
31.4% CAGR |
Vision 2030 giga-projects, workforce training |
| UAE |
24.7% of regional share |
Smart government, retail, tourism |
| South Africa |
USD 1.3 Billion |
Mining, higher education |
| Egypt |
7.9% of regional share |
Construction, outsourcing centers |
| Rest of MEA |
USD 2.0 Billion |
Qatar and Israel technology ecosystems |
Saudi Arabia's Vision 2030 programs fund digital skills and large construction projects that use immersive visualization for design coordination and safety training [22]. The UAE positions Dubai and Abu Dhabi as testbeds for smart-government services and retail experiences. South Africa's mining houses deploy head-worn devices for remote inspection, while Egypt's construction and outsourcing sectors create early demand in North Africa.
Augmented Reality Mixed Reality Market Segmentation
By Component
| Segment |
Key Metric |
Primary Demand Driver |
| Hardware |
56.8% share |
Premium headsets, optics, and sensors |
| Software |
USD 60.1 Billion |
Development platforms, operating systems, enterprise apps |
| Services |
30.4% CAGR |
Managed fleets, content authoring, integration |
Hardware leads the Augmented Reality Mixed Reality Market because head-mounted displays, micro-OLED panels, and depth sensors carry high unit prices, and new launches from Apple, Samsung, and Meta keep average selling prices elevated. Services grow fastest as buyers move to subscription device management, content authoring, and help-desk support. Software sits between the two, spanning engines, operating systems, and remote-assistance applications that monetize the installed base through recurring licenses.
By Device Type
| Segment |
Key Metric |
Primary Demand Driver |
| Stand-Alone Head-Mounted Display (HMD) |
44.6% share |
All-in-one convenience with no PC required |
| Tethered/Console-linked HMD |
USD 52.4 Billion |
High-fidelity simulation, PC and console gaming |
| Smart Glasses |
30.8% CAGR |
Lightweight AI glasses, waveguide miniaturization |
| Other Devices |
14.3% share |
Phone- and tablet-based AR, projection systems |
Within the Augmented Reality Mixed Reality Market, stand-alone headsets dominate because onboard chips now handle rendering without a PC, simplifying enterprise roll-outs and consumer setup. Smart Glasses post the fastest growth as waveguides shrink and AI assistants give users a reason to wear glasses all day. Tethered/Console-linked HMD units retain value in flight simulation, engineering visualization, and PlayStation VR2 gaming, where fidelity outweighs mobility.
By End-user Industry
| Segment |
Key Metric |
Primary Demand Driver |
| Gaming and Entertainment |
38.9% share |
Large consumer headset base, location-based venues |
| Healthcare |
30.1% CAGR |
Surgical navigation, imaging overlays, clinical simulation |
| Education and Training |
USD 35.3 Billion |
Virtual labs, vocational training |
| Retail and E-Commerce |
11.8% share |
Virtual try-on, in-store visualization |
| Industrial and Manufacturing |
29.3% CAGR |
Assembly guidance, maintenance, digital twins |
| Other End-user Industries |
USD 21.3 Billion |
Defense, architecture, real estate |
Gaming and Entertainment remains the largest end-user group in the Augmented Reality Mixed Reality Market, built on Quest's installed base, location-based venues, and live-event content. Healthcare grows fastest as surgical navigation, imaging overlays, and nursing simulation move into hospital budgets with regulatory clearance [9]. Education and Training, Retail and E-Commerce, and Industrial and Manufacturing each add steady demand, with virtual try-on and assembly guidance the leading use cases.
By Application
| Segment |
Key Metric |
Primary Demand Driver |
| Remote Collaboration and Assistance |
26.1% share |
Expert guidance, travel reduction |
| Design and Visualization |
USD 54.1 Billion |
CAD review, architecture, product design |
| Training and Simulation |
29.6% CAGR |
Workforce upskilling, safety drills |
| Marketing and Advertising |
16.5% share |
Virtual try-on, branded experiences |
| Other Applications |
USD 33.1 Billion |
Navigation, maintenance documentation |
Remote Collaboration and Assistance leads applications in the Augmented Reality Mixed Reality Market because it delivers measurable savings in the first year of deployment. Training and Simulation grows fastest, driven by labor shortages, stricter safety rules, and the falling cost of AI-generated scenarios. Design and Visualization keeps strong demand in automotive, aerospace, and architecture, where teams review full-scale 3D models before committing to tooling.
Competitive Benchmarking
The Augmented Reality Mixed Reality Market shows medium concentration. Market Research Future estimates the Herfindahl-Hirschman Index at roughly 750–950 and the top five vendors' combined share at about 45–52%, with Meta leading consumer headsets and glasses, Apple anchoring the premium tier, and Microsoft, Samsung, and Sony holding strong enterprise or gaming positions. A long tail of optics suppliers, rugged enterprise device makers, and software platforms keeps the field fragmented below the top tier.
| Company |
Est. Revenue Share Range |
Key Offerings for Augmented Reality and Mixed Reality |
Strategic Positioning |
| Meta Platforms, Inc. |
~16–20% |
Quest 3 and 3S, Ray-Ban Meta glasses, Horizon OS |
Volume leader subsidizing hardware to build platform scale |
| Apple Inc. |
~9–12% |
Vision Pro, visionOS |
Premium tier with tight hardware–software integration |
| Microsoft Corporation |
~6–9% |
HoloLens 2, Dynamics 365 Guides, Mesh, Azure |
Pivoting to software and cloud after IVAS transfer |
| Samsung Electronics Co., Ltd. |
~5–8% |
Galaxy XR, micro-OLED and OLED panels |
Android XR launch partner and component supplier |
| Sony Group Corporation |
~4–6% |
PlayStation VR2, micro-OLED displays, XYN headset |
Gaming franchise plus display supply |
| Alphabet Inc. (Google) |
~3–5% |
Android XR, ARCore, Gemini |
Platform licensor to device OEMs |
| Qualcomm Technologies, Inc. |
~3–5% |
Snapdragon XR2+ Gen 2, AR1+ Gen 1 |
Default chipset across Android headsets and glasses |
| Magic Leap, Inc. |
~1–2% |
Magic Leap 2, waveguide licensing |
Enterprise devices and optics IP partner |
| PTC Inc. |
~1–2% |
Vuforia platform |
Industrial AR software leader |
| Snap Inc. |
~1–2% |
Spectacles, Lens Studio, Snap OS |
Developer-first AR glasses strategy |
| Seiko Epson Corporation |
~1–2% |
Moverio smart glasses |
Industrial and drone-operation glasses |
| RealWear, Inc. |
~0.5–1.5% |
Navigator hands-free wearables |
Rugged frontline remote assistance |
Recent News & Developments
- Apple (June 2023): Unveiled Vision Pro at WWDC and began U.S. sales in February 2024 at USD 3,499, establishing a premium price anchor and a new developer platform [5]
- Meta (September 2024): Showed the Orion AR glasses prototype and launched Quest 3S at USD 299, signaling a dual strategy of affordable headsets and future glasses [17]
- Snap (September 2024): Released fifth-generation Spectacles with Snap OS to developers, extending its glasses roadmap toward a consumer launch [25]
- Google (December 2024): Introduced Android XR with Samsung and Qualcomm, opening a licensable platform for headsets and glasses [6]
- Microsoft and Anduril (February 2025): Agreed to move the U.S. Army IVAS program to Anduril, with Microsoft shifting to cloud and AI support [15]
- Qualcomm (June 2025): Announced the AR1+ Gen 1 chip, enabling more on-glass AI processing and reducing dependence on paired phones [16]
- Meta and EssilorLuxottica (September 2025): Launched Meta Ray-Ban Display glasses with a neural wristband at USD 799, the first mass-market display-equipped AI glasses [18]
- Samsung (October 2025): Released Galaxy XR at USD 1,799, the first Android XR headset, widening premium-tier competition [7]





 Noah Malgeri
Co-Founder

 Peter Groot koerkamp
Account and Business Manager

 Younghwan Choi
Senior Retail Manager

 Mark Irwin
Management Consultant

 Akif Moroglu
Strategy & Business Development Director

 Guilherme Gomes Martins
Product Management Director

 Joseph Aguayo
Sales Operations & Pricing Manager

 La Terria Dodd
Program Support Specialist

 Rob Kooiker
Group Product Manager HVAC & Fire Protection GMA


