Request Free Sample ×

Kindly complete the form below to receive a free sample of this Report

* Please use a valid business email

Leading companies partner with us for data-driven Insights

clients tt-cursor
Hero Background

Healthcare Business Intelligence Market

ID: MRFR/HC/6075-HCR
90 Pages
Vikita Thakur
April 2026

医疗保健商业智能市场研究报告信息按组件(平台、软件和服务)、按功能(OLAP 和可视化、绩效管理)和按地区(北美、欧洲、亚太地区和世界其他地区)划分 - 市场预测至 2034 年

分享
Download PDF ×

We do not share your information with anyone. However, we may send you emails based on your report interest from time to time. You may contact us at any time to opt-out.

Healthcare Business Intelligence Market Infographic
Purchase Options

全球医疗保健商业智能市场概览

p根据 MRFR 分析,2024 年医疗保健商业智能市场规模估计为 33.8(亿美元)。医疗保健商业智能市场行业预计将从 2025 年的 38.9(亿美元)增长到 2034 年的 139.2(亿美元),预测期内(2025 - 2034 年)的复合年增长率预计约为 15.22%。知名市场参与者越来越多地采用基于云的医疗保健商业智能工具,包括客户关系管理 (CRM) 应用程序和患者参与 CRM,因为它们具有灵活性和可访问性等特性,是促进市场增长的关键市场驱动力。

医疗保健商业智能市场概览 2025-2034

来源:二手资料研究、一手资料研究、MRFR 数据库和分析师评论

2024 年 6 月,Auscura 是一家专注于尖端医疗保健技术解决方案的知名公司,很高兴推出其最新服务 - 数据视觉服务。 Auscura 利用其在数据转换方面的丰富经验和专业知识,利用先进的自动化和人工智能 (AI) 的力量,帮助企业充分发挥其数据的潜力。该工具使医疗保健从业者能够将复杂的统计数据转化为实用的见解,从而改善基于价值的护理的各个方面:质量、利用率、效率、满意度和团队合作 (QUEST)。


2023 年 11 月,IT 公司 Wipro 宣布与 NVIDIA 合作,帮助医疗保健组织加快使用生成人工智能 (AI)。Wipro 将利用 NVIDIA 专为企业设计的人工智能 (AI) 软件,在其现有的平价医疗法案 (ACA)、医疗保险和医疗补助医疗解决方案系列中开发 AI 功能。通过将这些技术与 Wipro 的企业生成人工智能 (WeGA) 平台相结合,Wipro 将能够协作设计和实施语音和翻译 AI 的个性化模型,以及其他语言和学习模型 (LLM)。该协议将使两家公司能够大规模地为医疗保健行业提供人工智能创新,并推广具有先进计算能力的医疗保健解决方案。

医疗保健商业智能市场趋势

p先进技术的采用日益增多,推动市场增长

医疗保健行业的技术进步和发展为医疗保健商业智能市场提供了增长前景。医疗保健商业智能适用于医疗保健商业智能领域,因为它有助于管理财务方面以及患者护理。此外,由于医疗保健行业中不同平台和设备的日益普及,医疗保健商业智能市场正在不断扩大。通过医疗保健商业智能软件和工具收集的数据和信息有助于提供最好的患者护理和治疗。

此外,采用基于云的软件使医院、医疗服务提供者、付款人和生命科学制造商能够将其数据转换为富有洞察力的仪表板和图表,从而推动市场增长。例如,2020 年 3 月,澳大利亚卫生部推出了“澳大利亚冠状病毒”应用程序 (Coronavirus Australia App),该应用程序利用 Google Cloud 实时提供有关病毒传播模式、封锁和限制措施以及 COVID-19 医疗保健信息的具体信息。交互式图表和仪表板使最终用户能够直接管理收入、服务费率比较、患者护理状态和患者入院趋势,并轻松使用患者数据,而无需经过各种数据孤岛。支持商业智能 (BI) 的分析图表使最终用户能够高效地做出基于数据的决策,从而降低运营成本、改进服务并推动市场增长。此外,推出移动友好的医疗保健临床智能解决方案以保持最新状态是推动医疗保健商业智能市场收入增长的另一个重要因素。

此外,发达国家和发展中国家的政府都在大力投资医疗保健商业智能领域的发展。此外,政府也在为医疗保健商业智能市场的增长采取重要措施。近年来,所有上述因素都提高了全球医疗保健商业智能市场的复合年增长率。

医疗保健商业智能市场细分洞察

h3医疗保健商业智能组件洞察 p基于组件的医疗保健商业智能市场细分包括平台、软件和服务。软件部分在 2022 年占据了大部分份额,为医疗保健商业智能市场收入做出了贡献。这归功于其在医疗保健行业的广泛应用。商业智能软件允许管理员跟踪关键绩效,以分析、管理并帮助组织根据准确的数据和基于分析的洞察调整其绩效。然而,服务是预测期内增长最快的类别。这些服务通过从核心系统中提取数据并将其组织到高性能数据仓库中,允许进行结构化的数据驱动决策。预计在预测期内,BI 软件的不断发展以及对数据基础设施现代化等服务的需求将会增长。

医疗保健商业智能功能洞察

p医疗保健商业智能市场数据已按功能分为两类,包括 OLAP 和可视化以及绩效管理。绩效管理细分市场在 2022 年占据了市场主导地位,预计在 2022-2030 年预测期内将成为增长最快的细分市场。这是由于 SaaS 等软件的采用率不断提高,这些软件提供下一代云计算应用程序,对市场增长产生了积极影响。然而,由于下一代定制解决方案的开发,OLAP 和可视化是预测期内增长最快的类别。

图 1:2022 年和 2030 年按功能划分的医疗保健商业智能市场2034 年(十亿美元)

医疗保健商业智能组件

来源:二手资料研究、一手资料研究、MRFR 数据库和分析师评论

医疗保健商业智能区域洞察

p按地区划分,本研究提供北美、欧洲、亚太地区和世界其他地区的市场洞察。北美医疗保健商业智能市场在 2022 年的规模为 11.45 亿美元,预计在研究期间将呈现显著的复合年增长率。这归因于医疗保健商业智能解决方案和服务在医疗保健商业智能领域的应用不断增加,从而为患者提供更优质的护理。降低费用和大型制造中心是推动医疗保健商业智能行业区域增长的关键因素之一。此外,医疗保健和IT基础设施的不断升级,以及云计算应用的不断普及,也促进了该地区的增长。例如,2021年4月,美国能源部橡树岭国家实验室(ORNL)部署了由IBM打造的全球最强大、最智能的超级计算机之一——“Summit”。这个新系统将有助于紧急计算,也可以用来以非常高的速度执行模拟。

此外,市场报告中研究的主要国家是:美国、加拿大、德国、法国、英国、意大利、西班牙、中国、日本、印度、澳大利亚、韩国和巴西。

图 2:2022 年各地区医疗保健商业智能市场份额(%)

Healthcare Business Intelligence Regional

来源:二手资料研究、一手资料研究、MRFR 数据库和分析师评论

欧洲医疗保健商业智能市场占据第二大市场份额,这得益于医疗保健商业智能提供商和组织对医疗保健商业智能工具的认识不断提高由于政府举措的不断增加。此外,德国医疗保健商业智能市场占有最大的市场份额,英国医疗保健商业智能市场是欧洲地区增长最快的市场。

预计亚太地区医疗保健商业智能市场在 2023 年至 2034 年期间的复合年增长率最高。印度、中国和日本等国家/地区移动解决方案的普及率不断提高以及技术先进的医疗保健商业智能解决方案的实施力度不断加强,正在推动该地区市场的增长。此外,中国医疗保健商业智能市场占有最大的市场份额,印度医疗保健商业智能市场是亚太地区增长最快的市场。

医疗保健商业智能主要市场参与者和竞争洞察

主要市场参与者正在投入大量资金进行研发,以增加其产品线,这将有助于医疗保健商业智能市场进一步增长。市场参与者也在采取一系列战略举措,以扩大其全球影响力,关键的市场发展包括新产品发布、合同协议、并购、增加投资以及与其他组织的合作。医疗保健商业智能行业的竞争对手必须提供具有成本效益的产品,才能在竞争日益激烈且不断发展的市场环境中扩张和生存。

在全球医疗保健商业智能行业中,制造商为使客户受益并扩大市场而采取的主要商业策略之一是进行本地化生产以降低运营成本。在医疗保健商业智能市场中,微软公司、国际商业机器公司、SAP SE、甲骨文公司等主要参与者正致力于通过投资研发活动来扩大市场需求。

Snowflake Inc. 是一家基于云计算的数据云公司,总部位于蒙大拿州博兹曼。该公司成立于 2012 年 7 月,在隐身两年后于 2014 年 10 月正式上市。该公司提供名为“数据即服务”的云端数据存储和分析服务。它允许企业用户利用云端硬件和软件存储和分析数据。Snowflake 服务的突出特点是存储和计算分离、实时可扩展计算、数据共享、数据克隆以及第三方工具支持,以满足不断发展的企业的严苛需求。2022 年 3 月,Snowflake 推出了一个面向医疗保健行业的云端数据共享平台,该平台将公司的核心数据仓库、分析和医疗保健商业智能产品与数据市场和按需咨询服务相结合。

此外,微软公司是一家美国跨国科技公司,总部位于美国华盛顿州雷德蒙德。微软最著名的软件产品是 Microsoft Office 套件、Windows 系列操作系统以及 Internet Explorer 和 Edge 网络浏览器。其旗舰硬件设备是 Xbox 视频游戏机和 Microsoft Surface 系列触摸屏个人电脑。2022 年 3 月,微软宣布 Azure 健康数据服务正式发布,这是一个基于云的平台,用于管理和分析各种形式的患者数据。Azure 健康数据服务平台即服务 (PaaS) 可帮助组织管理跨多个数据存储的不同形式的受保护健康信息 (PHI),使其能够以更少的时间和资源处理并理解患者数据。因此,技术先进产品的推出正在推动市场增长。

医疗保健商业智能市场的主要公司包括

    • 甲骨文公司
    • Tableau 软件公司
    • Perficient 公司
    • Tibco 软件公司
    • Infor 公司
    • Domo 公司
    • Sisense 公司
    • Panorama Software Inc 等
p医疗保健商业智能行业发展

2022 年 1 月:Premier Inc. 的技术和服务平台 PINC AI 推出了 INSights,这是一款增强型自助式医疗保健商业智能解决方案,可创建定制的按需分析。 Insights 是一个与供应商无关的分析平台,可访问 PINC AI 经过清理、标准化和风险调整的医疗保健数据,涵盖超过 45% 的美国医院住院患者出院数据。

2022 年 1 月:

医疗保健商业智能市场细分

医疗保健商业智能组件展望

    • 平台
    • 软件
    • 服务

医疗保健商业智能功能展望

    • OLAP 和可视化
    • 绩效管理

医疗保健商业智能区域展望

    • 北美
      • 美国
      • 加拿大
    • 欧洲
      • 德国
      • 法国
      • 英国
      • 意大利
      • 西班牙
      • 其他地区欧洲
    • 亚太地区
      • 中国
      • 日本
      • 印度
      • 澳大利亚
      • 韩国
      • 澳大利亚
      • 亚太地区其他地区
    • 世界其他地区
      • 中东
      • 非洲
      • 拉丁美洲

市场亮点

作者
Author
Author Profile
Vikita Thakur LinkedIn
Senior Research Analyst
She holds an experience of about 5+ years in market research and business consulting projects for sectors such as life sciences, medical devices, and healthcare IT. She possesses a robust background in data analysis, market estimation, competitive intelligence, pipeline analysis market trend identification, and consumer behavior insights. Her expertise lies in technical Sales support, client interaction and project management, designing and implementing market research studies, conducting competitive analysis, and synthesizing complex data into actionable recommendations that drive business growth.
Co-Author
Co-Author Profile
Rahul Gotadki LinkedIn
Research Manager
He holds an experience of about 9+ years in Market Research and Business Consulting, working under the spectrum of Life Sciences and Healthcare domains. Rahul conceptualizes and implements a scalable business strategy and provides strategic leadership to the clients. His expertise lies in market estimation, competitive intelligence, pipeline analysis, customer assessment, etc.
发表评论

FAQs

What is the projected market valuation of the Healthcare Business Intelligence Market by 2035?

The projected market valuation for the Healthcare Business Intelligence Market by 2035 is 16040.3 USD Million.

What was the market valuation of the Healthcare Business Intelligence Market in 2024?

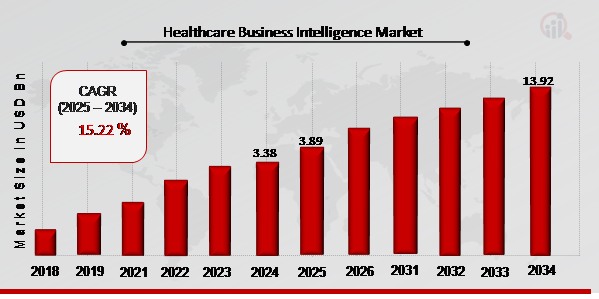
The overall market valuation of the Healthcare Business Intelligence Market was 3375.95 USD Million in 2024.

What is the expected CAGR for the Healthcare Business Intelligence Market during the forecast period 2025 - 2035?

The expected CAGR for the Healthcare Business Intelligence Market during the forecast period 2025 - 2035 is 15.22%.

Which segment is projected to have the highest valuation in the Healthcare Business Intelligence Market by 2035?

The Cloud-Based deployment mode is projected to have the highest valuation, reaching 8000.0 USD Million by 2035.

What are the key applications driving the Healthcare Business Intelligence Market?

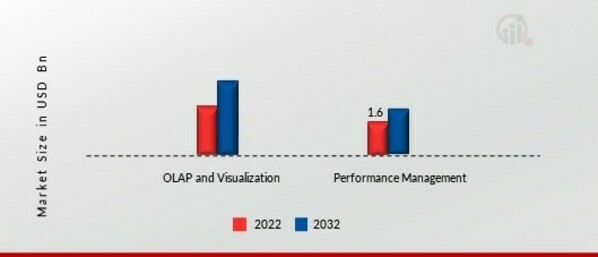
Key applications driving the market include Data Analytics, Reporting, Predictive Analytics, and Performance Management.

Which companies are considered key players in the Healthcare Business Intelligence Market?

Key players in the market include IBM, Oracle, SAP, Microsoft, Tableau, Qlik, SAS, Deloitte, and Cerner.

What is the projected valuation for Healthcare Providers in the Healthcare Business Intelligence Market by 2035?

The projected valuation for Healthcare Providers in the market is 6500.0 USD Million by 2035.

How does the valuation of Healthcare Payers compare to that of Pharmaceutical Companies by 2035?

By 2035, Healthcare Payers are projected to reach 4000.0 USD Million, while Pharmaceutical Companies are expected to reach 3500.0 USD Million.

What is the expected growth trend for the Services component in the Healthcare Business Intelligence Market?

The Services component is expected to grow significantly, reaching 7000.0 USD Million by 2035.

What was the valuation of the On-Premises deployment mode in 2024?

The valuation of the On-Premises deployment mode was 675.0 USD Million in 2024.

Research Approach

Secondary Research

The secondary research process involved comprehensive analysis of healthcare IT regulatory databases, health informatics journals, enterprise software publications, and authoritative healthcare technology organizations. Key sources included the US Department of Health and Human Services (HHS), Centers for Medicare & Medicaid Services (CMS), Office of the National Coordinator for Health Information Technology (ONC), HealthIT.gov, Healthcare Information and Management Systems Society (HIMSS), College of Healthcare Information Management Executives (CHIME), American Health Information Management Association (AHIMA), National Institutes of Health (NIH) – National Library of Medicine (NLM), Agency for Healthcare Research and Quality (AHRQ), World Health Organization (WHO) Digital Health Repository, OECD Health Statistics and Digital Health Outlook, EU Eurostat Healthcare IT Adoption Database, European Commission eHealth Network, UK NHS Digital, and national health IT agency reports from key markets. These sources were used to collect healthcare digitization statistics, regulatory compliance frameworks (HIPAA, GDPR, 21st Century Cures Act), clinical data interoperability standards, health IT spending trends, and market landscape analysis for business intelligence platforms, OLAP tools, performance management software, and AI-driven analytics solutions.

Primary Research

Qualitative and quantitative insights were obtained by interviewing supply-side and demand-side stakeholders during the primary research process. The supply-side sources consisted of CEOs, CTOs, VPs of Healthcare Product Development, cloud infrastructure leaders, and commercial directors from healthcare BI software vendors, enterprise analytics providers, and health IT consulting firms. Demand-side sources included Chief Information Officers (CIOs), Chief Medical Information Officers (CMIOs), Chief Data Officers (CDOs), analytics directors from academic medical centers, integrated health systems, and pharmaceutical business intelligence units, as well as digital transformation leads from payer organizations. Market segmentation was verified, AI/ML product pipeline timelines were confirmed, and insights regarding cloud migration patterns, SaaS subscription models, interoperability adoption, and cybersecurity compliance dynamics were obtained through primary research.

Primary Respondent Breakdown:

By Designation: C-level Primaries (30%), Director Level (35%), Others (35%)

By Region: North America (38%), Europe (25%), Asia-Pacific (28%), Rest of World (9%)

Market Size Estimation

Global market valuation was derived through revenue mapping and enterprise adoption analysis. The methodology included:

Identification of over 35 critical healthcare business intelligence vendors in North America, Europe, Asia-Pacific, and Latin America

Product mapping across BI platforms, standalone analytics software, and professional/managed services

Deployment mode analysis distinguishing cloud-based SaaS, on-premises licensing, and hybrid implementations

Analysis of reported and modeled annual revenues specific to healthcare vertical portfolios

Coverage of vendors representing 75-80% of global market share in 2024

Extrapolation using bottom-up (enterprise seats/licenses × ASP by country/organization size) and top-down (vendor revenue validation) approaches to derive segment-specific valuations for OLAP/visualization tools, performance management suites, AI-enabled analytics, and predictive modeling platforms

下载免费样本

请填写以下表格以获取本报告的免费样本

Compare Licence

×
Features License Type
Single User Multiuser License Enterprise User
Price $4,950 $5,950 $7,250
Maximum User Access Limit 1 User Upto 10 Users Unrestricted Access Throughout the Organization
Free Customization
Direct Access to Analyst
Deliverable Format
Platform Access
Discount on Next Purchase 10% 15% 15%
Printable Versions