ID: MRFR/F-B & N/0264-HCR | February 2021 | Region: Global | 135 pages
Market Scenario
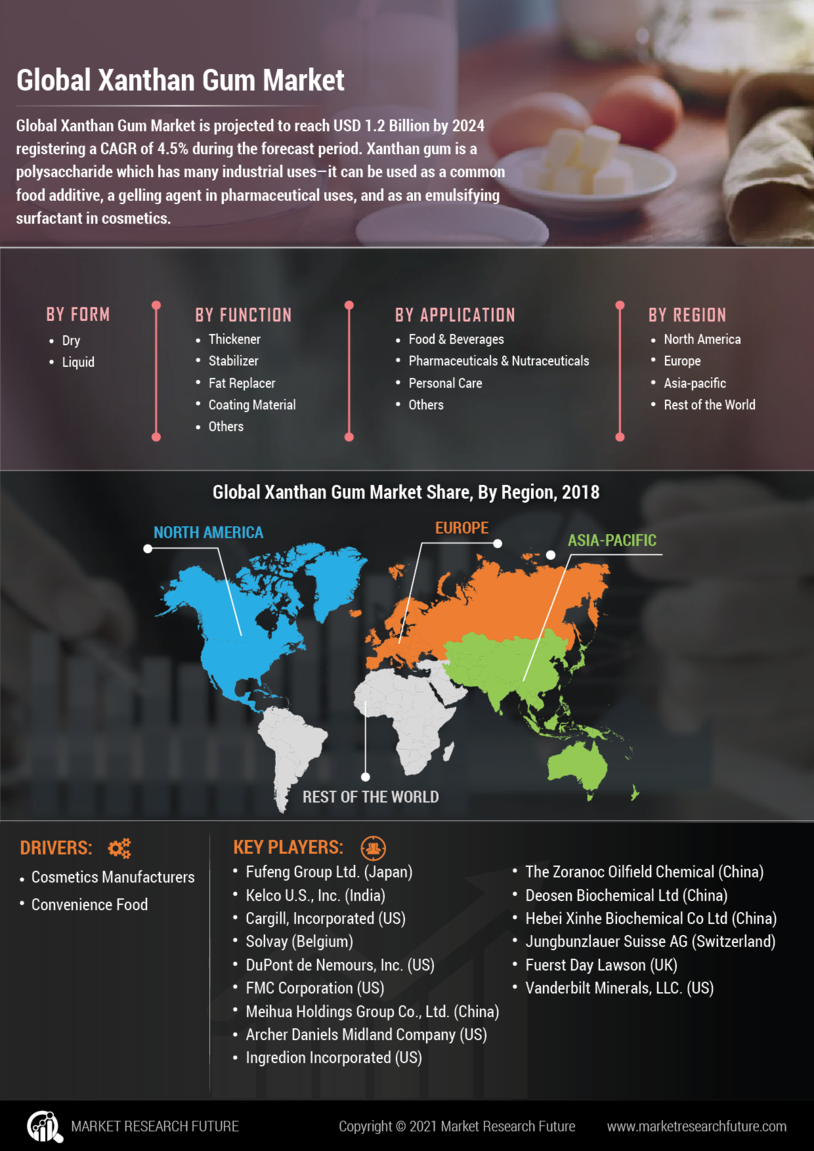
Xanthan gum is a polysaccharide which has many industrial uses—it can be used as a common food additive, a gelling agent in pharmaceutical uses, and as an emulsifying surfactant in cosmetics. It is an effective thickening agent and stabilizer which prevent ingredients from separating once mixed.
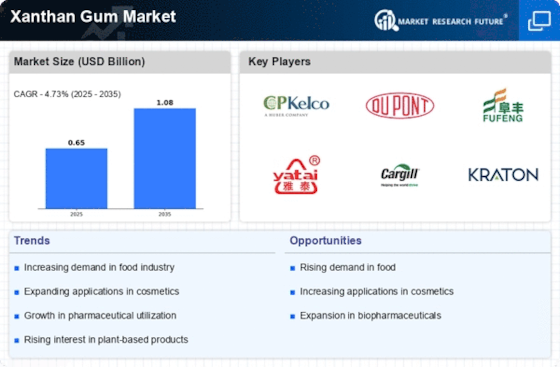
The global xanthan gum market is projected to grow at a significant rate of 4.5% from 2019 to 2024 to reach a market value of USD 1.2 billion by the end of 2024. Xanthan gum is used as a thickener, stabilizer, and coating material by food processors in production of many food items such as baked products, confectionery items, frozen desserts, and seafood. There is an increasing consumption of processed food items and convenient food products among the consumers globally, which in turn expected to drive the market for xanthan gum in the near future. Xanthan gum is also used by cosmetics manufacturers. In addition to that, the growth of end-use industries such as food processing, personal care, and pharmaceutical industry is also a key driver for the global xanthan gums market.
Availability of substitutes such as guar gum, which offer similar benefits to that of xanthan gum is expected to hamper the market growth during the forecast period.
Segmentation
The global xanthan gum market has been segmented based on form, function, application, and region.
The global xanthan gum market has been classified, based on form, as dry and liquid.
The global xanthan gum market has been segregated, based on function, into thickeners, stabilizers
fat replacers, coating materials, and others.
The global xanthan gum market has been divided, based on application, into food & beverages, pharmaceuticals & nutraceuticals, personal care, and others. The food & beverages segment is further bifurcated into bakery & confectionery, beverages, dairy & frozen desserts, sauces, dressings & dips, meat, poultry & seafood, and others.
The global xanthan gum market has been analyzed for four key regions—North America, Europe, Asia-Pacific, and the rest of the world.
The North American xanthan gum market has further been bifurcated into the US, Canada, and Mexico.
The European xanthan gum market has been classified as the UK, Germany, France, Italy, Spain, and the rest of Europe.
The xanthan gum market in Asia-Pacific has been divided into China, India, Japan, Australia and New Zealand, and the rest of Asia-Pacific.
The xanthan gum market in the rest of the world has been segmented into South America, the Middle East, and Africa.
Key Players
Regional Market Summary
Global Xanthan Gum Share (%), by Region, 2018
Source: Secondary Sources and MRFR Analysis
The market in North America is expected to dominate the global xanthan gum market during the forecast period. Consumers in this region are inclined towards maintaining a healthy lifestyle and adopting healthy food habits; hence they are avoiding the consumption of food items with artificial or synthetic additives, which in turn expected to fuel the market for xanthan gum during the forecast period. Also, rising concerns towards the use of synthetic chemical additives in skincare products have boosted manufacturers to formulate eco-friendly natural additives in cosmetic products, which is further driving the growth of xanthan gum.
The Asia-Pacific market is expected to grow at the highest CAGR in the global xanthan gum market in the near future as the market holds a large consumer base in this region. There is a huge demand for natural food additives from the food processing and beverage making companies in the region, which is expected to boost the market growth for xanthan gum during the assessment period. Additionally, xanthan gum is used widely by cosmetics producers, in pharmaceuticals, and in the oil & gas industry. This factor is also putting a great impact in generating revenue for regional xanthan gum market during the forecast period.
Global Xanthan Gum Market, by Form
Global Xanthan Gum Market, by Function
Global Xanthan Gum Market, by Application
Global Xanthan Gum Market, by Region
Intended Audience
Frequently Asked Questions (FAQ) :
The Global Xanthan Gum Market is expected to reach a valuation of USD 1.2 billion by 2024.
Global Xanthan Gum Market is expected to exhibit a strong 4.5% CAGR over the forecast period from 2019 to 2024.
The increasing demand for processed food and convenience food is likely to be a major driver for the Xanthan Gum Market.
North America dominates the Global Xanthan Gum Market.
Leading players in the Xanthan Gum Market include FMC Corporation, Cargill Inc., and Fufeng Group, among others.
Table of Contents
1. 1 EXECUTIVE SUMMARY
1.1. Market Attractiveness Analysis
1.1.1. Global Xanthan Gum Market, by Form
1.1.2. Global Xanthan Gum Market, by Function
1.1.3. Global Xanthan Gum Market, by Application
1.1.4. Global Xanthan Gum Market, by Region
2. MARKET INTRODUCTION
2.1. Definition
2.2. Scope of the Study
2.3. Market Structure
2.4. Key Buying Criteria
2.5. Macro Factor Indicator Analysis
3. RESEARCH METHODOLOGY
3.1. Research Process
3.2. Primary Research
3.3. Secondary Research
3.4. Market Size Estimation
3.5. Forecast Model
3.6. List of Assumptions
4. MARKET DYNAMICS
4.1. Introduction
4.2. Drivers
4.3. Restraints
4.4. Opportunities
4.5. Challenges
5. MARKET FACTOR ANALYSIS
5.1. Value Chain Analysis
5.2. Supply Chain Analysis
5.3. Porter’s Five Forces Model
5.3.1. Bargaining Power of Suppliers
5.3.2. Bargaining Power of Buyers
5.3.3. Threat of New Entrants
5.3.4. Threat of Substitutes
5.3.5. Intensity of Rivalry
6. GLOBAL XANTHAN GUM MARKET, BY FORM
6.1. Introduction
6.2. Dry
6.2.1. Dry: Market Estimates & Forecast, by Region/Country, 2019–2024
6.3. Liquid
6.3.1. Liquid: Market Estimates & Forecast, by Region/Country, 2019–2024
7. GLOBAL XANTHAN GUM MARKET, BY FUNCTION
7.1. Introduction
7.2. Thikener
7.2.1. Thikener: Market Estimates & Forecast, by Region/Country, 2019–2024
7.3. Stabilizer
7.3.1. Stabilizer: Market Estimates & Forecast, by Region/Country, 2019–2024
7.4. Fat Replacer
7.4.1. Fat Replacer: Market Estimates & Forecast, by Region/Country, 2019–2024
7.5. Coating Material
7.5.1. Coating Material: Market Estimates & Forecast, by Region/Country, 2019–2024
7.6. Others
7.6.1. Others: Market Estimates & Forecast, by Region/Country, 2019–2024
8. GLOBAL XANTHAN GUM MARKET, BY APPLICATION
8.1. Introduction
8.2. Food & Beverages
8.2.1. Food & Beverages: Market Estimates & Forecast, by Region/Country, 2019–2024
8.2.2. Bakery & Confectionary
8.2.2.1. Bakery & Confectionary: Market Estimates & Forecast, by Region/Country, 2019–2024
8.2.3. Beverages
8.2.3.1. Beverages: Market Estimates & Forecast, by Region/Country, 2019–2024
8.2.4. Dairy & Frozen Dessert
8.2.4.1. Dairy & Frozen Dessert: Market Estimates & Forecast, by Region/Country, 2019–2024
8.2.5. Sauces, Dressings & Dips
8.2.5.1. Sauces, Dressings & Dips: Market Estimates & Forecast, by Region/Country, 2019–2024
8.2.6. Meat, Poultry & Seafood
8.2.6.1. Meat, Poultry & Seafood: Market Estimates & Forecast, by Region/Country, 2019–2024
8.2.7. Others
8.2.7.1. Others: Market Estimates & Forecast, by Region/Country, 2019–2024
8.3. Pharmaceuticals & Nutraceuticals
8.3.1. Pharmaceuticals & Nutraceuticals: Market Estimates & Forecast, by Region/Country, 2019–2024
8.4. Personal Care
8.4.1. Personal Care: Market Estimates & Forecast, by Region/Country, 2019–2024
8.5. Others
8.5.1. Others: Market Estimates & Forecast, by Region/Country, 2019–2024
9. GLOBAL XANTHAN GUM MARKET MARKET, BY REGION
9.1. Introduction
9.2. North America
9.2.1. Market Estimates & Forecast, by Form, 2019–2024
9.2.2. Market Estimates & Forecast, by Function, 2019–2024
9.2.3. Market Estimates & Forecast, by Application, 2019–2024
9.2.4. Market Estimates & Forecast, by Country, 2019–2024
9.2.5. US
9.2.5.1. Market Estimates & Forecast, by Form, 2019–2024
9.2.5.2. Market Estimates & Forecast, by Function, 2019–2024
9.2.5.3. Market Estimates & Forecast, by Application, 2019–2024
9.2.6. Canada
9.2.6.1. Market Estimates & Forecast, by Form, 2019–2024
9.2.6.2. Market Estimates & Forecast, by Function, 2019–2024
9.2.6.3. Market Estimates & Forecast, by Application, 2019–2024
9.2.7. Mexico
9.2.7.1. Market Estimates & Forecast, by Form, 2019–2024
9.2.7.2. Market Estimates & Forecast, by Function, 2019–2024
9.2.7.3. Market Estimates & Forecast, by Application, 2019–2024
9.3. Europe
9.3.1. Market Estimates & Forecast, by Form, 2019–2024
9.3.2. Market Estimates & Forecast, by Function, 2019–2024
9.3.3. Market Estimates & Forecast, by Application, 2019–2024
9.3.4. Market Estimates & Forecast, by Country, 2019–2024
9.3.5. Germany
9.3.5.1. Market Estimates & Forecast, by Form, 2019–2024
9.3.5.2. Market Estimates & Forecast, by Function, 2019–2024
9.3.5.3. Market Estimates & Forecast, by Application, 2019–2024
9.3.6. UK
9.3.6.1. Market Estimates & Forecast, by Form, 2019–2024
9.3.6.2. Market Estimates & Forecast, by Function, 2019–2024
9.3.6.3. Market Estimates & Forecast, by Application, 2019–2024
9.3.7. France
9.3.7.1. Market Estimates & Forecast, by Form, 2019–2024
9.3.7.2. Market Estimates & Forecast, by Function, 2019–2024
9.3.7.3. Market Estimates & Forecast, by Application, 2019–2024
9.3.8. Spain
9.3.8.1. Market Estimates & Forecast, by Form, 2019–2024
9.3.8.2. Market Estimates & Forecast, by Function, 2019–2024
9.3.8.3. Market Estimates & Forecast, by Application, 2019–2024
9.3.9. Italy
9.3.9.1. Market Estimates & Forecast, by Form, 2019–2024
9.3.9.2. Market Estimates & Forecast, by Function, 2019–2024
9.3.9.3. Market Estimates & Forecast, by Application, 2019–2024
9.3.10. Rest of Europe
9.3.10.1. Market Estimates & Forecast, by Form, 2019–2024
9.3.10.2. Market Estimates & Forecast, by Function, 2019–2024
9.3.10.3. Market Estimates & Forecast, by Application, 2019–2024
9.4. Asia-Pacific
9.4.1. Market Estimates & Forecast, by Form, 2019–2024
9.4.2. Market Estimates & Forecast, by Function, 2019–2024
9.4.3. Market Estimates & Forecast, by Application, 2019–2024
9.4.4. Market Estimates & Forecast, by Country, 2019–2024
9.4.5. China
9.4.5.1. Market Estimates & Forecast, by Form, 2019–2024
9.4.5.2. Market Estimates & Forecast, by Function, 2019–2024
9.4.5.3. Market Estimates & Forecast, by Application, 2019–2024
9.4.6. Japan
9.4.6.1. Market Estimates & Forecast, by Form, 2019–2024
9.4.6.2. Market Estimates & Forecast, by Function, 2019–2024
9.4.6.3. Market Estimates & Forecast, by Application, 2019–2024
9.4.7. India
9.4.7.1. Market Estimates & Forecast, by Form, 2019–2024
9.4.7.2. Market Estimates & Forecast, by Function, 2019–2024
9.4.7.3. Market Estimates & Forecast, by Application, 2019–2024
9.4.8. Australia & New Zealand
9.4.8.1. Market Estimates & Forecast, by Form, 2019–2024
9.4.8.2. Market Estimates & Forecast, by Function, 2019–2024
9.4.8.3. Market Estimates & Forecast, by Application, 2019–2024
9.4.9. Rest of Asia-Pacific
9.4.9.1. Market Estimates & Forecast, by Form, 2019–2024
9.4.9.2. Market Estimates & Forecast, by Function, 2019–2024
9.4.9.3. Market Estimates & Forecast, by Application, 2019–2024
9.5. Rest of the World
9.5.1. Market Estimates & Forecast, by Form, 2019–2024
9.5.2. Market Estimates & Forecast, by Function, 2019–2024
9.5.3. Market Estimates & Forecast, by Application, 2019–2024
9.5.4. Market Estimates & Forecast, by Region, 2019–2024
9.5.5. South America
9.5.5.1. Market Estimates & Forecast, by Form, 2019–2024
9.5.5.2. Market Estimates & Forecast, by Function, 2019–2024
9.5.5.3. Market Estimates & Forecast, by Application, 2019–2024
9.5.6. Middle East
9.5.6.1. Market Estimates & Forecast, by Form, 2019–2024
9.5.6.2. Market Estimates & Forecast, by Function, 2019–2024
9.5.6.3. Market Estimates & Forecast, by Application, 2019–2024
9.5.7. Africa
9.5.7.1. Market Estimates & Forecast, by Form, 2019–2024
9.5.7.2. Market Estimates & Forecast, by Function, 2019–2024
9.5.7.3. Market Estimates & Forecast, by Application, 2019–2024
10. COMPETITIVE LANDSCAPE
10.1. Introduction
10.2. Competitive Benchmarking
10.3. Development Share Analysis
10.4. Key Developments & Growth Strategies
11. COMPANY PROFILES
11.1. Fufeng Group Ltd.
11.1.1. Company Overview
11.1.2. Financial Overview
11.1.3. Products Offered
11.1.4. Key Developments
11.1.5. SWOT Analysis
11.1.6. Key Strategies
11.2. Kelco U.S., Inc.
11.2.1. Company Overview
11.2.2. Financial Overview
11.2.3. Products Offered
11.2.4. Key Developments
11.2.5. SWOT Analysis
11.2.6. Key Strategies
11.3. Cargill, Incorporated
11.3.1. Company Overview
11.3.2. Financial Overview
11.3.3. Products Offered
11.3.4. Key Developments
11.3.5. SWOT Analysis
11.3.6. Key Strategies
11.4. Solvay
11.4.1. Company Overview
11.4.2. Financial Overview
11.4.3. Products Offered
11.4.4. Key Developments
11.4.5. SWOT Analysis
11.4.6. Key Strategies
11.5. DuPont de Nemours, Inc.
11.5.1. Company Overview
11.5.2. Financial Overview
11.5.3. Products Offered
11.5.4. Key Developments
11.5.5. SWOT Analysis
11.5.6. Key Strategies
11.6. FMC Corporation
11.6.1. Company Overview
11.6.2. Financial Overview
11.6.3. Products Offered
11.6.4. Key Developments
11.6.5. SWOT Analysis
11.6.6. Key Strategies
11.7. Meihua Holdings Group Co., Ltd.
11.7.1. Company Overview
11.7.2. Financial Overview
11.7.3. Products Offered
11.7.4. Key Developments
11.7.5. SWOT Analysis
11.7.6. Key Strategies
11.8. Archer Daniels Midland Company
11.8.1. Company Overview
11.8.2. Financial Overview
11.8.3. Products Offered
11.8.4. Key Developments
11.8.5. SWOT Analysis
11.8.6. Key Strategies
11.9. Ingredion Incorporated
11.9.1. Company Overview
11.9.2. Financial Overview
11.9.3. Products Offered
11.9.4. Key Developments
11.9.5. SWOT Analysis
11.9.6. Key Strategies
11.10. The Zoranoc Oilfield Chemical
11.10.1. Company Overview
11.10.2. Financial Overview
11.10.3. Products Offered
11.10.4. Key Developments
11.10.5. SWOT Analysis
11.10.6. Key Strategies
11.11. Deosen Biochemical Ltd
11.11.1. Company Overview
11.11.2. Financial Overview
11.11.3. Products Offered
11.11.4. Key Developments
11.11.5. SWOT Analysis
11.11.6. Key Strategies
11.12. Hebei Xinhe Biochemical Co Ltd
11.12.1. Company Overview
11.12.2. Financial Overview
11.12.3. Products Offered
11.12.4. Key Developments
11.12.5. SWOT Analysis
11.12.6. Key Strategies
11.13. Jungbunzlauer Suisse AG
11.13.1. Company Overview
11.13.2. Financial Overview
11.13.3. Products Offered
11.13.4. Key Developments
11.13.5. SWOT Analysis
11.13.6. Key Strategies
11.14. Fuerst Day Lawson
11.14.1. Company Overview
11.14.2. Financial Overview
11.14.3. Products Offered
11.14.4. Key Developments
11.14.5. SWOT Analysis
11.14.6. Key Strategies
11.15. Vanderbilt Minerals, LLC ·
11.15.1. Company Overview
11.15.2. Financial Overview
11.15.3. Products Offered
11.15.4. Key Developments
11.15.5. SWOT Analysis
11.15.6. Key Strategies
12. APPENDIX
12.1. General Sources & References
12.2. List of Abbreviation
LIST OF TABLES
Table 1 Global Xanthan Gum Market, by Region, 2019–2024 (USD Million)
Table 2 Global Xanthan Gum Market, by Form, 2019–2024 (USD Million)
Table 3 Global Xanthan Gum Market, by Function,2019–2024 (USD Million)
Table 4 Global Xanthan Gum Market, by Application, 2019–2024 (USD Million)
Table 5 North America: Xanthan Gum Market, by Country, 2019–2024 (USD Million)
Table 6 North America: Xanthan Gum Market, by Form, 2019–2024 (USD Million)
Table 7 North America: Xanthan Gum Market, by Function,2019–2024 (USD Million)
Table 8 North America: Xanthan Gum Market, by Application, 2019–2024 (USD Million)
Table 9 US: Xanthan Gum Market, by Form, 2019–2024 (USD Million)
Table 10 US: Xanthan Gum Market, by Function,2019–2024 (USD Million)
Table 11 US: Xanthan Gum Market, by Application, 2019–2024 (USD Million)
Table 12 Canada: Xanthan Gum Market, by Form, 2019–2024 (USD Million)
Table 13 Canada: Xanthan Gum Market, by Function,2019–2024 (USD Million)
Table 14 Canada: Xanthan Gum Market, by Application, 2019–2024 (USD Million)
Table 15 Mexico: Xanthan Gum Market, by Form, 2019–2024 (USD Million)
Table 16 Mexico: Xanthan Gum Market, by Function,2019–2024 (USD Million)
Table 17 Mexico: Xanthan Gum Market, by Application, 2019–2024 (USD Million)
Table 18 Europe: Xanthan Gum Market, by Country, 2019–2024 (USD Million)
Table 19 Europe: Xanthan Gum Market, by Form, 2019–2024 (USD Million)
Table 20 Europe: Xanthan Gum Market, by Function,2019–2024 (USD Million)
Table 21 Europe: Xanthan Gum Market, by Application, 2019–2024 (USD Million)
Table 22 Germany: Xanthan Gum Market, by Form, 2019–2024 (USD Million)
Table 23 Germany: Xanthan Gum Market, by Function,2019–2024 (USD Million)
Table 24 Germany: Xanthan Gum Market, by Application, 2019–2024 (USD Million)
Table 25 France: Xanthan Gum Market, by Form, 2019–2024 (USD Million)
Table 26 France: Xanthan Gum Market, by Function,2019–2024 (USD Million)
Table 27 France: Xanthan Gum Market, by Application, 2019–2024 (USD Million)
Table 28 Italy: Xanthan Gum Market, by Form, 2019–2024 (USD Million)
Table 29 Italy: Xanthan Gum Market, by Function,2019–2024 (USD Million)
Table 30 Italy: Xanthan Gum Market, by Application, 2019–2024 (USD Million)
Table 31 Spain: Xanthan Gum Market, by Form, 2019–2024 (USD Million)
Table 32 Spain: Xanthan Gum Market, by Function,2019–2024 (USD Million)
Table 33 Spain: Xanthan Gum Market, by Application, 2019–2024 (USD Million)
Table 34 UK: Xanthan Gum Market, by Form, 2019–2024 (USD Million)
Table 35 UK: Xanthan Gum Market, by Function,2019–2024 (USD Million)
Table 36 UK: Xanthan Gum Market, by Application, 2019–2024 (USD Million)
Table 37 Rest of Europe: Xanthan Gum Market, by Form, 2019–2024 (USD Million)
Table 38 Rest of Europe: Xanthan Gum Market, by Function,2019–2024 (USD Million)
Table 39 Rest of Europe: Xanthan Gum Market, by Application, 2019–2024 (USD Million)
Table 40 Asia-Pacific: Xanthan Gum Market, by Country, 2019–2024 (USD Million)
Table 41 Asia-Pacific: Xanthan Gum Market, by Form, 2019–2024 (USD Million)
Table 42 Asia-Pacific: Xanthan Gum Market, by Function,2019–2024 (USD Million)
Table 43 Asia-Pacific: Xanthan Gum Market, by Application, 2019–2024 (USD Million)
Table 44 China: Xanthan Gum Market, by Form, 2019–2024 (USD Million)
Table 45 China: Xanthan Gum Market, by Function,2019–2024 (USD Million)
Table 46 China: Xanthan Gum Market, by Application, 2019–2024 (USD Million)
Table 47 India: Xanthan Gum Market, by Form, 2019–2024 (USD Million)
Table 48 India: Xanthan Gum Market, by Function,2019–2024 (USD Million)
Table 49 India: Xanthan Gum Market, by Application, 2019–2024 (USD Million)
Table 50 Japan: Xanthan Gum Market, by Form, 2019–2024 (USD Million)
Table 51 Japan: Xanthan Gum Market, by Function,2019–2024 (USD Million)
Table 52 Japan: Xanthan Gum Market, by Application, 2019–2024 (USD Million)
Table 53 Australia & New Zealand: Xanthan Gum Market, by Form, 2019–2024 (USD Million)
Table 54 Australia & New Zealand: Xanthan Gum Market, by Function,2019–2024 (USD Million)
Table 55 Australia & New Zealand: Xanthan Gum Market, by Application, 2019–2024 (USD Million)
Table 56 Rest of Asia-Pacific: Xanthan Gum Market, by Form, 2019–2024 (USD Million)
Table 57 Rest of Asia-Pacific: Xanthan Gum Market, by Function,2019–2024 (USD Million)
Table 58 Rest of Asia-Pacific: Xanthan Gum Market, by Application, 2019–2024 (USD Million)
Table 59 Rest of the World (RoW): Xanthan Gum Market, by Country, 2019–2024 (USD Million)
Table 60 Rest of the World (RoW): Xanthan Gum Market, by Form, 2019–2024 (USD Million)
Table 61 Rest of the World (RoW): Xanthan Gum Market, by Function,2019–2024 (USD Million)
Table 62 Rest of the World (RoW): Xanthan Gum Market, by Application, 2019–2024 (USD Million)
Table 63 South America: Xanthan Gum Market, by Form, 2019–2024 (USD Million)
Table 64 South America: Xanthan Gum Market, by Function,2019–2024 (USD Million)
Table 65 South America: Xanthan Gum Market, by Application, 2019–2024 (USD Million)
Table 66 Middle East: Xanthan Gum Market, by Form, 2019–2024 (USD Million)
Table 67 Middle East: Xanthan Gum Market, by Function,2019–2024 (USD Million)
Table 68 Middle East: Xanthan Gum Market, by Application, 2019–2024 (USD Million)
Table 69 Africa: Xanthan Gum Market, by Form, 2019–2024 (USD Million)
Table 70 Africa: Xanthan Gum Market, by Function,2019–2024 (USD Million)
Table 71 Africa: Xanthan Gum Market, by Application, 2019–2024 (USD Million)
LIST OF FIGURES
FIGURE 1 Global Xanthan Gum Market Segmentation
FIGURE 2 Forecast Research Methodology
FIGURE 3 Five Forces Analysis of the Global Xanthan Gum Market
FIGURE 4 Value Chain of the Global Xanthan Gum Market
FIGURE 5 Share of the Global Xanthan Gum Market in 2018, by Country (%)
FIGURE 6 Global Xanthan Gum Market, by Region, 2019–2024,
FIGURE 7 Global Xanthan Gum Market Size, by Form, 2018
FIGURE 8 Share of the Global Xanthan Gum Market, by Form, 2019–2024 (%)
FIGURE 9 Global Xanthan Gum Market Size, by Function, 2018
FIGURE 10 Share of the Global Xanthan Gum Market, by Function, 2019–2024 (%)
FIGURE 11 Global Xanthan Gum Market Size, by Application, 2018
FIGURE 12 Share of the Global Xanthan Gum Market, by Application, 2019–2024 (%)