


Water Electrolysis Size
Market Size Snapshot
| Year | Value |
|---|---|
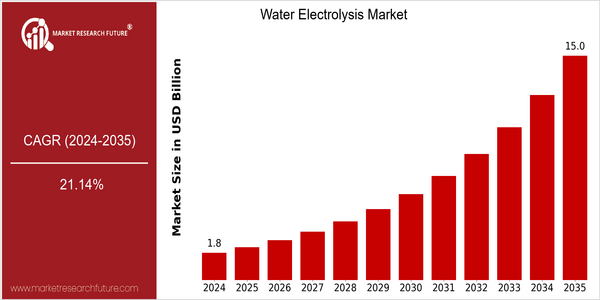
| 2024 | USD 1.82 Billion |
| 2035 | USD 15.0 Billion |
| CAGR (2025-2035) | 21.14 % |
Note – Market size depicts the revenue generated over the financial year
The electrolysis of water market is expected to reach $1.8 billion by 2024, with a projected growth to $ 15.0 billion by 2035. The remarkable growth of the market is estimated at a CAGR of 21.14% from 2025 to 2035. The demand for hydrogen as a clean energy source, driven by the world's shift towards green energy, is the main driving force of the market. The development of water electrolysis technology, such as proton exchange membrane (PEM) and alkaline electrolysis, has increased the efficiency and lowered the cost, which is expected to drive the market. The leading companies in the water electrolysis industry, such as Siemens, ITM Power, and Nel ASA, are actively investing in R & D to develop new products and services. The strategic collaboration of large-scale hydrogen production projects and the investment in renewable energy integration will also be an important factor affecting the competition in the market. The policy of reducing carbon dioxide emissions and promoting hydrogen as an energy carrier will promote the development of the water electrolysis market.
Regional Market Size
Regional Deep Dive
The electrolysis of water is experiencing a high growth rate in different regions of the world. The growing demand for hydrogen is accompanied by a shift in the energy industry towards the use of clean and renewable energy sources. In North America, Europe, Asia-Pacific, the Middle East and Africa, and Latin America, the dynamics of the market are influenced by regional policies, technological development and the launch of green hydrogen projects. Each region has its own characteristics in terms of government support, industrial applications and market maturity, which determine the global market for water electrolysis.
Europe
- The European Union's Green Deal and Hydrogen Strategy are pivotal in driving investments in water electrolysis, with countries like Germany and the Netherlands leading the charge in establishing hydrogen infrastructure.
- Innovations in electrolyzer technology, such as the development of high-temperature electrolysis by companies like Siemens Energy, are enhancing efficiency and reducing operational costs, thereby making hydrogen more competitive.
Asia Pacific
- Japan and South Korea are at the forefront of hydrogen technology, with government-backed projects like Japan's 'Basic Hydrogen Strategy' promoting water electrolysis as a key component of their energy transition.
- Chinese manufacturers are rapidly scaling up electrolyzer production, supported by government incentives, which is expected to significantly lower costs and increase market penetration in the region.
Latin America
- Brazil is emerging as a key player in the water electrolysis market, with government support for renewable energy projects and initiatives aimed at producing green hydrogen from its abundant hydropower resources.
- Innovative partnerships between local companies and international firms are fostering technology transfer and investment in electrolyzer technology, which is expected to enhance the region's capabilities in hydrogen production.
North America
- The U.S. Department of Energy has launched initiatives to promote hydrogen production through electrolysis, aiming to reduce costs and enhance efficiency, which is expected to accelerate market adoption.
- Major companies like Plug Power and Nel ASA are investing heavily in electrolyzer technology, focusing on scaling production capabilities to meet the rising demand for hydrogen fuel in transportation and industrial sectors.
Middle East And Africa
- Countries like Saudi Arabia are investing in large-scale hydrogen projects, such as the NEOM project, which aims to produce green hydrogen through water electrolysis, positioning the region as a future hydrogen hub.
- The UAE is also exploring water electrolysis as part of its broader strategy to diversify its energy sources and reduce carbon emissions, with initiatives like the Abu Dhabi Hydrogen Alliance.
Did You Know?
“Water electrolysis can produce hydrogen with a purity level of over 99.999%, making it suitable for various applications, including fuel cells and industrial processes.” — International Energy Agency (IEA)
Segmental Market Size
The electrolysis of water market is booming. The demand for hydrogen as a clean fuel is growing. The trend is mainly due to the increasingly stringent regulations on carbon dioxide emissions and the need for sustainable energy solutions in various industries. The development of new electrolysis methods such as proton exchange membrane (PEM) and alkaline electrolysis further increases the efficiency and reduces the cost of operation, which makes them more attractive to both investors and companies. The market is currently at the stage of commercialization, and there are notable examples of projects carried out by companies such as Siemens Energy and Nel Hydrogen in Europe and North America. The main applications of water electrolysis are transportation, hydrogen fuel cells, and industrial processes, including ammonia production. The growth in the water electrolysis market is accelerating due to macro-economic trends, such as the development of sustainable energy and the use of renewable energy sources. In the long run, innovation in electrolysis and the use of renewable energy sources will continue to determine the future of the industry.
Future Outlook
The market for water electrolysis is projected to grow at a CAGR of 21.14% from 2024 to 2035. This growth is largely due to the increasing demand for clean hydrogen, which is driven by the urgent need to transition to sustainable energy sources and reduce carbon emissions. The adoption of water electrolysis is expected to penetrate various sectors, such as transportation, industry and energy storage, with hydrogen production possibly reaching 15 to 20 percent by 2035. Also, technological developments, such as increasing the efficiency of the electrolysis and reducing the cost of the plant, are expected to promote market growth. In addition, advances in materials science, such as the development of more efficient catalysts, will improve the performance of the water electrolysis system and make it more economically viable. Also, government policies and subsidies to encourage the use of green hydrogen will play a significant role in shaping the market. Also, the integration of the electrolysis system with the power grid and the development of hydrogen infrastructure will contribute to the growth of the market, and water electrolysis will be the foundation of the future energy system.


Leave a Comment