Certified Global Research Member
Isomar fd.webp Wcrc 57.webp
Key Questions Answered
  • Global Market Outlook
  • In-depth analysis of global and regional trends
  • Analyze and identify the major players in the market, their market share, key developments, etc.
  • To understand the capability of the major players based on products offered, financials, and strategies.
  • Identify disrupting products, companies, and trends.
  • To identify opportunities in the market.
  • Analyze the key challenges in the market.
  • Analyze the regional penetration of players, products, and services in the market.
  • Comparison of major players’ financial performance.
  • Evaluate strategies adopted by major players.
  • Recommendations
Why Choose Market Research Future?
  • Vigorous research methodologies for specific market.
  • Knowledge partners across the globe
  • Large network of partner consultants.
  • Ever-increasing/ Escalating data base with quarterly monitoring of various markets
  • Trusted by fortune 500 companies/startups/ universities/organizations
  • Large database of 5000+ markets reports.
  • Effective and prompt pre- and post-sales support.

Voice Assistant Market Research Report Information By Product (Smart Speakers and Personal Assistant), By Technology (Natural Language Processing, Speech/Voice Recognition, and Text-to-Speech Recognition), By End User (Individual Users, Large Enterprises, and Small & Medium Enterprise), By Application (Messenger Bots, Websites, and Contact Centers), And By Region (North America, Europe, Asia-Pacific, And Rest Of The World) – Market Forecast Till 2032.


ID: MRFR/ICT/2686-CR | 155 Pages | Author: Shubham Munde| October 2021

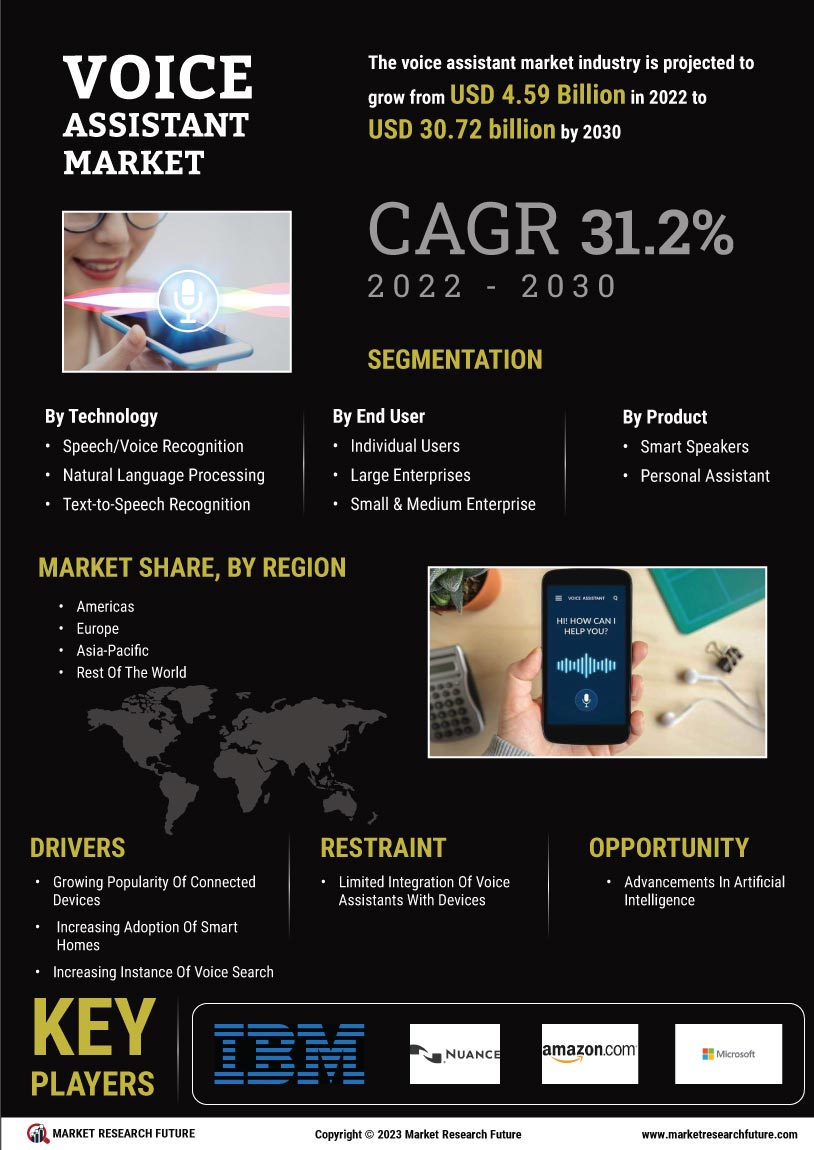
Voice Assistant Market Segmentation


Voice Assistant Technology Outlook (USD Million, 2018-2030)


  • Speech/Voice Recognition


  • Natural Language Processing


  • Text-to-Speech Recognition


Voice Assistant End User Outlook (USD Million, 2018-2030)


  • Individual Users


  • Large Enterprises


  • Small & Medium Enterprise


Voice Assistant Product Outlook (USD Million, 2018-2030)


  • Smart Speakers


  • Personal Assistant


Voice Assistant Application Outlook (USD Million, 2018-2030)


  • Messenger Bots


  • Websites


  • Contact Centers


Voice Assistant Regional Outlook (USD Million, 2018-2030)


  • North America Outlook (USD Million, 2018-2030)


    • North America Voice Assistant by Technology


      • Speech/Voice Recognition


      • Natural Language Processing


      • Text-to-Speech Recognition


    • North America Voice Assistant by End User


      • Individual Users


      • Large Enterprises


      • Small & Medium Enterprise


    • North America Voice Assistant by Product


      • Smart Speakers


      • Personal Assistant


    • North America Voice Assistant by Application


      • Messenger Bots


      • Websites


      • Contact Centers


    • US Outlook (USD Million, 2018-2030)


    • US Voice Assistant by Technology


      • Speech/Voice Recognition


      • Natural Language Processing


      • Text-to-Speech Recognition


    • US Voice Assistant by End User


      • Individual Users


      • Large Enterprises


      • Small & Medium Enterprise


    • US Voice Assistant by Product


      • Smart Speakers


      • Personal Assistant


    • US Voice Assistant by Application


      • Messenger Bots


      • Websites


      • Contact Centers


    • CANADA Outlook (USD Million, 2018-2030)


    • CANADA Voice Assistant by Technology


      • Speech/Voice Recognition


      • Natural Language Processing


      • Text-to-Speech Recognition


    • CANADA Voice Assistant by End User


      • Individual Users


      • Large Enterprises


      • Small & Medium Enterprise


    • CANADA Voice Assistant by Product


      • Smart Speakers


      • Personal Assistant


    • CANADA Voice Assistant by Application


      • Messenger Bots


      • Websites


      • Contact Centers


  • Europe Outlook (USD Million, 2018-2030)


    • Europe Voice Assistant by Technology


      • Speech/Voice Recognition


      • Natural Language Processing


      • Text-to-Speech Recognition


    • Europe Voice Assistant by End User


      • Individual Users


      • Large Enterprises


      • Small & Medium Enterprise


    • Europe Voice Assistant by Product


      • Smart Speakers


      • Personal Assistant


    • Europe Voice Assistant by Application


      • Messenger Bots


      • Websites


      • Contact Centers


    • Germany Outlook (USD Million, 2018-2030)


    • Germany Voice Assistant by Technology


      • Speech/Voice Recognition


      • Natural Language Processing


      • Text-to-Speech Recognition


    • Germany Voice Assistant by End User


      • Individual Users


      • Large Enterprises


      • Small & Medium Enterprise


    • Germany Voice Assistant by Product


      • Smart Speakers


      • Personal Assistant


    • Germany Voice Assistant by Application


      • Messenger Bots


      • Websites


      • Contact Centers


    • France Outlook (USD Million, 2018-2030)


    • France Voice Assistant by Technology


      • Speech/Voice Recognition


      • Natural Language Processing


      • Text-to-Speech Recognition


    • France Voice Assistant by End User


      • Individual Users


      • Large Enterprises


      • Small & Medium Enterprise


    • France Voice Assistant by Product


      • Smart Speakers


      • Personal Assistant


    • France Voice Assistant by Application


      • Messenger Bots


      • Websites


      • Contact Centers


    • UK Outlook (USD Million, 2018-2030)


    • UK Voice Assistant by Technology


      • Speech/Voice Recognition


      • Natural Language Processing


      • Text-to-Speech Recognition


    • UK Voice Assistant by End User


      • Individual Users


      • Large Enterprises


      • Small & Medium Enterprise


    • UK Voice Assistant by Product


      • Smart Speakers


      • Personal Assistant


    • UK Voice Assistant by Application


      • Messenger Bots


      • Websites


      • Contact Centers


    • ITALY Outlook (USD Million, 2018-2030)


    • ITALY Voice Assistant by Technology


      • Speech/Voice Recognition


      • Natural Language Processing


      • Text-to-Speech Recognition


    • ITALY Voice Assistant by End User


      • Individual Users


      • Large Enterprises


      • Small & Medium Enterprise


    • ITALY Voice Assistant by Product


      • Smart Speakers


      • Personal Assistant


    • ITALY Voice Assistant by Application


      • Messenger Bots


      • Websites


      • Contact Centers


    • SPAIN Outlook (USD Million, 2018-2030)


    • Spain Voice Assistant by Technology


      • Speech/Voice Recognition


      • Natural Language Processing


      • Text-to-Speech Recognition


    • Spain Voice Assistant by End User


      • Individual Users


      • Large Enterprises


      • Small & Medium Enterprise


    • Spain Voice Assistant by Product


      • Smart Speakers


      • Personal Assistant


    • Spain Voice Assistant by Application


      • Messenger Bots


      • Websites


      • Contact Centers


    • Rest Of Europe Outlook (USD Million, 2018-2030)


    • Rest Of Europe Voice Assistant by Technology


      • Speech/Voice Recognition


      • Natural Language Processing


      • Text-to-Speech Recognition


    • REST OF EUROPE Voice Assistant by End User


      • Individual Users


      • Large Enterprises


      • Small & Medium Enterprise


    • REST OF EUROPE Voice Assistant by Product


      • Smart Speakers


      • Personal Assistant


    • REST OF EUROPE Voice Assistant by Application


      • Messenger Bots


      • Websites


      • Contact Centers


  • Asia-Pacific Outlook (USD Million, 2018-2030)


    • Asia-Pacific Voice Assistant by Technology


      • Speech/Voice Recognition


      • Natural Language Processing


      • Text-to-Speech Recognition


    • Asia-Pacific Voice Assistant by End User


      • Individual Users


      • Large Enterprises


      • Small & Medium Enterprise


    • Asia-Pacific Voice Assistant by Product


      • Smart Speakers


      • Personal Assistant


    • Asia-Pacific Voice Assistant by Application


      • Messenger Bots


      • Websites


      • Contact Centers


    • China Outlook (USD Million, 2018-2030)


    • China Voice Assistant by Technology


      • Speech/Voice Recognition


      • Natural Language Processing


      • Text-to-Speech Recognition


    • China Voice Assistant by End User


      • Individual Users


      • Large Enterprises


      • Small & Medium Enterprise


    • China Voice Assistant by Product


      • Smart Speakers


      • Personal Assistant


    • China Voice Assistant by Application


      • Messenger Bots


      • Websites


      • Contact Centers


    • Japan Outlook (USD Million, 2018-2030)


    • Japan Voice Assistant by Technology


      • Speech/Voice Recognition


      • Natural Language Processing


      • Text-to-Speech Recognition


    • Japan Voice Assistant by End User


      • Individual Users


      • Large Enterprises


      • Small & Medium Enterprise


    • Japan Voice Assistant by Product


      • Smart Speakers


      • Personal Assistant


    • Japan Voice Assistant by Application


      • Messenger Bots


      • Websites


      • Contact Centers


    • India Outlook (USD Million, 2018-2030)


    • India Voice Assistant by Technology


      • Speech/Voice Recognition


      • Natural Language Processing


      • Text-to-Speech Recognition


    • India Voice Assistant by End User


      • Individual Users


      • Large Enterprises


      • Small & Medium Enterprise


    • India Voice Assistant by Product


      • Smart Speakers


      • Personal Assistant


    • India Voice Assistant by Application


      • Messenger Bots


      • Websites


      • Contact Centers


    • Australia Outlook (USD Million, 2018-2030)


    • Australia Voice Assistant by Technology


      • Speech/Voice Recognition


      • Natural Language Processing


      • Text-to-Speech Recognition


    • Australia Voice Assistant by End User


      • Individual Users


      • Large Enterprises


      • Small & Medium Enterprise


    • Australia Voice Assistant by Product


      • Smart Speakers


      • Personal Assistant


    • Australia Voice Assistant by Application


      • Messenger Bots


      • Websites


      • Contact Centers


    • Rest of Asia-Pacific Outlook (USD Million, 2018-2030)


    • Rest of Asia-Pacific Voice Assistant by Technology


      • Speech/Voice Recognition


      • Natural Language Processing


      • Text-to-Speech Recognition


    • Rest of Asia-Pacific Voice Assistant by End User


      • Individual Users


      • Large Enterprises


      • Small & Medium Enterprise


    • Rest of Asia-Pacific Voice Assistant by Product


      • Smart Speakers


      • Personal Assistant


    • Rest of Asia-Pacific Voice Assistant by Application


      • Messenger Bots


      • Websites


      • Contact Centers


  • Rest of the World Outlook (USD Million, 2018-2030)


    • Rest of the World Voice Assistant by Technology


      • Speech/Voice Recognition


      • Natural Language Processing


      • Text-to-Speech Recognition


    • Rest of the World Voice Assistant by End User


      • Individual Users


      • Large Enterprises


      • Small & Medium Enterprise


    • Rest of the World Voice Assistant by Product


      • Smart Speakers


      • Personal Assistant


    • Rest of the World Voice Assistant by Application


      • Messenger Bots


      • Websites


      • Contact Centers


    • Middle East Outlook (USD Million, 2018-2030)


    • Middle East Voice Assistant by Technology


      • Speech/Voice Recognition


      • Natural Language Processing


      • Text-to-Speech Recognition


    • Middle East Voice Assistant by End User


      • Individual Users


      • Large Enterprises


      • Small & Medium Enterprise


    • Middle East Voice Assistant by Product


      • Smart Speakers


      • Personal Assistant


    • Middle East Voice Assistant by Application


      • Messenger Bots


      • Websites


      • Contact Centers


    • Africa Outlook (USD Million, 2018-2030)


    • Africa Voice Assistant by Technology


      • Speech/Voice Recognition


      • Text-to-Speech Recognition


      • Natural Language Processing


    • Africa Voice Assistant by End User


      • Individual Users


      • Large Enterprises


      • Small & Medium Enterprise


    • Africa Voice Assistant by Product


      • Smart Speakers


      • Personal Assistant


    • Africa Voice Assistant by Application


      • Messenger Bots


      • Websites


      • Contact Centers


    • Latin America Outlook (USD Million, 2018-2030)


    • Latin America Voice Assistant by Technology


      • Speech/Voice Recognition


      • Natural Language Processing


      • Text-to-Speech Recognition


    • Latin America Voice Assistant by End User


      • Individual Users


      • Large Enterprises


      • Small & Medium Enterprise


    • Latin America Voice Assistant by Product


      • Smart Speakers


      • Personal Assistant


    • Latin America Voice Assistant by Application


      • Messenger Bots


      • Websites


      • Contact Centers


Research Methodology on Voice Assistant Market


Introduction:


The purpose of this research is to analyze the market for voice assistant. The study focuses on the current market for voice assistant and the future market potential. Various factors that influence the market are studied, such as technological trends, competitive dynamics, and potential applications. The study focuses on understanding the major drivers and restraining factors of the market and assesses the current market share of key players. It will also provide an overview of the key markets and segments within the voice assistant market.


Research Objective:


  • To develop an understanding of the overall market for voice assistant.

  • To analyze market dynamics including drivers and restraints.

  • To analyze the current market share of key players in the market.

  • To assess growth opportunities and future trends in the voice assistant market.


Research Methodology:


The research methodology adopted for this study includes both primary and secondary methods. The details of these are outlined below:


Primary Research:


Primary research involves gathering primary data from direct face-to-face interviews and surveys. For this research, the primary research includes interviews with voice assistant industry experts and stakeholders who have experience in the market. These interviews help to gain further insight into the industry and its trends as well as the potential opportunities and constraints.


Secondary Research:


Secondary research involves analyzing secondary data such as market reports and studies, industry publications, industry databases, press releases, company websites, annual reports, news articles and executive summaries. This research helps to get a better understanding of the industry and its trends. Structured market databases are also used to identify the presence of leading companies in the market and to gain further insights into their strategies.


Data Analysis:


Once the data is collected from primary and secondary sources, the data is analyzed and interpreted to gain a better understanding of the market. The analysis is performed in several stages including an analysis of the macro-environment and trends in the industry, an analysis of market drivers, restraints and opportunities and an analysis of the market shares of the leading players. The analysis is used to draw conclusions and insights about the future of the voice assistant market.


Conclusion:


The research is conducted using both primary and secondary research methods to gain an understanding of the current and future potential of the voice assistant market and its associated dynamics. The research is conducted to assess the major drivers, restraints, and opportunities of the voice assistant market. The study also provides an in-depth analysis of the major market share of key players in the industry. The analysis and insights derived from the research will further help to determine the future trends of the market.

Leading companies partner with us for data-driven Insights
client_1 client_2 client_3 client_4 client_5 client_6 client_7 client_8 client_9 client_10
Please fill in Business Email for Quick Response

TABLE OF CONTENTS

1. EXECUTIVE SUMMARY

1.1. Market Attractiveness Analysis

1.1.1. GlobalVoice Assistant, by Technology

1.1.2. Global Voice Assistant, by Application

1.1.3. Global Voice Assistant, by End User

1.1.4. Global Voice Assistant, by Hardware Product

1.1.5. GlobalVoice Assistant, by Region

2. MARKET INTRODUCTION

2.1. Definition

2.2. Scope of the Study

2.3. Market Structure

3. RESEARCH METHODOLOGY

3.1. Research Process

3.2. Primary Research

3.3. Secondary Research

3.4. Market Size Estimation

3.5. List of Assumptions

4. MARKET DYNAMICS

4.1. Introduction

4.2. Drivers

4.2.1. Growing popularity of connected devices

4.2.2. Increasing adoption of smart homes

4.2.3. Increasing instance of voice search

4.2.4. High demand for self-service applications

4.2.5. Driver Impact Analysis

4.3. Restraints

4.3.1. Limited integration of voice assistants with devices

4.4. Opportunities

4.4.1. Advancements in artificial intelligence

4.5. Challenges

4.5.1. Complexity in integrating multiple languages

4.6. Impact of COVID-19

4.6.1. Impact on voice assistant platform

4.6.2. Increasing uptick of voice assistants during the pandemic

4.6.3. Increased investments in voice technology amidst the pandemic

5. MARKET FACTOR ANALYSIS

5.1. Value Chain Analysis/Supply Chain Analysis

5.2. Porter’s Five Forces Model

5.2.1. Threat of New Entrants

5.2.2. Bargaining Power of Suppliers

5.2.3. Threat of Substitutes

5.2.4. Bargaining Power of Buyers

5.2.5. Intensity of Rivalry

6. GLOBALVOICE ASSISTANT, BY TECHNOLOGY

6.1. Introduction

6.2. Natural Language Processing

6.3. Speech/Voice Recognition

6.4. Text to Speech Recognition

7. GLOBAL VOICE ASSISTANT, BYAPPLICATION

7.1. Introduction

7.2. Websites

7.3. Contact Centers

7.4. Messenger Bots

7.5. Others

8. GLOBAL VOICE ASSISTANT, BY END USER

8.1. Introduction

8.2. Individual Users

8.3. Large Enterprises

8.4. Small & Medium Enterprise

9. GLOBAL VOICE ASSISTANT, BY HARDWARE PRODUCT

9.1. Introduction

9.2. Smart Speakers & Personal Assistant

9.2.1. Amazon Alexa

9.2.2. Google Assistant

9.2.3. Baidu Duer

9.2.4. Others-Alibaba, Xiaomi

9.2.5. Bixby

9.2.6. Siri

9.2.7. JBL

9.2.8. Nuance Nina

9.2.9. NetgearOrbi Voice

9.3. Laptop, Smart Phone & Tablets

9.3.1.

9.4. Set-Top Box (Covering Remote Control with Mic and Far Field Mic)

9.5. Others-PC, Wearable Device, and Healthcare

10. GLOBALVOICE ASSISTANT, BY REGION

10.1. Overview

10.2. North America

10.2.1. Market Size & Estimates, by Country, 2017–2027

10.2.2. Market Size & Estimates, by Technology, 2017–2027

10.2.3. Market Size & Estimates, by Application, 2017–2027

10.2.4. Market Size & Estimates, by End User, 2017–2027

10.2.5. Market Size & Estimates, by Hardware Product, 2017–2027

10.2.6. US

10.2.6.1. Market Size & Estimates, by Technology, 2017–2027

10.2.6.2. Market Size & Estimates, by Application, 2017–2027

10.2.6.3. Market Size & Estimates, by End User, 2017–2027

10.2.6.4. Market Size & Estimates, by Hardware Product, 2017–2027

10.2.7. Canada

10.2.7.1. Market Size & Estimates, by Technology, 2017–2027

10.2.7.2. Market Size & Estimates, by Application, 2017–2027

10.2.7.3. Market Size & Estimates, by End User, 2017–2027

10.2.7.4. Market Size & Estimates, by Hardware Product, 2017–2027

10.2.8. Mexico

10.2.8.1. Market Size & Estimates, by Technology, 2017–2027

10.2.8.2. Market Size & Estimates, by Application, 2017–2027

10.2.8.3. Market Size & Estimates, by End User, 2017–2027

10.2.8.4. Market Size & Estimates, by Hardware Product, 2017–2027

10.3. Europe

10.3.1. Market Size & Estimates, by Country, 2017–2027

10.3.2. Market Size & Estimates, by Technology, 2017–2027

10.3.3. Market Size & Estimates, by Application, 2017–2027

10.3.4. Market Size & Estimates, by End User, 2017–2027

10.3.5. Market Size & Estimates, by Hardware Product, 2017–2027

10.3.6. UK

10.3.6.1. Market Size & Estimates, by Technology, 2017–2027

10.3.6.2. Market Size & Estimates, by Application, 2017–2027

10.3.6.3. Market Size & Estimates, by End User, 2017–2027

10.3.6.4. Market Size & Estimates, by Hardware Product, 2017–2027

10.3.7. Germany

10.3.7.1. Market Size & Estimates, by Technology, 2017–2027

10.3.7.2. Market Size & Estimates, by Application, 2017–2027

10.3.7.3. Market Size & Estimates, by End User, 2017–2027

10.3.7.4. Market Size & Estimates, by Hardware Product, 2017–2027

10.3.8. France

10.3.8.1. Market Size & Estimates, by Technology, 2017–2027

10.3.8.2. Market Size & Estimates, by Application, 2017–2027

10.3.8.3. Market Size & Estimates, by End User, 2017–2027

10.3.8.4. Market Size & Estimates, by Hardware Product, 2017–2027

10.3.9. Italy

10.3.9.1. Market Size & Estimates, by Technology, 2017–2027

10.3.9.2. Market Size & Estimates, by Application, 2017–2027

10.3.9.3. Market Size & Estimates, by End User, 2017–2027

10.3.9.4. Market Size & Estimates, by Hardware Product, 2017–2027

10.3.10. Spain

10.3.10.1. Market Size & Estimates, by Technology, 2017–2027

10.3.10.2. Market Size & Estimates, by Application, 2017–2027

10.3.10.3. Market Size & Estimates, by End User, 2017–2027

10.3.10.4. Market Size & Estimates, by Hardware Product, 2017–2027

10.3.11. Rest of Europe

10.3.11.1. Market Size & Estimates, by Technology, 2017–2027

10.3.11.2. Market Size & Estimates, by Application, 2017–2027

10.3.11.3. Market Size & Estimates, by End User, 2017–2027

10.3.11.4. Market Size & Estimates, by Hardware Product, 2017–2027

10.4. Asia-Pacific

10.4.1. Market Size & Estimates, by Country, 2017–2027

10.4.2. Market Size & Estimates, by Technology, 2017–2027

10.4.3. Market Size & Estimates, by Application, 2017–2027

10.4.4. Market Size & Estimates, by End User, 2017–2027

10.4.5. Market Size & Estimates, by Hardware Product, 2017–2027

10.4.6. China

10.4.6.1. Market Size & Estimates, by Technology, 2017–2027

10.4.6.2. Market Size & Estimates, by Application, 2017–2027

10.4.6.3. Market Size & Estimates, by End User, 2017–2027

10.4.6.4. Market Size & Estimates, by Hardware Product, 2017–2027

10.4.7. Japan

10.4.7.1. Market Size & Estimates, by Technology, 2017–2027

10.4.7.2. Market Size & Estimates, by Application, 2017–2027

10.4.7.3. Market Size & Estimates, by End User, 2017–2027

10.4.7.4. Market Size & Estimates, by Hardware Product, 2017–2027

10.4.8. Australia

10.4.8.1. Market Size & Estimates, by Technology, 2017–2027

10.4.8.2. Market Size & Estimates, by Application, 2017–2027

10.4.8.3. Market Size & Estimates, by End User, 2017–2027

10.4.8.4. Market Size & Estimates, by Hardware Product, 2017–2027

10.4.9. India

10.4.9.1. Market Size & Estimates, by Technology, 2017–2027

10.4.9.2. Market Size & Estimates, by Application, 2017–2027

10.4.9.3. Market Size & Estimates, by End User, 2017–2027

10.4.9.4. Market Size & Estimates, by Hardware Product, 2017–2027

10.4.10. Singapore

10.4.10.1. Market Size & Estimates, by Technology, 2017–2027

10.4.10.2. Market Size & Estimates, by Application, 2017–2027

10.4.10.3. Market Size & Estimates, by End User, 2017–2027

10.4.10.4. Market Size & Estimates, by Hardware Product, 2017–2027

10.4.11. Rest of Asia-Pacific

10.4.11.1. Market Size & Estimates, by Technology, 2017–2027

10.4.11.2. Market Size & Estimates, by Application, 2017–2027

10.4.11.3. Market Size & Estimates, by End User, 2017–2027

10.4.11.4. Market Size & Estimates, by Hardware Product, 2017–2027

10.5. Rest of the World

10.5.1. Middle East & Africa

10.5.1.1. Market Size & Estimates, by Technology, 2017–2027

10.5.1.2. Market Size & Estimates, by Application, 2017–2027

10.5.1.3. Market Size & Estimates, by End User, 2017–2027

10.5.1.4. Market Size & Estimates, by Hardware Product, 2017–2027

10.5.2. South America

10.5.2.1. Market Size & Estimates, by Technology, 2017–2027

10.5.2.2. Market Size & Estimates, by Application, 2017–2027

10.5.2.3. Market Size & Estimates, by End User, 2017–2027

10.5.2.4. Market Size & Estimates, by Hardware Product, 2017–2027

11. COMPETITIVE LANDSCAPE

11.1. Introduction

11.2. KeyPlayersMarket Share Analysis, 2020 (%)

11.3. Competitive Benchmarking

11.4. Competitor Dashboard

11.5. Major Growth Strategy in the market

11.6. Key Developments & Growth Strategies

11.6.1. New Product Developments

11.6.2. Mergers & Acquisitions

11.6.3. Contracts & Agreements

12. COMPANY PROFILES

12.1. IBM Corporation (US)

12.1.1. Company Overview

12.1.2. Financial Overview

12.1.3. Products/Services/Solutions Offered

12.1.4. Key Developments

12.1.5. SWOT Analysis

12.1.6. Key Strategies

12.2. Nuance Communications, Inc. (US)

12.2.1. Company Overview

12.2.2. Financial Overview

12.2.3. Products/Services/Solutions Offered

12.2.4. Key Developments

12.2.5. SWOT Analysis

12.2.6. Key Strategies

12.3. Amazon.com, Inc. (US)

12.3.1. Company Overview

12.3.2. Financial Overview

12.3.3. Products/Services/Solutions Offered

12.3.4. Key Developments

12.3.5. SWOT Analysis

12.3.6. Key Strategies

12.4. Microsoft (US)

12.4.1. Company Overview

12.4.2. Financial Overview

12.4.3. Products/Services/Solutions Offered

12.4.4. Key Developments

12.4.5. SWOT Analysis

12.4.6. Key Strategies

12.5. Google LLC (US)

12.5.1. Company Overview

12.5.2. Financial Overview

12.5.3. Products/Services/Solutions Offered

12.5.4. Key Developments

12.5.5. SWOT Analysis

12.5.6. Key Strategies

12.6. Apple Inc. (US)

12.6.1. Company Overview

12.6.2. Financial Overview

12.6.3. Products/Services/Solutions Offered

12.6.4. Key Developments

12.6.5. SWOT Analysis

12.6.6. Key Strategies

12.7. Samsung Electronics (South Korea)

12.7.1. Company Overview

12.7.2. Financial Overview

12.7.3. Products/Services/Solutions Offered

12.7.4. Key Developments

12.7.5. SWOT Analysis

12.7.6. Key Strategies

12.8. Cisco Systems, Inc. (US)

12.8.1. Company Overview

12.8.2. Financial Overview

12.8.3. Products/Services/Solutions Offered

12.8.4. Key Developments

12.8.5. SWOT Analysis

12.8.6. Key Strategies

12.9. Orange S.A. (France)

12.9.1. Company Overview

12.9.2. Financial Overview

12.9.3. Products/Services/Solutions Offered

12.9.4. Key Developments

12.9.5. SWOT Analysis

12.9.6. Key Strategies

12.10. Verint Systems Inc. (US)

12.10.1. Company Overview

12.10.2. Financial Overview

12.10.3. Products/Services/Solutions Offered

12.10.4. Key Developments

12.10.5. SWOT Analysis

12.10.6. Key Strategies

12.11. Creative Virtual Ltd. (UK)

12.11.1. Company Overview

12.11.2. Financial Overview

12.11.3. Products/Services/Solutions Offered

12.11.4. Key Developments

12.11.5. SWOT Analysis

12.11.6. Key Strategies

LIST OF TABLES

TABLE 1 MARKET SYNOPSIS

TABLE 2 GLOBAL VOICE ASSISTANT MARKET, BY TECHNOLOGY, 2017–2027 (USD MILLION)

TABLE 3 GLOBAL VOICE ASSISTANT MARKET, BY APPLICATIONS, 2017–2027 (USD MILLION)

TABLE 4 GLOBAL VOICE ASSISTANT MARKET, BY END USER, 2017–2027 (USD MILLION)

TABLE 5 GLOBAL VOICE ASSISTANT MARKET, BY HARDWARE PRODUCTS, 2017–2027 (USD MILLION)

TABLE 6 GLOBAL VOICE ASSISTANT MARKET, BY SMART SPEAKERS, 2017–2027 (USD MILLION)

TABLE 7 GLOBAL VOICE ASSISTANT MARKET, BY REGION, 2017–2027 (USD MILLION)

TABLE 8 NORTH AMERICA VOICE ASSISTANT MARKET, BY COUNTRY, 2017–2027 (USD MILLION)

TABLE 9 NORTH AMERICA VOICE ASSISTANT MARKET, BYTECHNOLOGY, 2017–2027 (USD MILLION)

TABLE 10 NORTH AMERICA VOICE ASSISTANT MARKET, BYAPPLICATION, 2017–2027 (USD MILLION)

TABLE 11 NORTH AMERICA VOICE ASSISTANT MARKET, BYEND USER, 2017–2027 (USD MILLION)

TABLE 12 NORTH AMERICA VOICE ASSISTANT MARKET, BYHARDWARE PRODUCTS, 2017–2027 (USD MILLION)

TABLE 13 NORTH AMERICA VOICE ASSISTANT MARKET, BYSMART SPEAKERS, 2017–2027 (USD MILLION)

TABLE 14 US: VOICE ASSISTANT MARKET, BY TECHNOLOGY, 2017–2027 (USD MILLION)

TABLE 15 US: VOICE ASSISTANT MARKET, BY APPLICATIONS, 2017–2027 (USD MILLION)

TABLE 16 US: VOICE ASSISTANT MARKET, BY END USER, 2017–2027 (USD MILLION)

TABLE 17 US: VOICE ASSISTANT MARKET, BY HARDWARE PRODUCTS, 2017–2027 (USD MILLION)

TABLE 18 US: VOICE ASSISTANT MARKET, BY SMART SPEAKERS, 2017–2027 (USD MILLION)

TABLE 19 CANADA: VOICE ASSISTANT MARKET, BY TECHNOLOGY, 2017–2027 (USD MILLION)

TABLE 20 CANADA: VOICE ASSISTANT MARKET, BY APPLICATIONS, 2017–2027 (USD MILLION)

TABLE 21 CANADA: VOICE ASSISTANT MARKET, BY END USER, 2017–2027 (USD MILLION)

TABLE 22 CANADA: VOICE ASSISTANT MARKET, BY HARDWARE PRODUCTS, 2017–2027 (USD MILLION)

TABLE 23 CANADA: VOICE ASSISTANT MARKET, BY SMART SPEAKERS, 2017–2027 (USD MILLION)

TABLE 24 MEXICO: VOICE ASSISTANT MARKET, BY TECHNOLOGY, 2017–2027 (USD MILLION)

TABLE 25 MEXICO: VOICE ASSISTANT MARKET, BY APPLICATIONS, 2017–2027 (USD MILLION)

TABLE 26 MEXICO: VOICE ASSISTANT MARKET, BY END USER, 2017–2027 (USD MILLION)

TABLE 27 MEXICO: VOICE ASSISTANT MARKET, BY HARDWARE PRODUCTS, 2017–2027 (USD MILLION)

TABLE 28 MEXICO: VOICE ASSISTANT MARKET, BY SMART SPEAKERS, 2017–2027 (USD MILLION)

TABLE 29 EUROPE VOICE ASSISTANT MARKET, BY COUNTRY, 2017–2027 (USD MILLION)

TABLE 30 EUROPE VOICE ASSISTANT MARKET, BY TECHNOLOGY, 2017–2027 (USD MILLION)

TABLE 31 EUROPE VOICE ASSISTANT MARKET, BY APPLICATION, 2017–2027 (USD MILLION)

TABLE 32 EUROPE VOICE ASSISTANT MARKET, BY END USER, 2017–2027 (USD MILLION)

TABLE 33 EUROPE VOICE ASSISTANT MARKET, BY HARDWARE PRODUCTS, 2017–2027 (USD MILLION)

TABLE 34 EUROPE VOICE ASSISTANT MARKET, BY SMART SPEAKERS, 2017–2027 (USD MILLION)

TABLE 35 UK: VOICE ASSISTANT MARKET, BY TECHNOLOGY, 2017–2027 (USD MILLION)

TABLE 36 UK: VOICE ASSISTANT MARKET, BY APPLICATIONS, 2017–2027 (USD MILLION)

TABLE 37 UK: VOICE ASSISTANT MARKET, BY END USER, 2017–2027 (USD MILLION)

TABLE 38 UK: VOICE ASSISTANT MARKET, BY HARDWARE PRODUCTS, 2017–2027 (USD MILLION)

TABLE 39 UK: VOICE ASSISTANT MARKET, BY SMART SPEAKERS, 2017–2027 (USD MILLION)

TABLE 40 GERMANY: VOICE ASSISTANT MARKET, BY TECHNOLOGY, 2017–2027 (USD MILLION)

TABLE 41 GERMANY: VOICE ASSISTANT MARKET, BY APPLICATIONS, 2017–2027 (USD MILLION)

TABLE 42 GERMANY: VOICE ASSISTANT MARKET, BY END USER, 2017–2027 (USD MILLION)

TABLE 43 GERMANY: VOICE ASSISTANT MARKET, BY HARDWARE PRODUCTS, 2017–2027 (USD MILLION)

TABLE 44 GERMANY: VOICE ASSISTANT MARKET, BY SMART SPEAKERS, 2017–2027 (USD MILLION)

TABLE 45 FRANCE: VOICE ASSISTANT MARKET, BY TECHNOLOGY, 2017–2027 (USD MILLION)

TABLE 46 FRANCE: VOICE ASSISTANT MARKET, BY APPLICATIONS, 2017–2027 (USD MILLION)

TABLE 47 FRANCE: VOICE ASSISTANT MARKET, BY END USER, 2017–2027 (USD MILLION)

TABLE 48 FRANCE: VOICE ASSISTANT MARKET, BY HARDWARE PRODUCTS, 2017–2027 (USD MILLION)

TABLE 49 FRANCE: VOICE ASSISTANT MARKET, BY SMART SPEAKERS, 2017–2027 (USD MILLION)

TABLE 50 ITALY: VOICE ASSISTANT MARKET, BY TECHNOLOGY, 2017–2027 (USD MILLION)

TABLE 51 ITALY: VOICE ASSISTANT MARKET, BY APPLICATIONS, 2017–2027 (USD MILLION)

TABLE 52 ITALY: VOICE ASSISTANT MARKET, BY END USER, 2017–2027 (USD MILLION)

TABLE 53 ITALY: VOICE ASSISTANT MARKET, BY HARDWARE PRODUCTS, 2017–2027 (USD MILLION)

TABLE 54 ITALY: VOICE ASSISTANT MARKET, BY SMART SPEAKERS, 2017–2027 (USD MILLION)

TABLE 55 SPAIN: VOICE ASSISTANT MARKET, BY TECHNOLOGY, 2017–2027 (USD MILLION)

TABLE 56 SPAIN: VOICE ASSISTANT MARKET, BY APPLICATIONS, 2017–2027 (USD MILLION)

TABLE 57 SPAIN: VOICE ASSISTANT MARKET, BY END USER, 2017–2027 (USD MILLION)

TABLE 58 SPAIN: VOICE ASSISTANT MARKET, BY HARDWARE PRODUCTS, 2017–2027 (USD MILLION)

TABLE 59 SPAIN: VOICE ASSISTANT MARKET, BY SMART SPEAKERS, 2017–2027 (USD MILLION)

TABLE 60 REST OF EUROPE: VOICE ASSISTANT MARKET, BY TECHNOLOGY, 2017–2027 (USD MILLION)

TABLE 61 REST OF EUROPE: VOICE ASSISTANT MARKET, BY APPLICATIONS, 2017–2027 (USD MILLION)

TABLE 62 REST OF EUROPE: VOICE ASSISTANT MARKET, BY END USER, 2017–2027 (USD MILLION)

TABLE 63 REST OF EUROPE: VOICE ASSISTANT MARKET, BY HARDWARE PRODUCTS, 2017–2027 (USD MILLION)

TABLE 64 REST OF EUROPE: VOICE ASSISTANT MARKET, BY SMART SPEAKERS, 2017–2027 (USD MILLION)

TABLE 65 ASIA-PACIFIC VOICE ASSISTANT MARKET, BY COUNTRY, 2017–2027 (USD MILLION)

TABLE 66 ASIA-PACIFIC VOICE ASSISTANT MARKET, BY TECHNOLOGY, 2017–2027 (USD MILLION)

TABLE 67 ASIA-PACIFIC VOICE ASSISTANT MARKET, BY APPLICATION, 2017–2027 (USD MILLION)

TABLE 68 ASIA-PACIFIC VOICE ASSISTANT MARKET, BY END USER, 2017–2027 (USD MILLION)

TABLE 69 ASIA-PACIFIC VOICE ASSISTANT MARKET, BY HARDWARE PRODUCTS, 2017–2027 (USD MILLION)

TABLE 70 ASIA-PACIFIC VOICE ASSISTANT MARKET, BY SMART SPEAKERS, 2017–2027 (USD MILLION)

TABLE 71 CHINA: VOICE ASSISTANT MARKET, BY TECHNOLOGY, 2017–2027 (USD MILLION)

TABLE 72 CHINA: VOICE ASSISTANT MARKET, BY APPLICATIONS, 2017–2027 (USD MILLION)

TABLE 73 CHINA: VOICE ASSISTANT MARKET, BY END USER, 2017–2027 (USD MILLION)

TABLE 74 CHINA: VOICE ASSISTANT MARKET, BY HARDWARE PRODUCTS, 2017–2027 (USD MILLION)

TABLE 75 CHINA: VOICE ASSISTANT MARKET, BY SMART SPEAKERS, 2017–2027 (USD MILLION)

TABLE 76 JAPAN: VOICE ASSISTANT MARKET, BY TECHNOLOGY, 2017–2027 (USD MILLION)

TABLE 77 JAPAN: VOICE ASSISTANT MARKET, BY APPLICATIONS, 2017–2027 (USD MILLION)

TABLE 78 JAPAN: VOICE ASSISTANT MARKET, BY END USER, 2017–2027 (USD MILLION)

TABLE 79 JAPAN: VOICE ASSISTANT MARKET, BY HARDWARE PRODUCTS, 2017–2027 (USD MILLION)

TABLE 80 JAPAN: VOICE ASSISTANT MARKET, BY SMART SPEAKERS, 2017–2027 (USD MILLION)

TABLE 81 AUSTRALIA: VOICE ASSISTANT MARKET, BY TECHNOLOGY, 2017–2027 (USD MILLION)

TABLE 82 AUSTRALIA: VOICE ASSISTANT MARKET, BY APPLICATIONS, 2017–2027 (USD MILLION)

TABLE 83 AUSTRALIA: VOICE ASSISTANT MARKET, BY END USER, 2017–2027 (USD MILLION)

TABLE 84 AUSTRALIA: VOICE ASSISTANT MARKET, BY HARDWARE PRODUCTS, 2017–2027 (USD MILLION)

TABLE 85 AUSTRALIA: VOICE ASSISTANT MARKET, BY SMART SPEAKERS, 2017–2027 (USD MILLION)

TABLE 86 INDIA: VOICE ASSISTANT MARKET, BY TECHNOLOGY, 2017–2027 (USD MILLION)

TABLE 87 INDIA: VOICE ASSISTANT MARKET, BY APPLICATIONS, 2017–2027 (USD MILLION)

TABLE 88 INDIA: VOICE ASSISTANT MARKET, BY END USER, 2017–2027 (USD MILLION)

TABLE 89 INDIA: VOICE ASSISTANT MARKET, BY HARDWARE PRODUCTS, 2017–2027 (USD MILLION)

TABLE 90 INDIA: VOICE ASSISTANT MARKET, BY SMART SPEAKERS, 2017–2027 (USD MILLION)

TABLE 91 SINGAPORE: VOICE ASSISTANT MARKET, BY TECHNOLOGY, 2017–2027 (USD MILLION)

TABLE 92 SINGAPORE: VOICE ASSISTANT MARKET, BY APPLICATIONS, 2017–2027 (USD MILLION)

TABLE 93 SINGAPORE: VOICE ASSISTANT MARKET, BY END USER, 2017–2027 (USD MILLION)

TABLE 94 SINGAPORE: VOICE ASSISTANT MARKET, BY HARDWARE PRODUCTS, 2017–2027 (USD MILLION)

TABLE 95 SINGAPORE: VOICE ASSISTANT MARKET, BY SMART SPEAKERS, 2017–2027 (USD MILLION)

TABLE 96 REST OF ASIA-PACIFIC: VOICE ASSISTANT MARKET, BY TECHNOLOGY, 2017–2027 (USD MILLION)

TABLE 97 REST OF ASIA-PACIFIC: VOICE ASSISTANT MARKET, BY APPLICATIONS, 2017–2027 (USD MILLION)

TABLE 98 REST OF ASIA-PACIFIC: VOICE ASSISTANT MARKET, BY END USER, 2017–2027 (USD MILLION)

TABLE 99 REST OF ASIA-PACIFIC: VOICE ASSISTANT MARKET, BY HARDWARE PRODUCTS, 2017–2027 (USD MILLION)

TABLE 100 REST OF ASIA-PACIFIC: VOICE ASSISTANT MARKET, BY SMART SPEAKERS, 2017–2027 (USD MILLION)

TABLE 101 REST OF THE WORLD VOICE ASSISTANT MARKET, BY COUNTRY, 2017–2027 (USD MILLION)

TABLE 102 REST OF THE WORLD VOICE ASSISTANT MARKET, BY TECHNOLOGY, 2017–2027 (USD MILLION)

TABLE 103 REST OF THE WORLD VOICE ASSISTANT MARKET, BY APPLICATION, 2017–2027 (USD MILLION)

TABLE 104 REST OF THE WORLD VOICE ASSISTANT MARKET, BY END USER, 2017–2027 (USD MILLION)

TABLE 105 REST OF THE WORLD VOICE ASSISTANT MARKET, BY HARDWARE PRODUCTS, 2017–2027 (USD MILLION)

TABLE 106 REST OF THE WORLD VOICE ASSISTANT MARKET, BY SMART SPEAKERS, 2017–2027 (USD MILLION)

TABLE 107 MIDDLE EAST & AFRICA: VOICE ASSISTANT MARKET, BY TECHNOLOGY, 2017–2027 (USD MILLION)

TABLE 108 MIDDLE EAST & AFRICA: VOICE ASSISTANT MARKET, BY APPLICATIONS, 2017–2027 (USD MILLION)

TABLE 109 MIDDLE EAST & AFRICA: VOICE ASSISTANT MARKET, BY END USER, 2017–2027 (USD MILLION)

TABLE 110 MIDDLE EAST & AFRICA: VOICE ASSISTANT MARKET, BY HARDWARE PRODUCTS, 2017–2027 (USD MILLION)

TABLE 111 MIDDLE EAST & AFRICA: VOICE ASSISTANT MARKET, BY SMART SPEAKERS, 2017–2027 (USD MILLION)

TABLE 112 SOUTH AMERICA: VOICE ASSISTANT MARKET, BY TECHNOLOGY, 2017–2027 (USD MILLION)

TABLE 113 SOUTH AMERICA: VOICE ASSISTANT MARKET, BY APPLICATIONS, 2017–2027 (USD MILLION)

TABLE 114 SOUTH AMERICA: VOICE ASSISTANT MARKET, BY END USER, 2017–2027 (USD MILLION)

TABLE 115 SOUTH AMERICA: VOICE ASSISTANT MARKET, BY HARDWARE PRODUCTS, 2017–2027 (USD MILLION)

TABLE 116 SOUTH AMERICA: VOICE ASSISTANT MARKET, BY SMART SPEAKERS, 2017–2027 (USD MILLION)

TABLE 117 PRODUCT DEVELOPMENT/ ENHANCEMENT/ LAUNCH

TABLE 118 PARTNERSHIPS/AGREEMENTS/CONTRACTS/COLLABORATIONS

TABLE 119 ACQUISITIONS/ MERGERS/ JOINT VENTURE

TABLE 120 IBM CORPORATION: PRODUCTS OFFERED

TABLE 121 IBM CORPORATION KEY DEVELOPMENTS

TABLE 122 NUANCE COMMUNICATIONS: PRODUCTS OFFERED

TABLE 123 NUANCE COMMUNICATIONS: KEY DEVELOPMENTS

TABLE 124 AMAZON.COM, INC.: PRODUCTS OFFERED

TABLE 125 AMAZON.COM, INC.: KEY DEVELOPMENTS

TABLE 126 MICROSOFT CORPORATION: SOFTWARE OFFERED

TABLE 127 MICROSOFT CORPORATION: KEY DEVELOPMENTS

TABLE 128 GOOGLE LLC: SOFTWARE OFFERED

TABLE 129 GOOGLE LLC: KEY DEVELOPMENTS

TABLE 130 APPLE INC: SOFTWARE OFFERED

TABLE 131 APPLE INC: KEY DEVELOPMENTS

TABLE 132 SAMSUNG ELECTRONICS: SOFTWARE OFFERED

TABLE 133 SAMSUNG ELECTRONICS: KEY DEVELOPMENTS

TABLE 134 CISCO SYSTEMS, INC: SOFTWARE OFFERED

TABLE 135 CISCO SYSTEMS, INC: KEY DEVELOPMENTS

TABLE 136 ORANGE S.A.: SOFTWARE OFFERED

TABLE 137 ORANGE S.A.: KEY DEVELOPMENTS

TABLE 138 VERINT SYSTEMS INC.: SOLUTION OFFERED

TABLE 139 VERINT SYSTEMS INC.: KEY DEVELOPMENTS

TABLE 140 CREATIVE VIRTUAL LTD: SOLUTION OFFERED

TABLE 141 CREATIVE VIRTUAL LTD: KEY DEVELOPMENTS

LIST OF FIGURES

FIGURE 1 MARKET ATTRACTIVENESS ANALYSIS: GLOBAL VOICE ASSISTANT MARKET

FIGURE 2 GLOBAL VOICE ASSISTANT MARKET: MARKET STRUCTURE

FIGURE 3 BOTTOM-UP AND TOP-DOWN APPROACHES

FIGURE 4 MARKET DYNAMICS ANALYSIS OF THE GLOBAL VOICE ASSISTANT MARKET

FIGURE 5 DRIVERS IMPACT ANALYSIS: VOICE ASSISTANT MARKET

FIGURE 6 RESTRAINTS IMPACT ANALYSIS: GLOBAL VOICE ASSISTANT MARKET

FIGURE 7 PORTER’S FIVE FORCES ANALYSIS: GLOBAL VOICE ASSISTANT MARKET

FIGURE 8 GLOBAL VOICE ASSISTANT MARKET, BY TECHNOLOGY, 2020 (% SHARE)

FIGURE 9 GLOBAL VOICE ASSISTANT MARKET, BY TECHNOLOGY, 2020 VS 2027 (USD MILLION)

FIGURE 10 GLOBAL VOICE ASSISTANT MARKET, BY APPLICATIONS, 2020 (% SHARE)

FIGURE 11 GLOBAL VOICE ASSISTANT MARKET, BY APPLICATIONS, 2020 VS 2027 (USD MILLION)

FIGURE 12 GLOBAL VOICE ASSISTANT MARKET, BY END USER, 2020 (% SHARE)

FIGURE 13 GLOBAL VOICE ASSISTANT MARKET, BY END USER, 2020 VS 2027

FIGURE 14 GLOBAL VOICE ASSISTANT MARKET, BY HARDWARE PRODUCTS, 2020 (% SHARE)

FIGURE 15 GLOBAL VOICE ASSISTANT MARKET, BY HARDWARE PRODUCTS, 2020 VS 2027 (USD MILLION)

FIGURE 16 GLOBAL VOICE ASSISTANT MARKET, BY SMART SPEAKERS, 2020 VS 2027 (USD MILLION)

FIGURE 17 GLOBAL VOICE ASSISTANT MARKET, BY REGION, 2020 (% SHARE)

FIGURE 18 GLOBAL VOICE ASSISTANT MARKET, BY REGION, 2020 VS 2027 (USD MILLION)

FIGURE 19 NORTH AMERICA VOICE ASSISTANT MARKET, BY COUNTRY, 2020 (% SHARE)

FIGURE 20 NORTH AMERICA VOICE ASSISTANT MARKET, BY COUNTRY, 2020 VS 2027 (USD MILLION)

FIGURE 21 NORTH AMERICA VOICE ASSISTANT MARKET, BY TECHNOLOGY, 2017–2027 (USD MILLION)

FIGURE 22 NORTH AMERICA VOICE ASSISTANT MARKET, BY APPLICATION, 2017–2027 (USD MILLION)

FIGURE 23 NORTH AMERICA VOICE ASSISTANT MARKET, BY END USER, 2017–2027 (USD MILLION)

FIGURE 24 NORTH AMERICA VOICE ASSISTANT MARKET, BY HARDWARE PRODUCTS, 2017–2027 (USD MILLION)

FIGURE 25 NORTH AMERICA VOICE ASSISTANT MARKET, BY SMART SPEAKERS, 2017–2027 (USD MILLION)

FIGURE 26 EUROPE VOICE ASSISTANT MARKET, BY COUNTRY, 2020 (% SHARE)

FIGURE 27 EUROPE VOICE ASSISTANT MARKET, BY COUNTRY, 2020 VS 2027 (USD MILLION)

FIGURE 28 EUROPE VOICE ASSISTANT MARKET, BY TECHNOLOGY, 2017–2027 (USD MILLION)

FIGURE 29 EUROPE VOICE ASSISTANT MARKET, BY APPLICATION, 2017–2027 (USD MILLION)

FIGURE 30 EUROPE VOICE ASSISTANT MARKET, BY END USER, 2017–2027 (USD MILLION)

FIGURE 31 EUROPE VOICE ASSISTANT MARKET, BY HARDWARE PRODUCTS, 2017–2027 (USD MILLION)

FIGURE 32 EUROPE VOICE ASSISTANT MARKET, BY SMART SPEAKERS, 2017–2027 (USD MILLION)

FIGURE 33 ASIA-PACIFIC VOICE ASSISTANT MARKET, BY COUNTRY, 2020 (% SHARE)

FIGURE 34 ASIA-PACIFIC VOICE ASSISTANT MARKET, BY COUNTRY, 2020 VS 2027 (USD MILLION)

FIGURE 35 ASIA-PACIFIC VOICE ASSISTANT MARKET, BY TECHNOLOGY, 2017–2027 (USD MILLION)

FIGURE 36 ASIA-PACIFIC VOICE ASSISTANT MARKET, BY APPLICATION, 2017–2027 (USD MILLION)

FIGURE 37 ASIA-PACIFIC VOICE ASSISTANT MARKET, BY END USER, 2017–2027 (USD MILLION)

FIGURE 38 ASIA-PACIFIC VOICE ASSISTANT MARKET, BY HARDWARE PRODUCTS, 2017–2027 (USD MILLION)

FIGURE 39 ASIA-PACIFIC VOICE ASSISTANT MARKET, BY SMART SPEAKERS, 2017–2027 (USD MILLION)

FIGURE 40 REST OF THE WORLD VOICE ASSISTANT MARKET, BY COUNTRY, 2020 (% SHARE)

FIGURE 41 REST OF THE WORLD VOICE ASSISTANT MARKET, BY COUNTRY, 2020 VS 2027 (USD MILLION)

FIGURE 42 REST OF THE WORLD VOICE ASSISTANT MARKET, BY TECHNOLOGY, 2017–2027 (USD MILLION)

FIGURE 43 REST OF THE WORLD VOICE ASSISTANT MARKET, BY APPLICATION, 2017–2027 (USD MILLION)

FIGURE 44 REST OF THE WORLD VOICE ASSISTANT MARKET, BY END USER, 2017–2027 (USD MILLION)

FIGURE 45 REST OF THE WORLD VOICE ASSISTANT MARKET, BY HARDWARE PRODUCTS, 2017–2027 (USD MILLION)

FIGURE 46 REST OF THE WORLD VOICE ASSISTANT MARKET, BY SMART SPEAKERS, 2017–2027 (USD MILLION)

FIGURE 47 KEY PLAYERS MARKET SHARE ANALYSIS, 2020 (%)

FIGURE 48 GLOBAL VOICE ASSISTANT MARKET: COMPETITIVE BENCHMARKING

FIGURE 49 IBM CORPORATION: FINANCIAL OVERVIEW SNAPSHOT

FIGURE 50 IBM CORPORATION: SWOT ANALYSIS

FIGURE 51 NUANCE COMMUNICATIONS: FINANCIAL OVERVIEW SNAPSHOT

FIGURE 52 NUANCE COMMUNICATIONS: SWOT ANALYSIS

FIGURE 53 AMAZON.COM, INC.: FINANCIAL OVERVIEW SNAPSHOT

FIGURE 54 AMAZON.COM, INC.: SWOT ANALYSIS

FIGURE 55 MICROSOFT CORPORATION: FINANCIAL OVERVIEW SNAPSHOT

FIGURE 56 MICROSOFT CORPORATION: SWOT ANALYSIS

FIGURE 57 GOOGLE LLC.: FINANCIAL OVERVIEW SNAPSHOT

FIGURE 58 GOOGLE LLC.: SWOT ANALYSIS

FIGURE 59 APPLE INC.: FINANCIAL OVERVIEW SNAPSHOT

FIGURE 60 APPLE INC: SWOT ANALYSIS

FIGURE 61 SAMSUNG ELECTRONICS: FINANCIAL OVERVIEW SNAPSHOT

FIGURE 62 SAMSUNG ELECTRONICS: SWOT ANALYSIS

FIGURE 63 CISCO SYSTEMS, INC: FINANCIAL OVERVIEW

FIGURE 64 CISCO SYSTEMS, INC: SWOT ANALYSIS

FIGURE 65 ORANGE S.A.: FINANCIAL OVERVIEW

FIGURE 66 ORANGE S.A.: SWOT ANALYSIS

FIGURE 67 VERINT SYSTEMS INC.: FINANCIAL OVERVIEW

FIGURE 68 VERINT SYSTEMS INC.: SWOT ANALYSIS

FIGURE 69 CREATIVE VIRTUAL LTD: SWOT ANALYSIS

Purchase Option
Single User $ 4,950
Multiuser License $ 5,950
Enterprise User $ 7,250
Compare Licenses
Tailored for You
  • Dedicated Research on any specifics segment or region.
  • Focused Research on specific players in the market.
  • Custom Report based only on your requirements.
  • Flexibility to add or subtract any chapter in the study.
  • Historic data from 2014 and forecasts outlook till 2040.
  • Flexibility of providing data/insights in formats (PDF, PPT, Excel).
  • Provide cross segmentation in applicable scenario/markets.