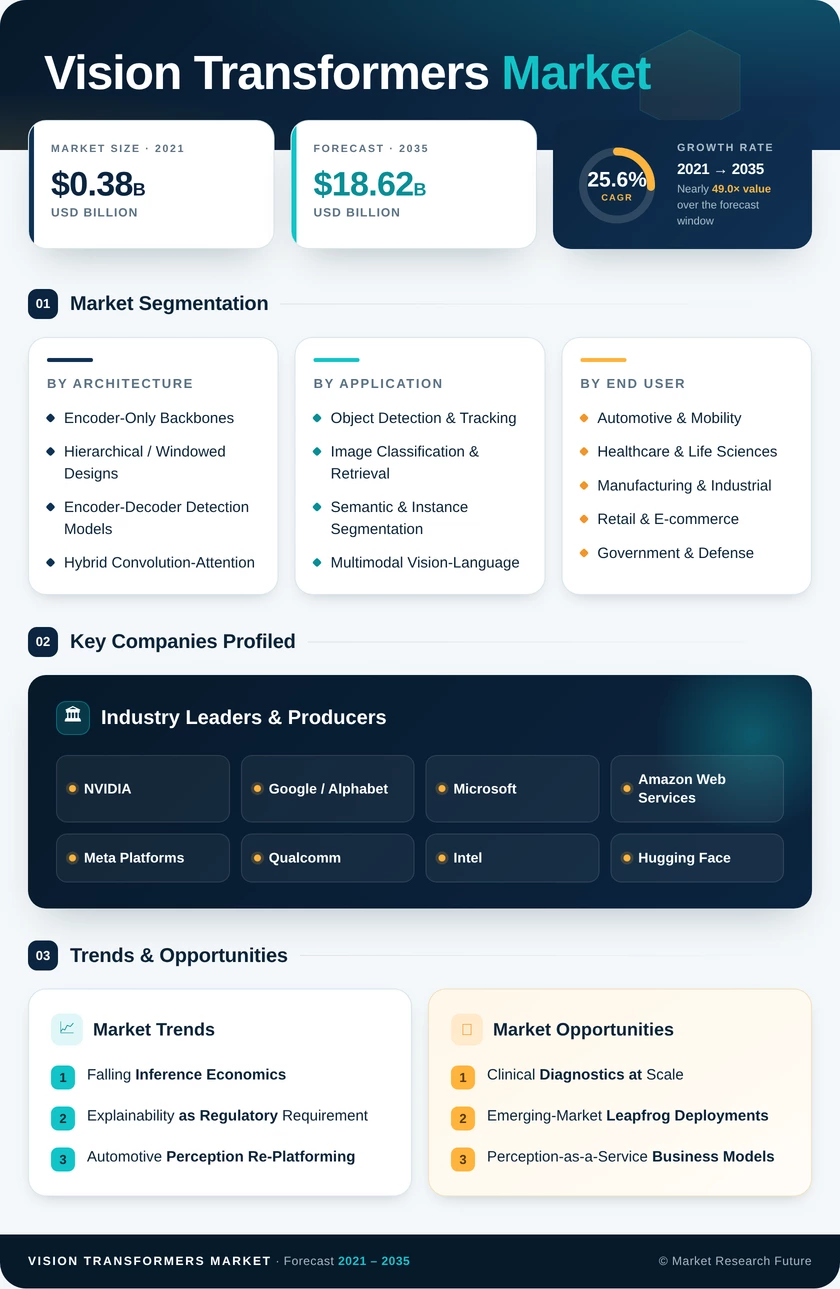
Vision Transformers Market (2026 - 2035)

ID: MRFR/EnP/21397-HCR 100 Pages Chitranshi Jaiswal Last Updated: October 16, 2026
Vision Transformers Market Research Report By Architecture (Encoder-Only Backbones, Hierarchical / Windowed Designs, Encoder-Decoder Detection Models, Hybrid Convolution-Attention), By Application (Object Detection & Tracking, Image Classification & Retrieval, Semantic & Instance Segmentation, Multimodal Vision-Language), By End User (Automotive & Mobility, Healthcare & Life Sciences, Manufacturing & Industrial, Retail & E-commerce, Government & Defense) - Forecast to 2035
Vision Transformers Market
Market Size
Forecast Period2026-2035
CAGR (2026-2035)25.6%
2025 Market SizeUSD 1.84 Billion
2035 Market SizeUSD 18.62 Billion
Key Players
NVIDIA
Google / Alphabet
Microsoft
Amazon Web Services
Meta Platforms
Qualcomm
Opportunities
  • Clinical Diagnostics at Scale
  • Emerging-Market Leapfrog Deployments
  • Perception-as-a-Service Business Models
  1. 1 Market Overview | |
    1. 1.1 Study Assumptions & Market Definition | |
    2. 1.2 Scope of the Study | |
    3. 1.3 Research Methodology | |
  2. 2 Market Summary & Key Takeaways | |
    1. 2.1 Key Takeaways by Architecture | |
    2. 2.2 Key Takeaways by Sector | |
    3. 2.3 Key Takeaways by Geography | |
  3. 3 Market Size & Forecast (2021–2035) | |
    1. 3.1 Historical Market Size (2021–2025) | |
    2. 3.2 Current & Forecast Market Size (2026–2035) | |
    3. 3.3 Year-over-Year Growth Analysis | |
  4. 4 Market Drivers Analysis | |
    1. 4.1 Falling Inference Economics | |
    2. 4.2 Explainability as Regulatory Requirement | |
    3. 4.3 Automotive Perception Re-Platforming | |
    4. 4.4 Open-Weight Backbone Proliferation | |
  5. 5 Market Restraints Analysis | |
    1. 5.1 The Data Appetite Problem | |
    2. 5.2 Edge Deployment Ceilings | |
    3. 5.3 Talent and Tooling Gaps | |
  6. 6 Market Opportunity Analysis | |
    1. 6.1 Clinical Diagnostics at Scale | |
    2. 6.2 Emerging-Market Leapfrog Deployments | |
    3. 6.3 Perception-as-a-Service Business Models | |
    4. 6.4 Annotation and Feedback Data Monetization | |
    5. 6.5 Sparse-Attention Silicon | |
    6. 6.6 Industry Value Chain Analysis | |
    7. 6.7 Porter's Five Forces Analysis | |
  7. 7 Regional Analysis | |
    1. 7.1 North America | | |
      1. 7.1.1 United States | | |
      2. 7.1.2 Canada | | |
      3. 7.1.3 Mexico | |
    2. 7.2 Europe | | |
      1. 7.2.1 Germany | | |
      2. 7.2.2 United Kingdom | | |
      3. 7.2.3 France | | |
      4. 7.2.4 Rest of Europe | |
    3. 7.3 Asia-Pacific | | |
      1. 7.3.1 China | | |
      2. 7.3.2 Japan | | |
      3. 7.3.3 India | | |
      4. 7.3.4 South Korea | | |
      5. 7.3.5 Rest of Asia-Pacific | |
    4. 7.4 South America | | |
      1. 7.4.1 Brazil | | |
      2. 7.4.2 Argentina | | |
      3. 7.4.3 Rest of South America | |
    5. 7.5 Middle East & Africa | | |
      1. 7.5.1 United Arab Emirates | | |
      2. 7.5.2 Saudi Arabia | | |
      3. 7.5.3 South Africa | | |
      4. 7.5.4 Rest of Middle East & Africa | |
  8. 8 Future Outlook (2026–2035) | |
    1. 8.1 Convergence with Robotic Manipulation | |
    2. 8.2 Inference Economics and Platform Consolidation | |
    3. 8.3 Regulatory Standardization | |
    4. 8.4 Energy and Sustainability Accounting | |
  9. 9 Segmentation Analysis | |
    1. 9.1 By Architecture | | |
      1. 9.1.1 Encoder-Only Backbones | | |
      2. 9.1.2 Hierarchical / Windowed Designs | | |
      3. 9.1.3 Encoder-Decoder Detection Models | | |
      4. 9.1.4 Hybrid Convolution-Attention | |
    2. 9.2 By Application | | |
      1. 9.2.1 Object Detection & Tracking | | |
      2. 9.2.2 Image Classification & Retrieval | | |
      3. 9.2.3 Semantic & Instance Segmentation | | |
      4. 9.2.4 Multimodal Vision-Language | |
    3. 9.3 By End User | | |
      1. 9.3.1 Automotive & Mobility | | |
      2. 9.3.2 Healthcare & Life Sciences | | |
      3. 9.3.3 Manufacturing & Industrial | | |
      4. 9.3.4 Retail & E-commerce | | |
      5. 9.3.5 Government & Defense | |
  10. 10 Competitive Landscape | |
    1. 10.1 Market Share Analysis (2026) | |
    2. 10.2 Competitive Benchmarking Matrix | |
    3. 10.3 Company Profiles | | |
      1. 10.3.1 NVIDIA | | |
      2. 10.3.2 Google / Alphabet | | |
      3. 10.3.3 Microsoft | | |
      4. 10.3.4 Amazon Web Services | | |
      5. 10.3.5 Meta Platforms | | |
      6. 10.3.6 Qualcomm | | |
      7. 10.3.7 Intel | | |
      8. 10.3.8 Hugging Face | | |
      9. 10.3.9 Baidu | | |
      10. 10.3.10 Scale AI | |
  11. 11 Recent Developments & News | |
  12. 12 Report Scope & Methodology | |
    1. 12.1 Study Period & Base Year | |
    2. 12.2 Valuation Approach | |
  13. 13 Detailed Sources & Citations | |
    1. 13.1 Primary Research Inputs | |
    2. 13.2 Secondary Data Sources | |
    3. 13.3 Abbreviations | |
  14. 14 Frequently Asked Questions (FAQs) | | LIST OF TABLES | |
  15. TABLE 1 Global Vision Transformers Market Size & Forecast, by Revenue (USD Billion), 2021–2035 | |
  16. TABLE 2 Global Vision Transformers Market – Year-over-Year Growth Analysis, 2021–2035 | |
  17. TABLE 3 Driver Impact Analysis Matrix, 2026–2035 | |
  18. TABLE 4 Restraint Impact Analysis Matrix, 2026–2035 | |
  19. TABLE 5 Global Vision Transformers Market Size, by Region, 2021–2035 (USD Billion) | |
  20. TABLE 6 North America Vision Transformers Market Size, by Country, 2021–2035 (USD Billion) | |
  21. TABLE 7 Europe Vision Transformers Market Size, by Country, 2021–2035 (USD Billion) | |
  22. TABLE 8 Asia-Pacific Vision Transformers Market Size, by Country, 2021–2035 (USD Billion) | |
  23. TABLE 9 South America Vision Transformers Market Size, by Country, 2021–2035 (USD Billion) | |
  24. TABLE 10 Middle East & Africa Vision Transformers Market Size, by Country, 2021–2035 (USD Billion) | |
  25. TABLE 11 Global Vision Transformers Market Size, by Architecture, 2021–2035 (USD Billion) | |
  26. TABLE 12 Global Vision Transformers Market Size, by Application, 2021–2035 (USD Billion) | |
  27. TABLE 13 Global Vision Transformers Market Size, by End User, 2021–2035 (USD Billion) | |
  28. TABLE 14 North America Vision Transformers Market Size, by Architecture, 2021–2035 (USD Billion) | |
  29. TABLE 15 North America Vision Transformers Market Size, by Application, 2021–2035 (USD Billion) | |
  30. TABLE 16 North America Vision Transformers Market Size, by End User, 2021–2035 (USD Billion) | |
  31. TABLE 17 Europe Vision Transformers Market Size, by Architecture, 2021–2035 (USD Billion) | |
  32. TABLE 18 Europe Vision Transformers Market Size, by Application, 2021–2035 (USD Billion) | |
  33. TABLE 19 Europe Vision Transformers Market Size, by End User, 2021–2035 (USD Billion) | |
  34. TABLE 20 Asia-Pacific Vision Transformers Market Size, by Architecture, 2021–2035 (USD Billion) | |
  35. TABLE 21 Asia-Pacific Vision Transformers Market Size, by Application, 2021–2035 (USD Billion) | |
  36. TABLE 22 Asia-Pacific Vision Transformers Market Size, by End User, 2021–2035 (USD Billion) | |
  37. TABLE 23 South America Vision Transformers Market Size, by Architecture, 2021–2035 (USD Billion) | |
  38. TABLE 24 South America Vision Transformers Market Size, by End User, 2021–2035 (USD Billion) | |
  39. TABLE 25 Middle East & Africa Vision Transformers Market Size, by Architecture, 2021–2035 (USD Billion) | |
  40. TABLE 26 Middle East & Africa Vision Transformers Market Size, by End User, 2021–2035 (USD Billion) | |
  41. TABLE 27 United States Vision Transformers Market Size, by Application, 2021–2035 (USD Billion) | |
  42. TABLE 28 China Vision Transformers Market Size, by Application, 2021–2035 (USD Billion) | |
  43. TABLE 29 Germany Vision Transformers Market Size, by End User, 2021–2035 (USD Billion) | |
  44. TABLE 30 India Vision Transformers Market Size, by End User, 2021–2035 (USD Billion) | |
  45. TABLE 31 Competitive Benchmarking Matrix – Global Vision Transformers Market, 2026 | |
  46. TABLE 32 Company Profiles – Key Players, Global Vision Transformers Market | |
  47. TABLE 33 Recent Developments & Strategic Announcements, 2023–2025 | |
  48. TABLE 34 Report Scope & Methodology Summary | |
  49. TABLE 35 Detailed Sources & Citations Index | | LIST OF FIGURES | |
  50. FIGURE 1 Global Vision Transformers Market – Market Dynamics Snapshot, 2026–2035 | |
  51. FIGURE 2 Industry Value Chain Analysis | |
  52. FIGURE 3 Porter's Five Forces Analysis | |
  53. FIGURE 4 Global Market Size Trend, 2021–2035 (USD Billion) | |
  54. FIGURE 5 Year-over-Year Growth Trend, 2022–2035 (%) | |
  55. FIGURE 6 Driver Impact Weighting Chart | |
  56. FIGURE 7 Restraint Impact Weighting Chart | |
  57. FIGURE 8 Market Share by Architecture, 2025 vs 2035 (%) | |
  58. FIGURE 9 Market Share by Application, 2025 vs 2035 (%) | |
  59. FIGURE 10 Market Share by End User, 2025 vs 2035 (%) | |
  60. FIGURE 11 Regional Market Share, 2025 (%) | |
  61. FIGURE 12 Regional Market Share, 2035 (%) | |
  62. FIGURE 13 Regional CAGR Comparison, 2026–2035 (%) | |
  63. FIGURE 14 North America Country-Level Share Distribution, 2025 (%) | |
  64. FIGURE 15 Asia-Pacific Country-Level Share Distribution, 2025 (%) | |
  65. FIGURE 16 Competitive Landscape – Revenue Share Distribution, 2026 (%) | |
  66. FIGURE 17 Competitive Positioning Quadrant | |
  67. FIGURE 18 Technology Adoption Curve by End User Vertical

Segmentation Quick Reference

DimensionSub-SegmentsDominant SegmentFastest Growing Segment
By ArchitectureEncoder-Only Backbones; Hierarchical / Windowed Designs; Encoder-Decoder Detection Models; Hybrid Convolution-AttentionEncoder-Only BackbonesHierarchical / Windowed Designs
By ApplicationObject Detection & Tracking; Image Classification & Retrieval; Semantic & Instance Segmentation; Multimodal Vision-LanguageObject Detection & TrackingSemantic & Instance Segmentation
By End UserAutomotive & Mobility; Healthcare & Life Sciences; Manufacturing & Industrial; Retail & E-commerce; Government & DefenseAutomotive & MobilityHealthcare & Life Sciences
By RegionNorth America; Europe; Asia-Pacific; South America; Middle East & AfricaNorth AmericaAsia-Pacific


Market Segmentation Overview

By Architecture

Sub-SegmentKey Trend
Encoder-Only BackbonesDrop-in replacement for convolutional feature extractors keeps switching costs low.
Hierarchical / Windowed DesignsWindowed attention makes high-resolution dense prediction computationally viable.
Encoder-Decoder Detection ModelsSet-based prediction removes anchor tuning and post-processing heuristics.
Hybrid Convolution-AttentionPreferred compromise where power and latency budgets are fixed


Architecture choice increasingly follows deployment surface rather than accuracy leaderboards. Buyers running cloud inference default to encoder-only or hierarchical designs, while anyone shipping to a vehicle, camera, or handheld device gravitates toward hybrids until sparse-attention silicon reaches volume production.

By Application

Sub-SegmentKey Trend
Object Detection & TrackingUnified multi-camera fusion replaces per-sensor pipelines in mobility stacks.
Image Classification & RetrievalEmbedding-based search displaces keyword tagging in commerce catalogs.
Semantic & Instance SegmentationHighest economic value per inference in clinical and agricultural use
Multimodal Vision-LanguageDocument intelligence pulls vision models into back-office workflows.


Application mix is shifting from single-task inference toward composite workflows where one backbone serves detection, segmentation, and retrieval simultaneously. That consolidation lowers total cost of ownership and favors vendors offering unified platforms over point solutions.

By End User

Sub-SegmentKey Trend
Automotive & MobilityRegulatory test protocols tightening faster than legacy detectors can meet
Healthcare & Life SciencesReimbursement codes convert clinical AI from cost center to revenue line.
Manufacturing & IndustrialLabor scarcity makes automated inspection a staffing decision, not a quality one.
Retail & E-commerceVisual search and shrinkage analytics deliver measurable near-term returns.
Government & DefenseGeospatial analysis volumes exceed human review capacity.


Vertical adoption speed correlates with how quickly a buyer can attach a number to the outcome. Manufacturing and retail move fastest because defect rates and shrinkage are already measured; automotive and defense move slower because validation, not value, is the constraint.




Download PDF ×

We do not share your information with anyone. However, we may send you emails based on your report interest from time to time. You may contact us at any time to opt-out.