Vision Processing Unit Market Segmentation
Vision Processing Unit Market By Application (USD Billion, 2025-2035)
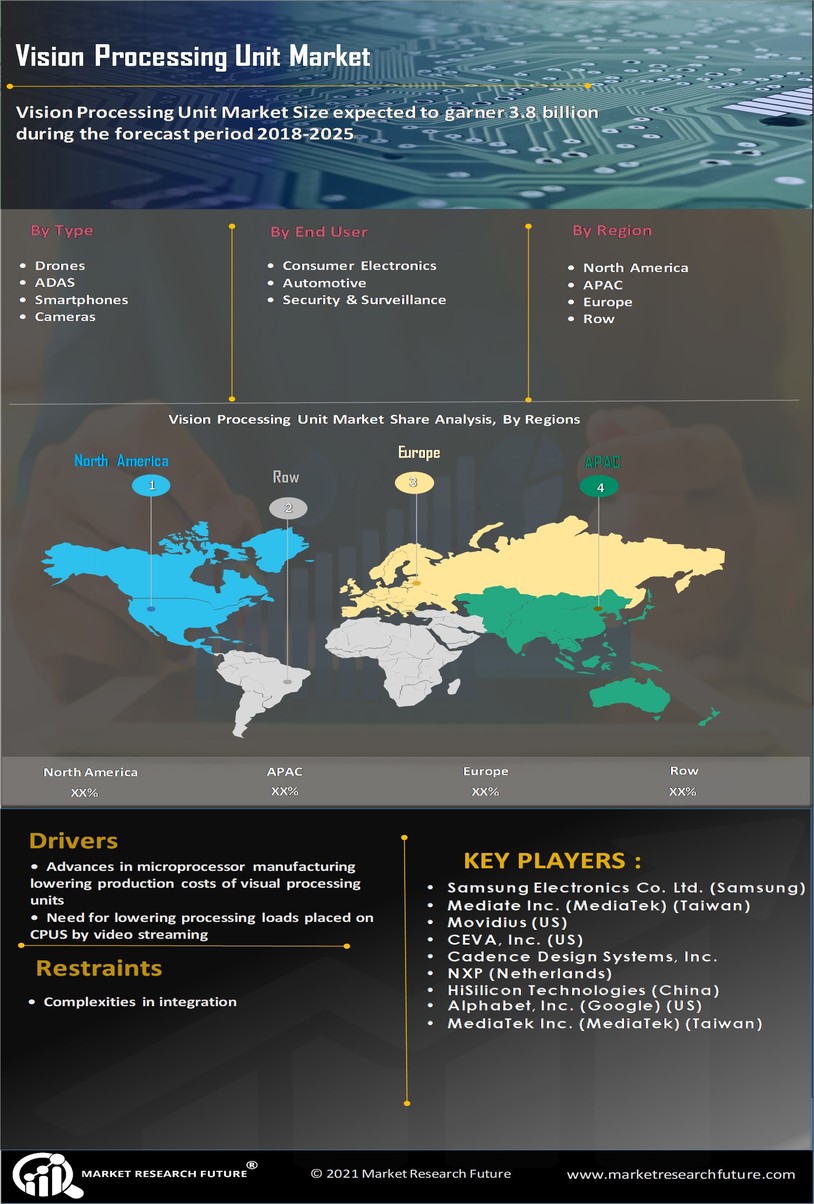
- Automotive
- Consumer Electronics
- Industrial Automation
- Vision Processing Unit Market
- Aerospace
Vision Processing Unit Market By Type (USD Billion, 2025-2035)
- Embedded Vision Processing Units
- PC-Based Vision Processing Units
- Networked Vision Processing Units
Vision Processing Unit Market By Technology (USD Billion, 2025-2035)
- Machine Learning
- Deep Learning
- Computer Vision
- Image Processing
Vision Processing Unit Market By End Use (USD Billion, 2025-2035)
- Research and Development
- Manufacturing
- Quality Control
- Security and Surveillance