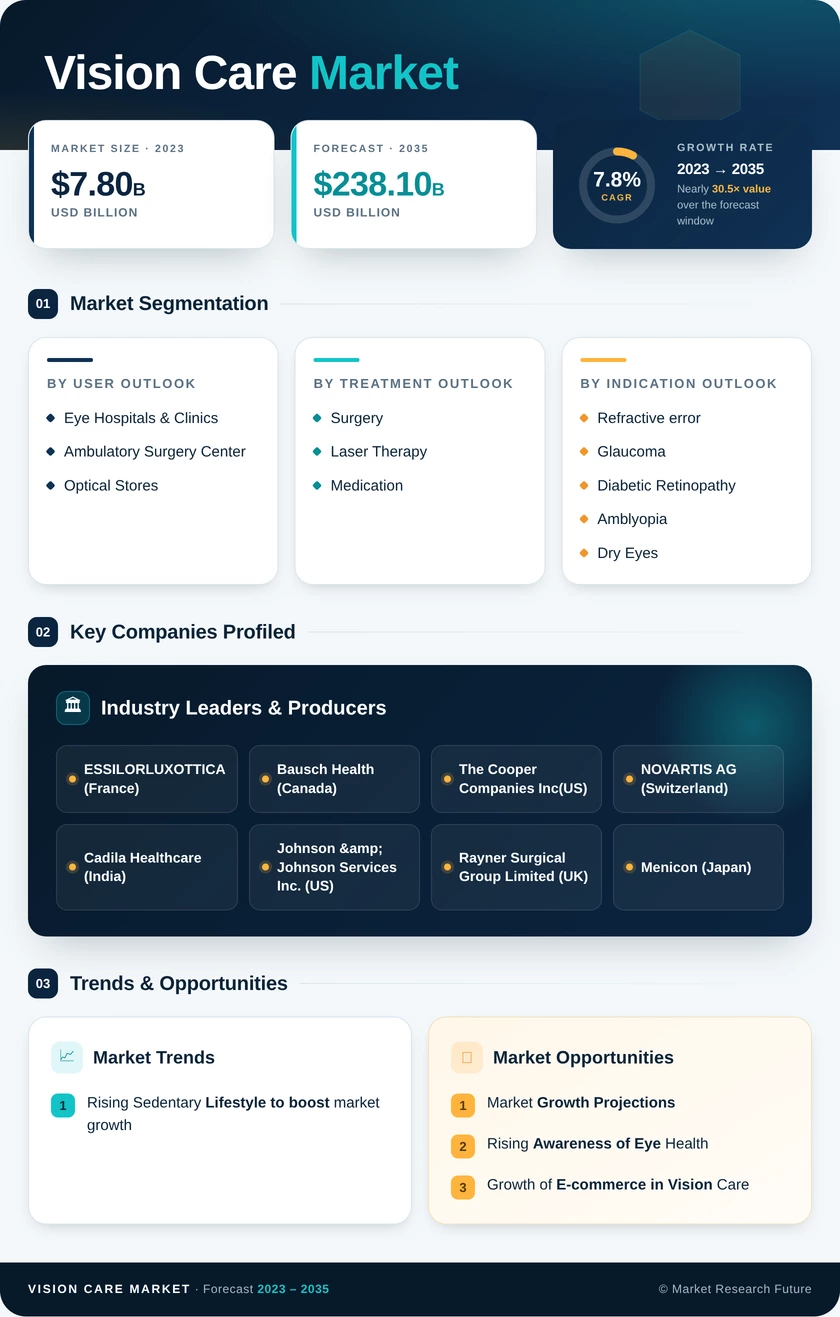
Vision Care Market (2026 - 2035)

ID: MRFR/HC/6978-HCR 127 Pages Nidhi Mandole Last Updated: October 21, 2026
Vision Care Market Research Report Information By Product Type (Contact Lens, Eyeglasses, Intraocular Lens, Contact lens solutions, and Others), By Indication (Refractive error, Glaucoma, Diabetic Retinopathy, Amblyopia, Dry Eyes, and Others), By Treatment (Surgery, Laser Therapy, and Medication), By End Users (Eye Hospitals & Clinics, Ambulatory Surgery Center, Optical Stores), And By Region (North America, Europe, Asia-Pacific, And Rest Of The World) - Growth & Industry Forecast 2026 To 2035
Vision Care Market
Market Size
Forecast Period2026-2035
CAGR (2026-2035)7.25%
2025 Market SizeUSD 65.20 Billion
2035 Market SizeUSD 131.24 Billion
Key Players
EssilorLuxottica
Alcon
Johnson & Johnson Vision
Bausch + Lomb
The Cooper Companies
Hoya Corporation
Opportunities
  • Pediatric Myopia Management in China and Southeast Asia
  • Refractive Access Programs in Emerging Markets
  • AI Screening and Data-Driven Care Models
  1. 1 Market Summary | |
  2. 2 Key Report Takeaways | |
    1. 2.1 By Application | |
    2. 2.2 By Distribution Channel | |
    3. 2.3 By Product Type | |
    4. 2.4 By Age Group | |
    5. 2.5 By Region | |
  3. 3 Market Size and Forecast (2021–2035) | |
    1. 3.1 Historical Market Size (2021–2025) | |
    2. 3.2 Forecast Market Size (2026–2035) | |
    3. 3.3 Year-over-Year Growth Analysis | |
  4. 4 Driver Impact Analysis | |
    1. 4.1 Rising Myopia Prevalence | |
    2. 4.2 Population Ageing and Cataract Volumes | |
    3. 4.3 Diabetes and Retinal Disease Burden | |
    4. 4.4 Digital Strain and Dry Eye Therapeutics | |
    5. 4.5 Premium IOL and Lens Upgrades | |
    6. 4.6 Public Refractive-Coverage Targets | |
    7. 4.7 Online Prescription Portability | |
  5. 5 Restraints Impact Analysis | |
    1. 5.1 Limited Reimbursement for Routine Eye Care | |
    2. 5.2 Eye Care Workforce Shortages | |
    3. 5.3 Price Compression from Online and Private-Label Lenses | |
    4. 5.4 EU MDR Compliance Burden | |
    5. 5.5 Contact Lens Safety Concerns | |
  6. 6 Opportunities | |
    1. 6.1 Pediatric Myopia Management in China and Southeast Asia | |
    2. 6.2 Refractive Access Programs in Emerging Markets | |
    3. 6.3 AI Screening and Data-Driven Care Models | |
    4. 6.4 Subscription and Direct-to-Consumer Business Models | |
    5. 6.5 Smart and Connected Eyewear | |
  7. 7 Regional Market Share and Country-Level Analysis | |
    1. 7.1 North America | | |
      1. 7.1.1 United States | | |
      2. 7.1.2 Canada | | |
      3. 7.1.3 Mexico | |
    2. 7.2 Europe | | |
      1. 7.2.1 Germany | | |
      2. 7.2.2 United Kingdom | | |
      3. 7.2.3 France | | |
      4. 7.2.4 Italy | | |
      5. 7.2.5 Spain | | |
      6. 7.2.6 Nordic Countries | | |
      7. 7.2.7 Russia | | |
      8. 7.2.8 Rest of Europe | |
    3. 7.3 Asia-Pacific | | |
      1. 7.3.1 China | | |
      2. 7.3.2 India | | |
      3. 7.3.3 Japan | | |
      4. 7.3.4 South Korea | | |
      5. 7.3.5 ASEAN | | |
      6. 7.3.6 Rest of Asia-Pacific | |
    4. 7.4 South America | | |
      1. 7.4.1 Brazil | | |
      2. 7.4.2 Argentina | | |
      3. 7.4.3 Rest of South America | |
    5. 7.5 Middle East & Africa | | |
      1. 7.5.1 Saudi Arabia | | |
      2. 7.5.2 United Arab Emirates | | |
      3. 7.5.3 South Africa | | |
      4. 7.5.4 Egypt | | |
      5. 7.5.5 Rest of Middle East & Africa | |
  8. 8 Future Outlook (2026–2035) | |
    1. 8.1 AI-Enabled Diagnostics and Screening | |
    2. 8.2 Retail–Clinic Platform Integration | |
    3. 8.3 Pharma–Optics Convergence | |
    4. 8.4 Sustainability and Circular Packaging | |
  9. 9 Segmentation Analysis | |
    1. 9.1 By Application | | |
      1. 9.1.1 Corrective Vision Care | | |
      2. 9.1.2 Therapeutic and Disease Management | | |
      3. 9.1.3 Preventive and Protective Vision Care | | |
      4. 9.1.4 Cosmetic and Lifestyle Vision Care | |
    2. 9.2 By Distribution Channel | | |
      1. 9.2.1 Optical Retail Stores and Chains | | |
      2. 9.2.2 Hospitals and Ophthalmology Clinics | | |
      3. 9.2.3 E-Commerce Platforms | | |
      4. 9.2.4 Pharmacies and Drugstores | |
    3. 9.3 By Product Type | | |
      1. 9.1.1 Spectacle Lenses | | |
      2. 9.1.2 Contact Lenses | | |
      3. 9.1.3 Intraocular Lenses | | |
      4. 9.1.4 Ocular Health Products | | |
      5. 9.1.5 Vision Correction Systems and Devices | |
    4. 9.4 By Distribution Channel | | |
      1. 9.4.1 Optical Retail Stores and Chains | | |
      2. 9.4.2 Hospitals and Ophthalmology Clinics | | |
      3. 9.4.3 E-Commerce Platforms | | |
      4. 9.4.4 Pharmacies and Drugstores | |
  10. 10 Competitive Landscape | |
    1. 10.1 Market Concentration Analysis | |
    2. 10.2 Competitive Benchmarking Matrix | |
    3. 10.3 Company Profiles | | |
      1. 10.3.1 EssilorLuxottica | | |
      2. 10.3.2 Alcon | | |
      3. 10.3.3 Johnson & Johnson Vision | | |
      4. 10.3.4 Bausch + Lomb | | |
      5. 10.3.5 The Cooper Companies | | |
      6. 10.3.6 Hoya Corporation | | |
      7. 10.3.7 ZEISS Group | | |
      8. 10.3.8 Fielmann Group | | |
      9. 10.3.9 Rodenstock | | |
      10. 10.3.10 Menicon | |
  11. 11 Recent News and Developments | |
  12. 12 Report Scope and Methodology | |
  13. 13 Detailed Sources and Citations | |
  14. 14 Frequently Asked Questions (FAQs) | | LIST OF TABLES | |
  15. TABLE 1 Global Market Summary Snapshot, 2025–2035 | |
  16. TABLE 2 Global Market Size and Forecast, by Revenue (USD Billion), 2021–2035 | |
  17. TABLE 3 Driver Impact Analysis, 2026–2035 | |
  18. TABLE 4 Restraints Impact Analysis, 2026–2035 | |
  19. TABLE 5 Regional Summary, 2025 | |
  20. TABLE 6 North America Market, by Country, 2025 | |
  21. TABLE 7 Europe Market, by Country, 2025 | |
  22. TABLE 8 Asia-Pacific Market, by Country, 2025 | |
  23. TABLE 9 South America Market, by Country, 2025 | |
  24. TABLE 10 Middle East & Africa Market, by Country, 2025 | |
  25. TABLE 11 Global Market, by Application, 2025 | |
  26. TABLE 12 Global Market, by Distribution Channel, 2025 | |
  27. TABLE 13 Competitive Benchmarking Matrix, 2025 | |
  28. TABLE 14 Report Scope and Methodology | |
  29. TABLE 15 Detailed Sources and Citations | |
  30. TABLE 16 Segmentation Quick Reference | |
  31. TABLE 17 Application Sub-Segment Key Trends | |
  32. TABLE 18 Distribution Channel Sub-Segment Key Trends | | LIST OF FIGURES | |
  33. FIGURE 1 Market Dynamics Overview (Drivers, Restraints, Opportunities) | |
  34. FIGURE 2 Industry Value Chain Analysis | |
  35. FIGURE 3 Porter's Five Forces Analysis | |
  36. FIGURE 4 Global Market Size Trend, 2021–2035 (USD Billion) | |
  37. FIGURE 5 Year-over-Year Growth Rate, 2022–2035 | |
  38. FIGURE 6 Market Share by Application, 2025 | |
  39. FIGURE 7 Market Share by Distribution Channel, 2025 | |
  40. FIGURE 8 Regional Market Share, 2025 | |
  41. FIGURE 9 Regional Growth Comparison, 2026–2035 | |
  42. FIGURE 10 Competitive Landscape — Estimated Revenue Share Ranges, 2025 | |
  43. FIGURE 11 Competitive Positioning Matrix

Segmentation Quick Reference

DimensionSub-SegmentsDominant SegmentFastest Growing Segment
By ApplicationCorrective Vision Care; Therapeutic and Disease Management; Preventive and Protective Vision Care; Cosmetic and Lifestyle Vision CareCorrective Vision Care (41.2%)Therapeutic and Disease Management (8.45% CAGR)
By Distribution ChannelOptical Retail Stores and Chains; Hospitals and Ophthalmology Clinics; E-Commerce Platforms; Pharmacies and DrugstoresOptical Retail Stores and Chains (35.9%)E-Commerce Platforms (10.35% CAGR)
By RegionNorth America; Europe; Asia-Pacific; South America; Middle East & AfricaNorth America (38.5%)Asia-Pacific (8.6% CAGR)

Market Segmentation Overview

By Application

Sub-SegmentKey Trend
Corrective Vision CareShift from basic single-vision lenses to progressive, digital-use and myopia-control designs
Therapeutic and Disease ManagementRapid uptake of prescription dry eye drugs, atropine therapy and presbyopia drops
Preventive and Protective Vision CareRising demand for UV-blocking, blue-light and occupational safety eyewear
Cosmetic and Lifestyle Vision CareGrowth in fashion frames, colored lenses and prescription smart glasses

Corrective Vision Care leads because refraction remains the first step in almost every patient journey, and premium lens upgrades raise revenue even where unit volumes are flat. Therapeutic and Disease Management grows fastest as FDA-approved dry eye and presbyopia drugs convert one-off visits into recurring prescriptions. Preventive and Protective Vision Care and Cosmetic and Lifestyle Vision Care add incremental value through coatings and fashion-driven replacement rather than clinical need.

By Distribution Channel

Sub-SegmentKey Trend
Optical Retail Stores and ChainsIn-store diagnostics and retail–clinic integration deepen patient retention
Hospitals and Ophthalmology ClinicsPremium IOL adoption and robotic laser cataract surgery lift procedure value
E-Commerce PlatformsSubscription contact lens programs and online prescription verification scale
Pharmacies and DrugstoresExpanding OTC dry eye shelves and pharmacist-led recommendations

Optical Retail Stores and Chains hold the largest share because first-time prescriptions and multifocal fittings still require in-person measurement. E-Commerce Platforms grow fastest, as FTC prescription portability rules let patients reorder standardized contact lenses online at lower cost. Hospitals and Ophthalmology Clinics retain the high-value surgical pool, while Pharmacies and Drugstores gain from over-the-counter dry eye demand.


Download PDF ×

We do not share your information with anyone. However, we may send you emails based on your report interest from time to time. You may contact us at any time to opt-out.