Segmentation Quick Reference
| Dimension | Sub-Segments | Dominant Segment | Fastest Growing Segment |
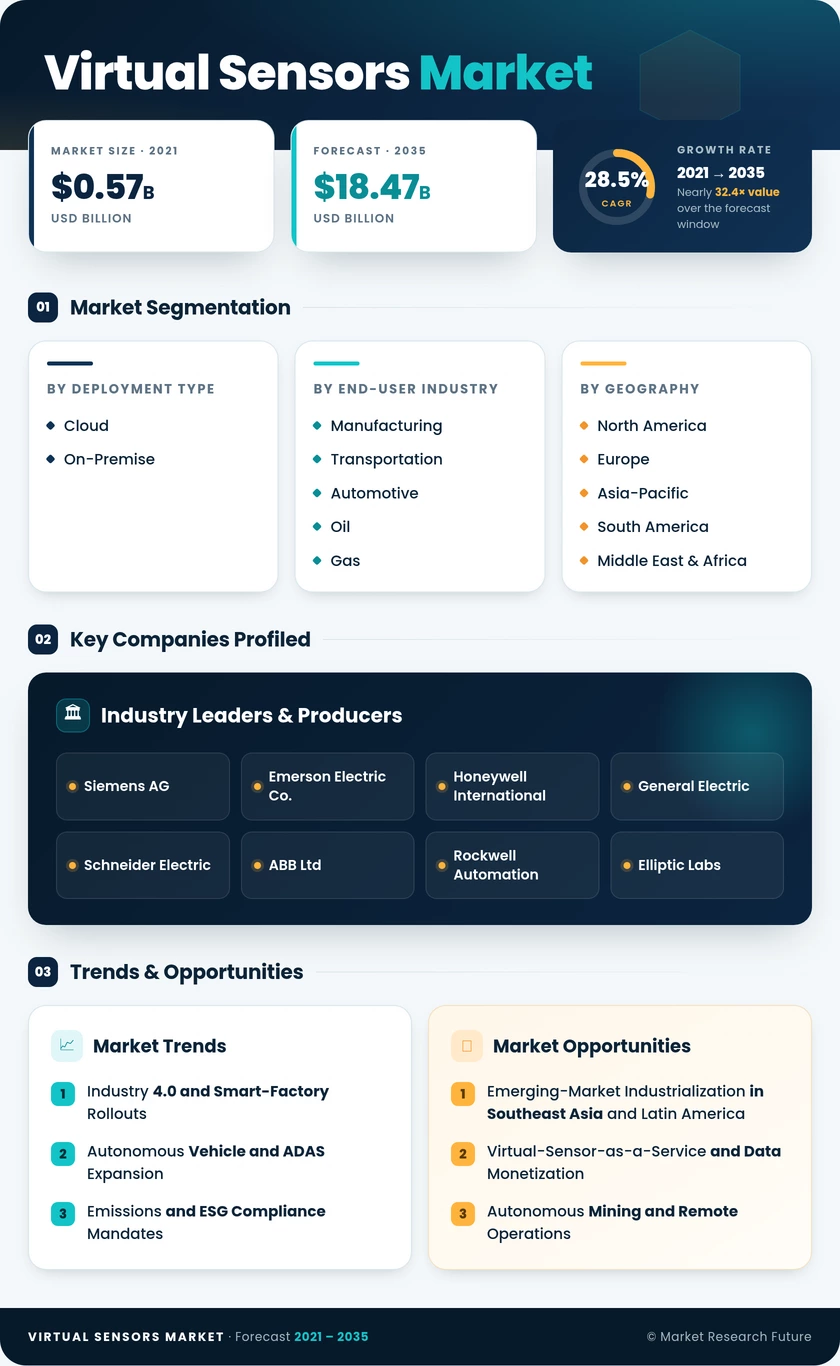
| Deployment Type | Cloud, On-Premise | Cloud | On-Premise |
| End-User Industry | Manufacturing; Transportation and Automotive; Oil and Gas; Aerospace and Defense; Electronics and Consumer Technologies; Metal and Mining; Other End-User Industries | Manufacturing | Transportation and Automotive |
| Geography | North America, Europe, Asia-Pacific, South America, Middle East & Africa | Asia-Pacific | Asia-Pacific |
Market Segmentation Overview
By Deployment Type
| Sub-Segment | Key Trend |
| Cloud | Pay-per-use inference models reducing barriers for mid-market manufacturers. |
| On-Premise | Growing demand in defense, nuclear, and other data-sovereign verticals |
Cloud-based deployment dominates current revenue as enterprises prioritize scalability and rapid model iteration without hardware investment. On-premise solutions are gaining momentum in sectors where regulatory, latency, or classification constraints prohibit telemetry transfer to public cloud environments.
By End-User Industry
| Sub-Segment | Key Trend |
| Manufacturing | Quality-control inference replacing in-line physical gauges |
| Transportation and Automotive | ADAS and EV powertrain cost optimization via sensor virtualization |
| Oil and Gas | Refinery yield optimization and emissions compliance |
| Aerospace and Defense | Engine health monitoring and autonomous systems perception |
| Electronics and Consumer Technologies | In-line semiconductor metrology and smartphone proximity sensing |
| Metal and Mining | Autonomous haulage and flotation-control inference |
| Other End-User Industries | Pharmaceutical PAT, utilities grid-edge monitoring. |
Manufacturing and Transportation together account for over 44% of global revenue. Oil and Gas remains a high-value vertical owing to the critical nature of refinery process variables, while Aerospace and Defense deployments carry premium pricing due to stringent certification requirements.
By Geography
| Sub-Segment | Key Trend |
| North America | Refinery and defense-sector adoption anchors demand |
| Europe | Emissions regulation and Industry 4.0 drive adoption |
| Asia-Pacific | Greenfield smart-factory construction leads global growth. |
| South America | Mining and offshore oil digitalization fuel expansion |
| Middle East & Africa | National oil company digital-transformation programs |
Asia-Pacific's combination of large manufacturing scale, government subsidies, and greenfield capacity positions it as both the largest and fastest-growing geography through 2035.