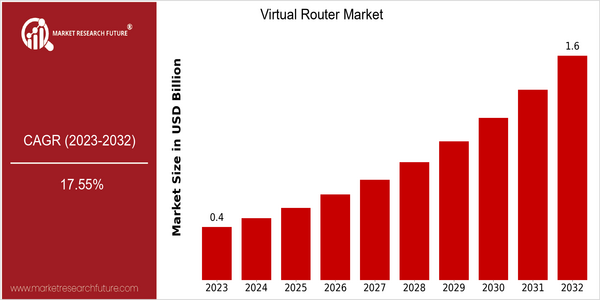
×
  • Cat-intel
  • MedIntelliX
  • Resources
  • About Us
  • Hero Background
    English
    Chinese
    French
    Japanese
    Korean
    German
    Spanish

    Virtual Router Market Size

    ID: MRFR/ICT/5248-HCR
    100 Pages
    Aarti Dhapte
    October 2025

    Virtual Router Market Research Report Information, By Component (Solution and Services), By Type (Custom and Predefined), By End- Users (Service Providers and Enterprises), And By Region (Europe, Asia-Pacific, North America, And Rest Of The World) –Market Forecast Till 2035.

    Share:
    Download PDF ×

    We do not share your information with anyone. However, we may send you emails based on your report interest from time to time. You may contact us at any time to opt-out.

    Virtual Router Market Infographic
    Purchase Options

    Virtual Router Size

    Market Size Snapshot

    Year Value
    2023 USD 0.36 Billion
    2032 USD 1.58 Billion
    CAGR (2024-2032) 17.55 %

    Note – Market size depicts the revenue generated over the financial year

    The Virtual Routers Market is expected to grow at a CAGR of 36%, reaching a market size of $363.1 million in 2023 and is projected to reach $1,580.4 million by 2032. This represents a CAGR of 17.55% from 2024 to 2032, indicating a strong growth trend. The rising volume of data traffic and the increasing popularity of cloud-based services and the Internet of Things are driving the demand for virtual routers. In addition, the emergence of new technological trends, such as the development of 5G and the transition to SDN, will further drive the growth of the virtual routers market. The innovation of virtual routers enables the flexible and efficient network configuration, and the business can optimize the resources and reduce the cost. The industry is a large industry, and the major players, such as Cisco, VMware, and Juniper, have made significant investments in research and development, establishing strategic alliances, and launching new products. Recent technological developments by Cisco, for example, have demonstrated its leadership in virtual routing technology.

    home-ubuntu-www-mrf_ne_design-batch-6-cp-virtual-router-market size

    Regional Market Size

    Regional Deep Dive

    The Virtual Router Market is growing at a fast pace across the globe. The increasing need for network management and the rising popularity of cloud services are the major factors driving the growth of the Virtual Router Market. In North America, the market is characterized by advanced technology and high adoption of virtualization. Europe is experiencing a rise in regulations that promote digital transformation. The Asia-Pacific region is expanding rapidly, owing to the growing number of internet users and mobile devices. The Middle East and Africa are witnessing an increase in investment in telecommunications, whereas Latin America is focusing on increasing digital services and improving digital access.

    Europe

    • The European Union's Digital Single Market strategy is fostering innovation in the virtual router space, encouraging companies like Nokia and Ericsson to develop advanced networking solutions.
    • Sustainability initiatives are prompting organizations to adopt energy-efficient virtual routing technologies, with companies like Deutsche Telekom investing in greener network solutions.

    Asia Pacific

    • The rapid digital transformation in countries like India and China is propelling the virtual router market, with local players such as Huawei and ZTE making significant advancements in virtualization technologies.
    • Government initiatives aimed at improving internet infrastructure, such as the Digital India program, are creating a favorable environment for the adoption of virtual routers.

    Latin America

    • The push for improved internet access in Latin America is driving the adoption of virtual routers, with companies like Movistar and Claro exploring innovative solutions to enhance their network capabilities.
    • Government programs aimed at bridging the digital divide are encouraging the deployment of virtual routing technologies, particularly in underserved areas.

    North America

    • The rise of 5G technology is significantly influencing the virtual router market in North America, with companies like Cisco and Juniper Networks leading the charge in developing solutions that support high-speed connectivity.
    • Regulatory changes, such as the FCC's initiatives to promote broadband access, are driving demand for virtual routers as service providers seek to enhance their network capabilities.

    Middle East And Africa

    • Telecommunications companies in the Middle East, such as Etisalat and STC, are investing heavily in virtual routing technologies to enhance their service offerings and improve network efficiency.
    • The African Union's Agenda 2063 emphasizes the importance of digital infrastructure, leading to increased investments in virtual routers to support connectivity across the continent.

    Did You Know?

    “As of 2023, over 70% of enterprises are expected to adopt virtual routers as part of their network infrastructure, highlighting the shift towards virtualization in networking.” — Gartner Research

    Segmental Market Size

    Virtual Routers are a growing market, driven by the growing need for network management and the growing popularity of cloud computing. A growing need for scalability of network solutions and the trend towards SDN (software-defined networking) which increases flexibility and reduces operating costs are the main driving forces for this market. Also, regulations encouraging digital transformation in various sectors are pushing up the demand for virtual routers. At the moment, virtual routers are in the process of mass deployment, with Cisco and VMware leading the market. North America and Europe are leading the way in the deployment of virtual routers in enterprise networks and data centres. Applications for virtual routers include telecommunications, remote business access, and IoT. In addition to the general trend towards remote work, trends towards promoting green IT and the rise of artificial intelligence (AI) are shaping the development of this market.

    Future Outlook

    Virtual Router Market is expected to experience a CAGR of 17.55% from 2023 to 2032. The growth is driven by the growing need for efficient network management solutions, especially as enterprises are migrating to cloud-based infrastructures. The adoption of virtual routers is expected to account for approximately 30% of the global network equipment market by 2032. The integration of machine learning and artificial intelligence in virtual routers is also expected to drive the market growth. These innovations will enable the smart management of traffic and advanced data analytics, enabling businesses to optimize their network resources. Moreover, the expansion of 5G networks and supportive government policies to digitally transform industries will provide a conducive environment for the adoption of virtual routers. Meanwhile, the emergence of Software-Defined Networking and Network Functions Virtualization will play a key role in shaping the market landscape. These trends will bring about greater flexibility and agility to the network operations.

    Virtual Router Market Size Graph
    Author
    Aarti Dhapte
    Team Lead - Research

    She holds an experience of about 6+ years in Market Research and Business Consulting, working under the spectrum of Information Communication Technology, Telecommunications and Semiconductor domains. Aarti conceptualizes and implements a scalable business strategy and provides strategic leadership to the clients. Her expertise lies in market estimation, competitive intelligence, pipeline analysis, customer assessment, etc.

    Leave a Comment

    FAQs

    How much is the Virtual Router market?

    The Virtual Router market size was valued at USD 0.36 Billion in 2023.

    What is the growth rate of the Virtual Router market?

    The market is projected to grow at a CAGR of 17.55% during the forecast period, 2024-2032.

    Which region held the leading market share in the Virtual Router market?

    North America had the largest share of the market

    Who are the key players in the Virtual Router market?

    The key players in the market are IBM Corporation (US), Cisco Systems (US), Ericsson Inc. (US), Huawei Technologies Co.Ltd. (US), Nokia Corporation (Finland), Juniper Networks Inc. (US), netElastic Systems Inc. (US), Brocade Communications Systems (US), Hewlett Packard Enterprise Company (US), and Arista Networks Inc. (US).

    Which component led the Virtual Router market?

    The solution virtual router category dominated the market in 2022.

    Which end-user had the largest Virtual Router market share?

    Enterprise had the largest share of the market.

    Market Summary

    As per MRFR analysis, the Virtual Router Market Size was estimated at 0.43 USD Billion in 2024. The Virtual Router industry is projected to grow from 0.5055 in 2025 to 2.547 by 2035, exhibiting a compound annual growth rate (CAGR) of 17.55 during the forecast period 2025 - 2035.

    Key Market Trends & Highlights

    The Virtual Router Market is experiencing robust growth driven by technological advancements and increasing demand for network solutions.

    • The market is witnessing increased adoption of cloud services, particularly in North America, which remains the largest market.
    • Focus on network security is intensifying, especially in the Asia-Pacific region, which is recognized as the fastest-growing area.
    • Integration with IoT devices is becoming a critical trend, enhancing connectivity and functionality across various sectors.
    • Rising demand for high-speed internet and the emergence of 5G technology are key drivers propelling market expansion.

    Market Size & Forecast

    2024 Market Size 0.43 (USD Billion)
    2035 Market Size 2.547 (USD Billion)
    CAGR (2025 - 2035) 17.55%
    Largest Regional Market Share in 2024 North America

    Major Players

    <p>Cisco Systems (US), Juniper Networks (US), Hewlett Packard Enterprise (US), Arista Networks (US), MikroTik (LV), TP-Link Technologies (CN), Netgear (US), Ubiquiti Networks (US)</p>

    Market Trends

    The Virtual Router Market is currently experiencing a transformative phase, driven by the increasing demand for efficient network management solutions. Organizations are increasingly adopting virtual routers to enhance their network flexibility and scalability. This shift is largely influenced by the growing trend of digital transformation across various sectors, which necessitates robust and adaptable networking solutions. As businesses seek to optimize their operations, the integration of virtual routers into their infrastructure appears to be a strategic move that aligns with their long-term goals. Furthermore, the rise of cloud computing and the Internet of Things (IoT) is propelling the need for advanced routing technologies, thereby expanding the scope of the Virtual Router Market. In addition, the competitive landscape of the Virtual Router Market is evolving, with numerous players striving to innovate and differentiate their offerings. This environment fosters collaboration and partnerships among technology providers, which may lead to the development of more sophisticated solutions. The emphasis on security and performance optimization is also becoming increasingly pronounced, as organizations prioritize safeguarding their data while ensuring seamless connectivity. Overall, the Virtual Router Market seems poised for continued growth, driven by technological advancements and the pressing need for efficient network solutions.

    Increased Adoption of Cloud Services

    The shift towards cloud-based services is significantly influencing the Virtual Router Market. Organizations are increasingly leveraging cloud infrastructure to enhance their operational efficiency, which necessitates the deployment of virtual routers to manage network traffic effectively.

    Focus on Network Security

    As cyber threats become more sophisticated, the emphasis on network security within the Virtual Router Market is intensifying. Companies are prioritizing solutions that not only facilitate connectivity but also provide robust security features to protect sensitive data.

    Integration with IoT Devices

    The proliferation of Internet of Things (IoT) devices is reshaping the Virtual Router Market. The need for seamless communication between numerous connected devices drives the demand for advanced routing solutions that can handle increased data traffic.

    Virtual Router Market Market Drivers

    Emergence of 5G Technology

    The rollout of 5G technology is poised to significantly impact the Virtual Router Market. With its promise of ultra-fast data speeds and low latency, 5G is expected to transform how data is transmitted across networks. This technological advancement creates a pressing need for virtual routers that can handle the increased data traffic and provide seamless connectivity. Market analysts suggest that the adoption of 5G will lead to a substantial rise in the number of connected devices, which in turn will require sophisticated routing solutions. The Virtual Router Market must adapt to these changes by developing routers that can efficiently manage the complexities of 5G networks. As telecommunications companies invest heavily in 5G infrastructure, the demand for virtual routers capable of supporting this technology is likely to grow exponentially.

    Rising Demand for High-Speed Internet

    The increasing demand for high-speed internet connectivity is a primary driver of the Virtual Router Market. As more consumers and businesses seek faster and more reliable internet services, the need for advanced routing solutions becomes apparent. According to recent data, the number of broadband subscriptions has surged, with millions of new users coming online each year. This trend necessitates the deployment of virtual routers that can efficiently manage traffic and optimize bandwidth usage. The Virtual Router Market is thus positioned to benefit from this growing demand, as service providers look to enhance their infrastructure to meet customer expectations. Furthermore, the shift towards remote work and online services has amplified the need for robust networking solutions, further propelling the market forward.

    Growing Importance of Network Security

    The escalating importance of network security is a pivotal driver for the Virtual Router Market. As cyber threats become more sophisticated, organizations are prioritizing the protection of their network infrastructure. Virtual routers are increasingly being equipped with advanced security features to safeguard data and ensure secure communications. The market is witnessing a surge in demand for routers that can provide robust security measures, such as encryption and intrusion detection. This trend is further fueled by regulatory requirements that mandate stringent security protocols. The Virtual Router Market is thus positioned to capitalize on this growing need for secure networking solutions, as businesses seek to protect their sensitive information and maintain compliance with industry standards.

    Increased Focus on Network Virtualization

    The growing emphasis on network virtualization is driving the Virtual Router Market forward. Organizations are increasingly recognizing the benefits of virtualizing their network infrastructure, which allows for greater scalability, flexibility, and cost savings. Virtual routers play a crucial role in this virtualization process, enabling businesses to deploy and manage their networks more efficiently. Recent statistics indicate that the market for network virtualization is expanding rapidly, with many enterprises investing in virtual solutions to streamline their operations. As companies seek to optimize their IT resources and reduce hardware dependencies, the demand for virtual routers is expected to rise. This trend not only enhances operational efficiency but also supports the broader movement towards cloud-based services and applications.

    Shift Towards Software-Defined Networking (SDN)

    The transition towards Software-Defined Networking (SDN) is a significant driver for the Virtual Router Market. SDN allows for more flexible and efficient network management by decoupling the control plane from the data plane. This shift enables organizations to dynamically adjust their network resources based on real-time demands. As businesses increasingly adopt SDN architectures, the need for virtual routers that can integrate seamlessly into these environments becomes critical. The Virtual Router Market is likely to see a surge in demand as companies seek to enhance their network agility and reduce operational costs. Furthermore, the ability to programmatically manage network resources aligns with the growing trend of automation in IT, further solidifying the role of virtual routers in modern networking.

    Market Segment Insights

    Virtual Router Component Insights

    Based on component, the virtual router market segmentation includes solution and services. The solution segment dominated the market. This is because the solutions segment includes the actual software or hardware that enables virtual routing functionality, which is the core of the virtual router market. Software-based solutions are typically more prevalent than hardware-based ones, as they are more flexible and can be deployed on various hardware platforms.

    Virtual Router Type Insights

    Based on the type, the virtual router market segmentation includes custom and predefined. The prefined segment dominated the market. The predefined virtual routers are off-the-shelf solutions that can be deployed quickly and easily. These solutions are typically less expensive than custom ones but offer less flexibility and may not meet an organization's networking requirements.

    Figure 2: Virtual Router Market by Type, 2022 & 2032 (USD billion)

    Source: Secondary Research, Primary Research, Market Research Future Database and Analyst Review

    Virtual Router End-User Insights

    Based on the end-user, the virtual router market segmentation includes service providers and enterprises. The enterprises segment dominated the market. The enterprise segment includes organizations from various industries, such as banking, healthcare, retail, and manufacturing. Enterprises use virtual routers to connect their offices, data centers, and cloud environments and to support various applications and services. The enterprise segment is also expected to grow as more organizations adopt SDN and NFV to improve their network infrastructure.

    Get more detailed insights about Virtual Router Market Research Report - Global Forecast till 2035

    Regional Insights

    North America : Technology Leadership and Innovation

    North America is the largest market for virtual routers, holding approximately 45% of the global share. The region's growth is driven by the increasing demand for cloud services, the rise of IoT, and the need for enhanced network security. Regulatory support for digital transformation initiatives further catalyzes market expansion. The U.S. leads this market, followed closely by Canada, which contributes around 15% to the overall market share. The competitive landscape in North America is robust, featuring key players like Cisco Systems, Juniper Networks, and Hewlett Packard Enterprise. These companies are at the forefront of innovation, offering advanced solutions that cater to diverse customer needs. The presence of a well-established technology ecosystem, coupled with significant investments in R&D, positions North America as a leader in the virtual router market.

    Europe : Growing Demand for Connectivity

    Europe is witnessing significant growth in the virtual router market, accounting for approximately 30% of the global share. The demand is fueled by the increasing adoption of 5G technology, the need for efficient network management, and regulatory initiatives aimed at enhancing digital infrastructure. Germany and the UK are the largest markets in this region, together holding about 20% of the total market share, driven by their advanced telecommunications sectors. Leading countries in Europe, such as Germany, the UK, and France, are home to major players like Arista Networks and MikroTik. The competitive landscape is characterized by a mix of established firms and emerging startups, fostering innovation and collaboration. Regulatory bodies are actively promoting initiatives to enhance connectivity, which further supports market growth. The European Commission emphasizes the importance of digital infrastructure in its strategic plans.

    Asia-Pacific : Rapid Growth and Adoption

    Asia-Pacific is rapidly emerging as a significant player in the virtual router market, holding around 20% of the global share. The region's growth is driven by the increasing digitalization of businesses, the expansion of cloud services, and government initiatives promoting smart city projects. China and India are the largest markets, contributing approximately 15% to the overall market share, fueled by their vast populations and growing internet penetration. The competitive landscape in Asia-Pacific is diverse, with key players like TP-Link Technologies and Ubiquiti Networks leading the charge. The region is characterized by a mix of local and international companies, fostering a competitive environment. As governments invest in digital infrastructure, the demand for virtual routers is expected to surge, positioning Asia-Pacific as a critical market for future growth.

    Middle East and Africa : Emerging Market Potential

    The Middle East and Africa region is gradually emerging in the virtual router market, holding about 5% of the global share. The growth is primarily driven by increasing internet penetration, the rise of mobile networks, and government initiatives aimed at enhancing digital infrastructure. Countries like South Africa and the UAE are leading this market, contributing approximately 3% to the overall share, as they invest heavily in technology and connectivity solutions. The competitive landscape in this region is evolving, with both local and international players vying for market share. Companies are increasingly focusing on providing tailored solutions to meet the unique needs of the region. As the demand for reliable connectivity solutions grows, the Middle East and Africa are poised for significant advancements in the virtual router market, supported by ongoing investments in technology and infrastructure.

    Key Players and Competitive Insights

    Leading market players are investing heavily in research and development to expand their product lines, which will help the Virtual Router market, grow even more. Market participants are also undertaking several strategic activities to increase their footprint, with important market developments including new product launches, contractual agreements, mergers and acquisitions, higher investments, and collaboration with other organizations. The Virtual Router industry must offer innovative products to expand and survive in a more competitive and rising market climate.

    Manufacturing locally to minimize operational costs is one of the key business tactics manufacturers use in the Virtual Router industry to benefit clients and increase the market sector. In recent years, the Virtual Router industry has offered some of the most significant advantages to the market.

    Major players in the Virtual Router market, including IBM Corporation (US), Cisco Systems (US), Ericsson Inc. (US), Huawei Technologies Co.Ltd. (US), Nokia Corporation (Finland), Juniper Networks Inc. (US), netElastic Systems Inc. (US), Brocade Communications Systems (US), Hewlett Packard Enterprise Company (US), Arista Networks Inc. (US) and others, are attempting to increase market demand by investing in research and development operations.

    IBM Corporation is a multinational technology company that provides hardware, software, and consulting services to businesses and governments worldwide. Its offerings include artificial intelligence, blockchain, cloud computing, cybersecurity, data analytics, and Internet of Things (IoT) solutions. For instance, in January 2019, IBM partnered with Juniper Networks to provide a cloud-native solution for automating and managing network infrastructure. The solution combines Juniper's virtual routers with IBM's Cloud Pak for Network Automation, which uses AI and machine learning to provide end-to-end visibility and control over network infrastructure.

    Huawei Technologies is a Chinese technology company specializing in telecommunications equipment, consumer electronics, and enterprise solutions. Its offerings include smartphones, tablets, laptops, networking equipment, cloud computing solutions, and Internet of Things (IoT) platforms. For instance, in March 2021, Huawei Technologies announced the launch of its CloudEngine S series campus switches and virtual routers, which use AI to improve network automation and efficiency.

    Key Companies in the Virtual Router Market market include

    Industry Developments

    August 2020: VMware announced its acquisition of Nyansa, a network analytics firm specializing in software-defined wide-area networks (SD-WANs) and virtual private networks (VPNs).

    November 2020: Cisco Systems announced a partnership with Google Cloud to launch a virtual router solution for enterprise customers.

    February 2021: Versa Networks announced a partnership with Google Cloud to launch a cloud-native virtual router for enterprise customers.

    March 2021: Huawei Technologies announced the launch of its CloudEngine S series campus switches and virtual routers, which use AI to improve network automation and efficiency.

    Future Outlook

    Virtual Router Market Future Outlook

    <p>The Virtual Router Market is projected to grow at a 17.55% CAGR from 2024 to 2035, driven by increasing demand for cloud services, IoT integration, and network virtualization.</p>

    New opportunities lie in:

    • <p>Development of AI-driven virtual routing solutions for enhanced network efficiency.</p>
    • <p>Expansion into emerging markets with tailored virtual router offerings.</p>
    • <p>Partnerships with cloud service providers to integrate virtual routing capabilities.</p>

    <p>By 2035, the Virtual Router Market is expected to be robust, reflecting substantial growth and innovation.</p>

    Market Segmentation

    Virtual Router Type Outlook

    • Custom
    • Predefined

    Virtual Router End-User Outlook

    • Service Providers
    • Enterprises

    Virtual Router Regional Outlook

    • North America
    • US
    • Canada
    • Europe
    • Germany
    • France
    • UK
    • Italy
    • Spain
    • Rest of Europe
    • Asia-Pacific
    • China
    • Japan
    • India
    • Australia
    • South Korea
    • Rest of Asia-Pacific
    • Rest of the World
    • Middle East
    • Africa
    • Latin America

    Virtual Router Component Outlook

    • Solution
    • Services

    Report Scope

    MARKET SIZE 20240.43(USD Billion)
    MARKET SIZE 20250.5055(USD Billion)
    MARKET SIZE 20352.547(USD Billion)
    COMPOUND ANNUAL GROWTH RATE (CAGR)17.55% (2024 - 2035)
    REPORT COVERAGERevenue Forecast, Competitive Landscape, Growth Factors, and Trends
    BASE YEAR2024
    Market Forecast Period2025 - 2035
    Historical Data2019 - 2024
    Market Forecast UnitsUSD Billion
    Key Companies ProfiledMarket analysis in progress
    Segments CoveredMarket segmentation analysis in progress
    Key Market OpportunitiesIntegration of artificial intelligence in the Virtual Router Market enhances network efficiency and security.
    Key Market DynamicsRising demand for cloud-based solutions drives innovation and competition in the Virtual Router Market.
    Countries CoveredNorth America, Europe, APAC, South America, MEA

    FAQs

    How much is the Virtual Router market?

    The Virtual Router market size was valued at USD 0.36 Billion in 2023.

    What is the growth rate of the Virtual Router market?

    The market is projected to grow at a CAGR of 17.55% during the forecast period, 2024-2032.

    Which region held the leading market share in the Virtual Router market?

    North America had the largest share of the market

    Who are the key players in the Virtual Router market?

    The key players in the market are IBM Corporation (US), Cisco Systems (US), Ericsson Inc. (US), Huawei Technologies Co.Ltd. (US), Nokia Corporation (Finland), Juniper Networks Inc. (US), netElastic Systems Inc. (US), Brocade Communications Systems (US), Hewlett Packard Enterprise Company (US), and Arista Networks Inc. (US).

    Which component led the Virtual Router market?

    The solution virtual router category dominated the market in 2022.

    Which end-user had the largest Virtual Router market share?

    Enterprise had the largest share of the market.

    1. SECTION I: EXECUTIVE SUMMARY AND KEY HIGHLIGHTS
      1. | 1.1 EXECUTIVE SUMMARY
      2. | | 1.1.1 Market Overview
      3. | | 1.1.2 Key Findings
      4. | | 1.1.3 Market Segmentation
      5. | | 1.1.4 Competitive Landscape
      6. | | 1.1.5 Challenges and Opportunities
      7. | | 1.1.6 Future Outlook
    2. SECTION II: SCOPING, METHODOLOGY AND MARKET STRUCTURE
      1. | 2.1 MARKET INTRODUCTION
      2. | | 2.1.1 Definition
      3. | | 2.1.2 Scope of the study
      4. | | | 2.1.2.1 Research Objective
      5. | | | 2.1.2.2 Assumption
      6. | | | 2.1.2.3 Limitations
      7. | 2.2 RESEARCH METHODOLOGY
      8. | | 2.2.1 Overview
      9. | | 2.2.2 Data Mining
      10. | | 2.2.3 Secondary Research
      11. | | 2.2.4 Primary Research
      12. | | | 2.2.4.1 Primary Interviews and Information Gathering Process
      13. | | | 2.2.4.2 Breakdown of Primary Respondents
      14. | | 2.2.5 Forecasting Model
      15. | | 2.2.6 Market Size Estimation
      16. | | | 2.2.6.1 Bottom-Up Approach
      17. | | | 2.2.6.2 Top-Down Approach
      18. | | 2.2.7 Data Triangulation
      19. | | 2.2.8 Validation
    3. SECTION III: QUALITATIVE ANALYSIS
      1. | 3.1 MARKET DYNAMICS
      2. | | 3.1.1 Overview
      3. | | 3.1.2 Drivers
      4. | | 3.1.3 Restraints
      5. | | 3.1.4 Opportunities
      6. | 3.2 MARKET FACTOR ANALYSIS
      7. | | 3.2.1 Value chain Analysis
      8. | | 3.2.2 Porter's Five Forces Analysis
      9. | | | 3.2.2.1 Bargaining Power of Suppliers
      10. | | | 3.2.2.2 Bargaining Power of Buyers
      11. | | | 3.2.2.3 Threat of New Entrants
      12. | | | 3.2.2.4 Threat of Substitutes
      13. | | | 3.2.2.5 Intensity of Rivalry
      14. | | 3.2.3 COVID-19 Impact Analysis
      15. | | | 3.2.3.1 Market Impact Analysis
      16. | | | 3.2.3.2 Regional Impact
      17. | | | 3.2.3.3 Opportunity and Threat Analysis
    4. SECTION IV: QUANTITATIVE ANALYSIS
      1. | 4.1 Information and Communications Technology, BY Component (USD Billion)
      2. | | 4.1.1 Solution
      3. | | 4.1.2 Services
      4. | 4.2 Information and Communications Technology, BY Type (USD Billion)
      5. | | 4.2.1 Custom
      6. | | 4.2.2 Predefined
      7. | 4.3 Information and Communications Technology, BY End-User (USD Billion)
      8. | | 4.3.1 Service Providers
      9. | | 4.3.2 Enterprises
      10. | 4.4 Information and Communications Technology, BY Region (USD Billion)
      11. | | 4.4.1 North America
      12. | | | 4.4.1.1 US
      13. | | | 4.4.1.2 Canada
      14. | | 4.4.2 Europe
      15. | | | 4.4.2.1 Germany
      16. | | | 4.4.2.2 UK
      17. | | | 4.4.2.3 France
      18. | | | 4.4.2.4 Russia
      19. | | | 4.4.2.5 Italy
      20. | | | 4.4.2.6 Spain
      21. | | | 4.4.2.7 Rest of Europe
      22. | | 4.4.3 APAC
      23. | | | 4.4.3.1 China
      24. | | | 4.4.3.2 India
      25. | | | 4.4.3.3 Japan
      26. | | | 4.4.3.4 South Korea
      27. | | | 4.4.3.5 Malaysia
      28. | | | 4.4.3.6 Thailand
      29. | | | 4.4.3.7 Indonesia
      30. | | | 4.4.3.8 Rest of APAC
      31. | | 4.4.4 South America
      32. | | | 4.4.4.1 Brazil
      33. | | | 4.4.4.2 Mexico
      34. | | | 4.4.4.3 Argentina
      35. | | | 4.4.4.4 Rest of South America
      36. | | 4.4.5 MEA
      37. | | | 4.4.5.1 GCC Countries
      38. | | | 4.4.5.2 South Africa
      39. | | | 4.4.5.3 Rest of MEA
    5. SECTION V: COMPETITIVE ANALYSIS
      1. | 5.1 Competitive Landscape
      2. | | 5.1.1 Overview
      3. | | 5.1.2 Competitive Analysis
      4. | | 5.1.3 Market share Analysis
      5. | | 5.1.4 Major Growth Strategy in the Information and Communications Technology
      6. | | 5.1.5 Competitive Benchmarking
      7. | | 5.1.6 Leading Players in Terms of Number of Developments in the Information and Communications Technology
      8. | | 5.1.7 Key developments and growth strategies
      9. | | | 5.1.7.1 New Product Launch/Service Deployment
      10. | | | 5.1.7.2 Merger & Acquisitions
      11. | | | 5.1.7.3 Joint Ventures
      12. | | 5.1.8 Major Players Financial Matrix
      13. | | | 5.1.8.1 Sales and Operating Income
      14. | | | 5.1.8.2 Major Players R&D Expenditure. 2023
      15. | 5.2 Company Profiles
      16. | | 5.2.1 Cisco Systems (US)
      17. | | | 5.2.1.1 Financial Overview
      18. | | | 5.2.1.2 Products Offered
      19. | | | 5.2.1.3 Key Developments
      20. | | | 5.2.1.4 SWOT Analysis
      21. | | | 5.2.1.5 Key Strategies
      22. | | 5.2.2 Juniper Networks (US)
      23. | | | 5.2.2.1 Financial Overview
      24. | | | 5.2.2.2 Products Offered
      25. | | | 5.2.2.3 Key Developments
      26. | | | 5.2.2.4 SWOT Analysis
      27. | | | 5.2.2.5 Key Strategies
      28. | | 5.2.3 Hewlett Packard Enterprise (US)
      29. | | | 5.2.3.1 Financial Overview
      30. | | | 5.2.3.2 Products Offered
      31. | | | 5.2.3.3 Key Developments
      32. | | | 5.2.3.4 SWOT Analysis
      33. | | | 5.2.3.5 Key Strategies
      34. | | 5.2.4 Arista Networks (US)
      35. | | | 5.2.4.1 Financial Overview
      36. | | | 5.2.4.2 Products Offered
      37. | | | 5.2.4.3 Key Developments
      38. | | | 5.2.4.4 SWOT Analysis
      39. | | | 5.2.4.5 Key Strategies
      40. | | 5.2.5 MikroTik (LV)
      41. | | | 5.2.5.1 Financial Overview
      42. | | | 5.2.5.2 Products Offered
      43. | | | 5.2.5.3 Key Developments
      44. | | | 5.2.5.4 SWOT Analysis
      45. | | | 5.2.5.5 Key Strategies
      46. | | 5.2.6 TP-Link Technologies (CN)
      47. | | | 5.2.6.1 Financial Overview
      48. | | | 5.2.6.2 Products Offered
      49. | | | 5.2.6.3 Key Developments
      50. | | | 5.2.6.4 SWOT Analysis
      51. | | | 5.2.6.5 Key Strategies
      52. | | 5.2.7 Netgear (US)
      53. | | | 5.2.7.1 Financial Overview
      54. | | | 5.2.7.2 Products Offered
      55. | | | 5.2.7.3 Key Developments
      56. | | | 5.2.7.4 SWOT Analysis
      57. | | | 5.2.7.5 Key Strategies
      58. | | 5.2.8 Ubiquiti Networks (US)
      59. | | | 5.2.8.1 Financial Overview
      60. | | | 5.2.8.2 Products Offered
      61. | | | 5.2.8.3 Key Developments
      62. | | | 5.2.8.4 SWOT Analysis
      63. | | | 5.2.8.5 Key Strategies
      64. | 5.3 Appendix
      65. | | 5.3.1 References
      66. | | 5.3.2 Related Reports
    6. LIST OF FIGURES
      1. | 6.1 MARKET SYNOPSIS
      2. | 6.2 NORTH AMERICA MARKET ANALYSIS
      3. | 6.3 US MARKET ANALYSIS BY COMPONENT
      4. | 6.4 US MARKET ANALYSIS BY TYPE
      5. | 6.5 US MARKET ANALYSIS BY END-USER
      6. | 6.6 CANADA MARKET ANALYSIS BY COMPONENT
      7. | 6.7 CANADA MARKET ANALYSIS BY TYPE
      8. | 6.8 CANADA MARKET ANALYSIS BY END-USER
      9. | 6.9 EUROPE MARKET ANALYSIS
      10. | 6.10 GERMANY MARKET ANALYSIS BY COMPONENT
      11. | 6.11 GERMANY MARKET ANALYSIS BY TYPE
      12. | 6.12 GERMANY MARKET ANALYSIS BY END-USER
      13. | 6.13 UK MARKET ANALYSIS BY COMPONENT
      14. | 6.14 UK MARKET ANALYSIS BY TYPE
      15. | 6.15 UK MARKET ANALYSIS BY END-USER
      16. | 6.16 FRANCE MARKET ANALYSIS BY COMPONENT
      17. | 6.17 FRANCE MARKET ANALYSIS BY TYPE
      18. | 6.18 FRANCE MARKET ANALYSIS BY END-USER
      19. | 6.19 RUSSIA MARKET ANALYSIS BY COMPONENT
      20. | 6.20 RUSSIA MARKET ANALYSIS BY TYPE
      21. | 6.21 RUSSIA MARKET ANALYSIS BY END-USER
      22. | 6.22 ITALY MARKET ANALYSIS BY COMPONENT
      23. | 6.23 ITALY MARKET ANALYSIS BY TYPE
      24. | 6.24 ITALY MARKET ANALYSIS BY END-USER
      25. | 6.25 SPAIN MARKET ANALYSIS BY COMPONENT
      26. | 6.26 SPAIN MARKET ANALYSIS BY TYPE
      27. | 6.27 SPAIN MARKET ANALYSIS BY END-USER
      28. | 6.28 REST OF EUROPE MARKET ANALYSIS BY COMPONENT
      29. | 6.29 REST OF EUROPE MARKET ANALYSIS BY TYPE
      30. | 6.30 REST OF EUROPE MARKET ANALYSIS BY END-USER
      31. | 6.31 APAC MARKET ANALYSIS
      32. | 6.32 CHINA MARKET ANALYSIS BY COMPONENT
      33. | 6.33 CHINA MARKET ANALYSIS BY TYPE
      34. | 6.34 CHINA MARKET ANALYSIS BY END-USER
      35. | 6.35 INDIA MARKET ANALYSIS BY COMPONENT
      36. | 6.36 INDIA MARKET ANALYSIS BY TYPE
      37. | 6.37 INDIA MARKET ANALYSIS BY END-USER
      38. | 6.38 JAPAN MARKET ANALYSIS BY COMPONENT
      39. | 6.39 JAPAN MARKET ANALYSIS BY TYPE
      40. | 6.40 JAPAN MARKET ANALYSIS BY END-USER
      41. | 6.41 SOUTH KOREA MARKET ANALYSIS BY COMPONENT
      42. | 6.42 SOUTH KOREA MARKET ANALYSIS BY TYPE
      43. | 6.43 SOUTH KOREA MARKET ANALYSIS BY END-USER
      44. | 6.44 MALAYSIA MARKET ANALYSIS BY COMPONENT
      45. | 6.45 MALAYSIA MARKET ANALYSIS BY TYPE
      46. | 6.46 MALAYSIA MARKET ANALYSIS BY END-USER
      47. | 6.47 THAILAND MARKET ANALYSIS BY COMPONENT
      48. | 6.48 THAILAND MARKET ANALYSIS BY TYPE
      49. | 6.49 THAILAND MARKET ANALYSIS BY END-USER
      50. | 6.50 INDONESIA MARKET ANALYSIS BY COMPONENT
      51. | 6.51 INDONESIA MARKET ANALYSIS BY TYPE
      52. | 6.52 INDONESIA MARKET ANALYSIS BY END-USER
      53. | 6.53 REST OF APAC MARKET ANALYSIS BY COMPONENT
      54. | 6.54 REST OF APAC MARKET ANALYSIS BY TYPE
      55. | 6.55 REST OF APAC MARKET ANALYSIS BY END-USER
      56. | 6.56 SOUTH AMERICA MARKET ANALYSIS
      57. | 6.57 BRAZIL MARKET ANALYSIS BY COMPONENT
      58. | 6.58 BRAZIL MARKET ANALYSIS BY TYPE
      59. | 6.59 BRAZIL MARKET ANALYSIS BY END-USER
      60. | 6.60 MEXICO MARKET ANALYSIS BY COMPONENT
      61. | 6.61 MEXICO MARKET ANALYSIS BY TYPE
      62. | 6.62 MEXICO MARKET ANALYSIS BY END-USER
      63. | 6.63 ARGENTINA MARKET ANALYSIS BY COMPONENT
      64. | 6.64 ARGENTINA MARKET ANALYSIS BY TYPE
      65. | 6.65 ARGENTINA MARKET ANALYSIS BY END-USER
      66. | 6.66 REST OF SOUTH AMERICA MARKET ANALYSIS BY COMPONENT
      67. | 6.67 REST OF SOUTH AMERICA MARKET ANALYSIS BY TYPE
      68. | 6.68 REST OF SOUTH AMERICA MARKET ANALYSIS BY END-USER
      69. | 6.69 MEA MARKET ANALYSIS
      70. | 6.70 GCC COUNTRIES MARKET ANALYSIS BY COMPONENT
      71. | 6.71 GCC COUNTRIES MARKET ANALYSIS BY TYPE
      72. | 6.72 GCC COUNTRIES MARKET ANALYSIS BY END-USER
      73. | 6.73 SOUTH AFRICA MARKET ANALYSIS BY COMPONENT
      74. | 6.74 SOUTH AFRICA MARKET ANALYSIS BY TYPE
      75. | 6.75 SOUTH AFRICA MARKET ANALYSIS BY END-USER
      76. | 6.76 REST OF MEA MARKET ANALYSIS BY COMPONENT
      77. | 6.77 REST OF MEA MARKET ANALYSIS BY TYPE
      78. | 6.78 REST OF MEA MARKET ANALYSIS BY END-USER
      79. | 6.79 KEY BUYING CRITERIA OF INFORMATION AND COMMUNICATIONS TECHNOLOGY
      80. | 6.80 RESEARCH PROCESS OF MRFR
      81. | 6.81 DRO ANALYSIS OF INFORMATION AND COMMUNICATIONS TECHNOLOGY
      82. | 6.82 DRIVERS IMPACT ANALYSIS: INFORMATION AND COMMUNICATIONS TECHNOLOGY
      83. | 6.83 RESTRAINTS IMPACT ANALYSIS: INFORMATION AND COMMUNICATIONS TECHNOLOGY
      84. | 6.84 SUPPLY / VALUE CHAIN: INFORMATION AND COMMUNICATIONS TECHNOLOGY
      85. | 6.85 INFORMATION AND COMMUNICATIONS TECHNOLOGY, BY COMPONENT, 2024 (% SHARE)
      86. | 6.86 INFORMATION AND COMMUNICATIONS TECHNOLOGY, BY COMPONENT, 2024 TO 2035 (USD Billion)
      87. | 6.87 INFORMATION AND COMMUNICATIONS TECHNOLOGY, BY TYPE, 2024 (% SHARE)
      88. | 6.88 INFORMATION AND COMMUNICATIONS TECHNOLOGY, BY TYPE, 2024 TO 2035 (USD Billion)
      89. | 6.89 INFORMATION AND COMMUNICATIONS TECHNOLOGY, BY END-USER, 2024 (% SHARE)
      90. | 6.90 INFORMATION AND COMMUNICATIONS TECHNOLOGY, BY END-USER, 2024 TO 2035 (USD Billion)
      91. | 6.91 BENCHMARKING OF MAJOR COMPETITORS
    7. LIST OF TABLES
      1. | 7.1 LIST OF ASSUMPTIONS
      2. | | 7.1.1
      3. | 7.2 North America MARKET SIZE ESTIMATES; FORECAST
      4. | | 7.2.1 BY COMPONENT, 2025-2035 (USD Billion)
      5. | | 7.2.2 BY TYPE, 2025-2035 (USD Billion)
      6. | | 7.2.3 BY END-USER, 2025-2035 (USD Billion)
      7. | 7.3 US MARKET SIZE ESTIMATES; FORECAST
      8. | | 7.3.1 BY COMPONENT, 2025-2035 (USD Billion)
      9. | | 7.3.2 BY TYPE, 2025-2035 (USD Billion)
      10. | | 7.3.3 BY END-USER, 2025-2035 (USD Billion)
      11. | 7.4 Canada MARKET SIZE ESTIMATES; FORECAST
      12. | | 7.4.1 BY COMPONENT, 2025-2035 (USD Billion)
      13. | | 7.4.2 BY TYPE, 2025-2035 (USD Billion)
      14. | | 7.4.3 BY END-USER, 2025-2035 (USD Billion)
      15. | 7.5 Europe MARKET SIZE ESTIMATES; FORECAST
      16. | | 7.5.1 BY COMPONENT, 2025-2035 (USD Billion)
      17. | | 7.5.2 BY TYPE, 2025-2035 (USD Billion)
      18. | | 7.5.3 BY END-USER, 2025-2035 (USD Billion)
      19. | 7.6 Germany MARKET SIZE ESTIMATES; FORECAST
      20. | | 7.6.1 BY COMPONENT, 2025-2035 (USD Billion)
      21. | | 7.6.2 BY TYPE, 2025-2035 (USD Billion)
      22. | | 7.6.3 BY END-USER, 2025-2035 (USD Billion)
      23. | 7.7 UK MARKET SIZE ESTIMATES; FORECAST
      24. | | 7.7.1 BY COMPONENT, 2025-2035 (USD Billion)
      25. | | 7.7.2 BY TYPE, 2025-2035 (USD Billion)
      26. | | 7.7.3 BY END-USER, 2025-2035 (USD Billion)
      27. | 7.8 France MARKET SIZE ESTIMATES; FORECAST
      28. | | 7.8.1 BY COMPONENT, 2025-2035 (USD Billion)
      29. | | 7.8.2 BY TYPE, 2025-2035 (USD Billion)
      30. | | 7.8.3 BY END-USER, 2025-2035 (USD Billion)
      31. | 7.9 Russia MARKET SIZE ESTIMATES; FORECAST
      32. | | 7.9.1 BY COMPONENT, 2025-2035 (USD Billion)
      33. | | 7.9.2 BY TYPE, 2025-2035 (USD Billion)
      34. | | 7.9.3 BY END-USER, 2025-2035 (USD Billion)
      35. | 7.10 Italy MARKET SIZE ESTIMATES; FORECAST
      36. | | 7.10.1 BY COMPONENT, 2025-2035 (USD Billion)
      37. | | 7.10.2 BY TYPE, 2025-2035 (USD Billion)
      38. | | 7.10.3 BY END-USER, 2025-2035 (USD Billion)
      39. | 7.11 Spain MARKET SIZE ESTIMATES; FORECAST
      40. | | 7.11.1 BY COMPONENT, 2025-2035 (USD Billion)
      41. | | 7.11.2 BY TYPE, 2025-2035 (USD Billion)
      42. | | 7.11.3 BY END-USER, 2025-2035 (USD Billion)
      43. | 7.12 Rest of Europe MARKET SIZE ESTIMATES; FORECAST
      44. | | 7.12.1 BY COMPONENT, 2025-2035 (USD Billion)
      45. | | 7.12.2 BY TYPE, 2025-2035 (USD Billion)
      46. | | 7.12.3 BY END-USER, 2025-2035 (USD Billion)
      47. | 7.13 APAC MARKET SIZE ESTIMATES; FORECAST
      48. | | 7.13.1 BY COMPONENT, 2025-2035 (USD Billion)
      49. | | 7.13.2 BY TYPE, 2025-2035 (USD Billion)
      50. | | 7.13.3 BY END-USER, 2025-2035 (USD Billion)
      51. | 7.14 China MARKET SIZE ESTIMATES; FORECAST
      52. | | 7.14.1 BY COMPONENT, 2025-2035 (USD Billion)
      53. | | 7.14.2 BY TYPE, 2025-2035 (USD Billion)
      54. | | 7.14.3 BY END-USER, 2025-2035 (USD Billion)
      55. | 7.15 India MARKET SIZE ESTIMATES; FORECAST
      56. | | 7.15.1 BY COMPONENT, 2025-2035 (USD Billion)
      57. | | 7.15.2 BY TYPE, 2025-2035 (USD Billion)
      58. | | 7.15.3 BY END-USER, 2025-2035 (USD Billion)
      59. | 7.16 Japan MARKET SIZE ESTIMATES; FORECAST
      60. | | 7.16.1 BY COMPONENT, 2025-2035 (USD Billion)
      61. | | 7.16.2 BY TYPE, 2025-2035 (USD Billion)
      62. | | 7.16.3 BY END-USER, 2025-2035 (USD Billion)
      63. | 7.17 South Korea MARKET SIZE ESTIMATES; FORECAST
      64. | | 7.17.1 BY COMPONENT, 2025-2035 (USD Billion)
      65. | | 7.17.2 BY TYPE, 2025-2035 (USD Billion)
      66. | | 7.17.3 BY END-USER, 2025-2035 (USD Billion)
      67. | 7.18 Malaysia MARKET SIZE ESTIMATES; FORECAST
      68. | | 7.18.1 BY COMPONENT, 2025-2035 (USD Billion)
      69. | | 7.18.2 BY TYPE, 2025-2035 (USD Billion)
      70. | | 7.18.3 BY END-USER, 2025-2035 (USD Billion)
      71. | 7.19 Thailand MARKET SIZE ESTIMATES; FORECAST
      72. | | 7.19.1 BY COMPONENT, 2025-2035 (USD Billion)
      73. | | 7.19.2 BY TYPE, 2025-2035 (USD Billion)
      74. | | 7.19.3 BY END-USER, 2025-2035 (USD Billion)
      75. | 7.20 Indonesia MARKET SIZE ESTIMATES; FORECAST
      76. | | 7.20.1 BY COMPONENT, 2025-2035 (USD Billion)
      77. | | 7.20.2 BY TYPE, 2025-2035 (USD Billion)
      78. | | 7.20.3 BY END-USER, 2025-2035 (USD Billion)
      79. | 7.21 Rest of APAC MARKET SIZE ESTIMATES; FORECAST
      80. | | 7.21.1 BY COMPONENT, 2025-2035 (USD Billion)
      81. | | 7.21.2 BY TYPE, 2025-2035 (USD Billion)
      82. | | 7.21.3 BY END-USER, 2025-2035 (USD Billion)
      83. | 7.22 South America MARKET SIZE ESTIMATES; FORECAST
      84. | | 7.22.1 BY COMPONENT, 2025-2035 (USD Billion)
      85. | | 7.22.2 BY TYPE, 2025-2035 (USD Billion)
      86. | | 7.22.3 BY END-USER, 2025-2035 (USD Billion)
      87. | 7.23 Brazil MARKET SIZE ESTIMATES; FORECAST
      88. | | 7.23.1 BY COMPONENT, 2025-2035 (USD Billion)
      89. | | 7.23.2 BY TYPE, 2025-2035 (USD Billion)
      90. | | 7.23.3 BY END-USER, 2025-2035 (USD Billion)
      91. | 7.24 Mexico MARKET SIZE ESTIMATES; FORECAST
      92. | | 7.24.1 BY COMPONENT, 2025-2035 (USD Billion)
      93. | | 7.24.2 BY TYPE, 2025-2035 (USD Billion)
      94. | | 7.24.3 BY END-USER, 2025-2035 (USD Billion)
      95. | 7.25 Argentina MARKET SIZE ESTIMATES; FORECAST
      96. | | 7.25.1 BY COMPONENT, 2025-2035 (USD Billion)
      97. | | 7.25.2 BY TYPE, 2025-2035 (USD Billion)
      98. | | 7.25.3 BY END-USER, 2025-2035 (USD Billion)
      99. | 7.26 Rest of South America MARKET SIZE ESTIMATES; FORECAST
      100. | | 7.26.1 BY COMPONENT, 2025-2035 (USD Billion)
      101. | | 7.26.2 BY TYPE, 2025-2035 (USD Billion)
      102. | | 7.26.3 BY END-USER, 2025-2035 (USD Billion)
      103. | 7.27 MEA MARKET SIZE ESTIMATES; FORECAST
      104. | | 7.27.1 BY COMPONENT, 2025-2035 (USD Billion)
      105. | | 7.27.2 BY TYPE, 2025-2035 (USD Billion)
      106. | | 7.27.3 BY END-USER, 2025-2035 (USD Billion)
      107. | 7.28 GCC Countries MARKET SIZE ESTIMATES; FORECAST
      108. | | 7.28.1 BY COMPONENT, 2025-2035 (USD Billion)
      109. | | 7.28.2 BY TYPE, 2025-2035 (USD Billion)
      110. | | 7.28.3 BY END-USER, 2025-2035 (USD Billion)
      111. | 7.29 South Africa MARKET SIZE ESTIMATES; FORECAST
      112. | | 7.29.1 BY COMPONENT, 2025-2035 (USD Billion)
      113. | | 7.29.2 BY TYPE, 2025-2035 (USD Billion)
      114. | | 7.29.3 BY END-USER, 2025-2035 (USD Billion)
      115. | 7.30 Rest of MEA MARKET SIZE ESTIMATES; FORECAST
      116. | | 7.30.1 BY COMPONENT, 2025-2035 (USD Billion)
      117. | | 7.30.2 BY TYPE, 2025-2035 (USD Billion)
      118. | | 7.30.3 BY END-USER, 2025-2035 (USD Billion)
      119. | 7.31 PRODUCT LAUNCH/PRODUCT DEVELOPMENT/APPROVAL
      120. | | 7.31.1
      121. | 7.32 ACQUISITION/PARTNERSHIP
      122. | | 7.32.1

    Virtual Router Market Segmentation

    Virtual Router Component Outlook (USD Billion, 2019-2032)

    • Solution
    • Service

    Virtual Router Type Outlook (USD Billion, 2019-2032)

    • Custom
    • Predefined

    Virtual Router End-User Outlook (USD Billion, 2019-2032)

    • Service Providers
    • Enterprises

    Virtual Router Regional Outlook (USD Billion, 2019-2032)

    • North America Outlook (USD Billion, 2019-2032)

      • North America Virtual Router by Component

        • Solution
        • Service
      • North America Virtual Router by Type

        • Custom
        • Predefined
      • North America Virtual Router by End-User

        • Service Providers
        • Enterprises
      • US Outlook (USD Billion, 2019-2032)

      • US Virtual Router by Component

        • Solution
        • Service
      • US Virtual Router by Type

        • Custom
        • Predefined
      • US Virtual Router by End-User

        • Service Providers
        • Enterprises
      • CANADA Outlook (USD Billion, 2019-2032)

      • Canada Virtual Router by Component

        • Solution
        • Service
      • Canada Virtual Router by Type

        • Custom
        • Predefined
      • Canada Virtual Router by End-User

        • Service Providers
        • Enterprises
    • Europe Outlook (USD Billion, 2019-2032)

      • Europe Virtual Router by Component

        • Solution
        • Service
      • Europe Virtual Router by Type

        • Custom
        • Predefined
      • Europe Virtual Router by End-User

        • Service Providers
        • Enterprises
      • Germany Outlook (USD Billion, 2019-2032)

      • Germany Virtual Router by Component

        • Solution
        • Service
      • Germany Virtual Router by Type

        • Custom
        • Predefined
      • Germany Virtual Router by End-User

        • Service Providers
        • Enterprises
      • France Outlook (USD Billion, 2019-2032)

      • France Virtual Router by Component

        • Solution
        • Service
      • France Virtual Router by Type

        • Custom
        • Predefined
      • France Virtual Router by End-User

        • Service Providers
        • Enterprises
      • UK Outlook (USD Billion, 2019-2032)

      • UK Virtual Router by Component

        • Solution
        • Service
      • UK Virtual Router by Type

        • Custom
        • Predefined
      • UK Virtual Router by End-User

        • Service Providers
        • Enterprises
      • ITALY Outlook (USD Billion, 2019-2032)

      • Italy Virtual Router by Component

        • Solution
        • Service
      • Italy Virtual Router by Type

        • Custom
        • Predefined
      • Italy Virtual Router by End-User

        • Service Providers
        • Enterprises
      • SPAIN Outlook (USD Billion, 2019-2032)

      • Spain Virtual Router by Component

        • Solution
        • Service
      • Spain Virtual Router by Type

        • Custom
        • Predefined
      • Spain Virtual Router by End-User

        • Service Providers
        • Enterprises
      • Rest Of Europe Outlook (USD Billion, 2019-2032)

      • Rest of Europe Virtual Router by Component

        • Solution
        • Service
      • Rest of Europe Virtual Router by Type

        • Custom
        • Predefined
      • Rest of Europe Virtual Router by End-User

        • Service Providers
        • Enterprises
    • Asia-Pacific Outlook (USD Billion, 2019-2032)

      • Asia-Pacific Virtual Router by Component

        • Solution
        • Service
      • Asia-Pacific Virtual Router by Type

        • Custom
        • Predefined
      • Asia-Pacific Virtual Router by End-User

        • Service Providers
        • Enterprises
      • China Outlook (USD Billion, 2019-2032)

      • China Virtual Router by Component

        • Solution
        • Service
      • China Virtual Router by Type

        • Custom
        • Predefined
      • China Virtual Router by End-User

        • Service Providers
        • Enterprises
      • Japan Outlook (USD Billion, 2019-2032)

      • Japan Virtual Router by Component

        • Solution
        • Service
      • Japan Virtual Router by Type

        • Custom
        • Predefined
      • Japan Virtual Router by End-User

        • Service Providers
        • Enterprises
      • India Outlook (USD Billion, 2019-2032)

      • India Virtual Router by Component

        • Solution
        • Service
      • India Virtual Router by Type

        • Custom
        • Predefined
      • India Virtual Router by End-User

        • Service Providers
        • Enterprises
      • Australia Outlook (USD Billion, 2019-2032)

      • Australia Virtual Router by Component

        • Solution
        • Service
      • Australia Virtual Router by Type

        • Custom
        • Predefined
      • Australia Virtual Router by End-User

        • Service Providers
        • Enterprises
      • Rest of Asia-Pacific Outlook (USD Billion, 2019-2032)

      • Rest of Asia-Pacific Virtual Router by Component

        • Solution
        • Service
      • Rest of Asia-Pacific Virtual Router by Type

        • Custom
        • Predefined
      • Rest of Asia-Pacific Virtual Router by End-User

        • Service Providers
        • Enterprises
    • Rest of the World Outlook (USD Billion, 2019-2032)

      • Rest of the World Virtual Router by Component

        • Solution
        • Service
      • Rest of the World Virtual Router by Type

        • Custom
        • Predefined
      • Rest of the World Virtual Router by End-User

        • Service Providers
        • Enterprises
      • Middle East Outlook (USD Billion, 2019-2032)

      • Middle East Virtual Router by Component

        • Solution
        • Service
      • Middle East Virtual Router by Type

        • Custom
        • Predefined
      • Middle East Virtual Router by End-User

        • Service Providers
        • Enterprises
      • Africa Outlook (USD Billion, 2019-2032)

      • Africa Virtual Router by Component

        • Solution
        • Service
      • Africa Virtual Router by Type

        • Custom
        • Predefined
      • Africa Virtual Router by End-User

        • Service Providers
        • Enterprises
      • Latin America Outlook (USD Billion, 2019-2032)

      • Latin America Virtual Router by Component

        • Solution
        • Service
      • Latin America Virtual Router by Type

        • Custom
        • Predefined
      • Latin America Virtual Router by End-User

        • Service Providers
        • Enterprises
    Infographic

    Free Sample Request

    Kindly complete the form below to receive a free sample of this Report

    Get Free Sample

    Customer Strories

    “I am very pleased with how market segments have been defined in a relevant way for my purposes (such as "Portable Freezers & refrigerators" and "last-mile"). In general the report is well structured. Thanks very much for your efforts.”

    Victoria Milne

    Founder
    Case Study
    Chemicals and Materials

    Compare Licence

    ×
    Features License Type
    Single User Multiuser License Enterprise User
    Price $4,950 $5,950 $7,250
    Maximum User Access Limit 1 User Upto 10 Users Unrestricted Access Throughout the Organization
    Free Customization
    Direct Access to Analyst
    Deliverable Format
    Platform Access
    Discount on Next Purchase 10% 15% 15%
    Printable Versions