ID: MRFR/ICT/5248-HCR | February 2021 | Region: Global | 100 pages
Market Synopsis
A virtual router is a virtual representation or software instantiation of a hardware router. A virtual router is software-based routing framework that replicates the functionalities of a hardware-based Layer 3 IP router. Virtual routers incorporate Virtual Router Redundancy Protocol (VRRP) to enable a computer or server to perform network and packet routing functionalities of the router via software application which increases the reliability of the network. Furthermore, virtual router software can be hosted and migrated on any hardware device which allows decoupling of hardware and software facilitating dynamic and holistic network management. Virtual routers are majorly adopted in IT & telecommunication industry by service providers and in data centers due to benefits such as low costs for hardware maintenance and infrastructure, flexibility to migrate IP routing functions in a network or data center, and uninterrupted service across the entire network. Virtual routers through virtual IP routing provides service agility by increasing the rate at which services can be created and delivered as new services can be scaled and deployed without deployment of new hardware. Virtual routers also enable optimization of capital expenditure (CapEx) and lowers operational expenditures (OpEx).
Juniper Networks, one of the leading virtual routing solutions provider, offers vMX virtual router which runs on the Junos operating system offering enhanced routing services that support businesses, broadband services, and customer premise equipment (CPE). vMX provides features such as network function virtualization (NFV) optimization, faster deployment models, cost-effective network scale-out with subscription-based licensing. Virtual router market is considerably driven by increasing penetration of software defined networking (SDN) and network function virtualization (NFV). Virtual router market is expected to grow with the growing need for mobility, rising penetration of software-defined WAN, high demand for private cloud and virtual router applications across various industry verticals such as BFSI, manufacturing, healthcare, and telecommunication.
Global Virtual Router Market, 2018-2023 (USD Million)
Source: MRFR Analysis
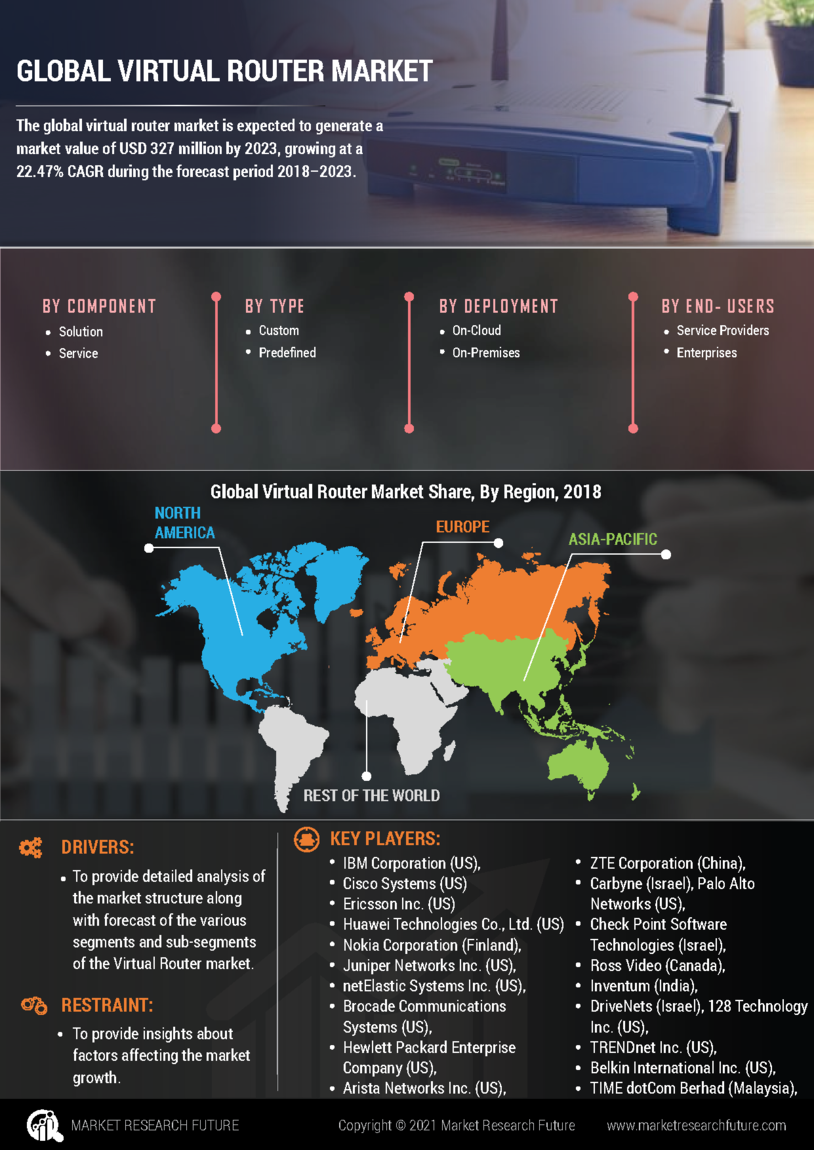
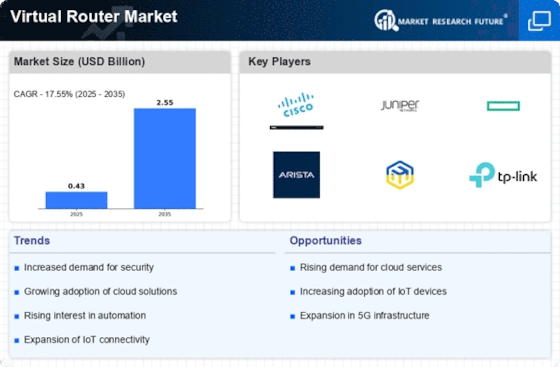
The global virtual router market is expected to generate a market value of USD 327 million by 2023, growing at a 22.47% CAGR during the forecast period 2018–2023.
Segmentation.
Virtual router market study aims at different segments such as component, type, end-user, regions, and estimating market growth across these segments.
By component, the market is segmented into solution and service. The solution is further sub-segmented into integrated solution and standalone solution. The service is further sub-segmented into professional services and managed services.
By type, the market is segmented into custom and predefined virtual routers.
By end-user, the market is segmented into service provider and enterprises. The service provider is sub-segmented into data center, telecom and cloud. The enterprises is sub-segmented into banking, financial services and insurance (BFSI), healthcare, manufacturing, government, education, and others.
By region, the market is segmented into North America, Europe, Asia-Pacific, and the rest of the world.
Regional Analysis
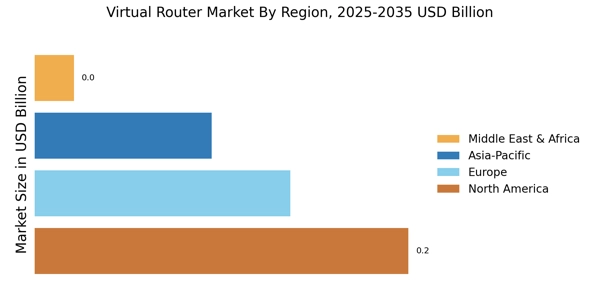
The global market for virtual router is estimated to grow at a significant rate during the forecast period from 2018 to 2023. The geographical analysis of virtual router market is studied for North America, Europe, Asia-Pacific, and the rest of the world. North America holds the largest market share for virtual router market due to increasing adoption of virtual routers by service providers and huge investments by key market players such as Cisco Systems, IBM Corporation, Juniper Networks and others for development of virtual router solutions in the US, Canada, and Mexico. Asia-Pacific is expected to be the fastest growing region in the virtual router market due to growing penetration of software defined networking (SDN) and network function virtualization (NFV) in countries such as China, India, Japan, and others.
Key Players
The prominent players in the virtual router are IBM Corporation (US), Cisco Systems (US), Ericsson Inc. (US), Huawei Technologies Co., Ltd. (US), Nokia Corporation (Finland), Juniper Networks Inc. (US), netElastic Systems Inc. (US), Brocade Communications Systems (US), Hewlett Packard Enterprise Company (US), Arista Networks Inc. (US), ZTE Corporation (China), Carbyne (Israel), Palo Alto Networks (US), Check Point Software Technologies (Israel), Ross Video (Canada), Inventum (India), DriveNets (Israel), 128 Technology Inc. (US), TRENDnet Inc. (US), Belkin International Inc. (US), TIME dotCom Berhad (Malaysia), ACCESS (Japan), Allied Telesis Inc. (Japan), Connectify Inc. (US), and 6WIND S.A. (France).
Intended Audience
Frequently Asked Questions (FAQ) :
22.47% is the rate at which the market is set to advance over the next few years.
The projected market size by 2023 can be USD 327 mn.
The leading players in the global market are TIME dotCom Berhad (Malaysia), Ericsson Inc. (US), netElastic Systems Inc. (US), 128 Technology Inc. (US), Juniper Networks Inc. (US), Nokia Corporation (Finland), IBM Corporation (US), Arista Networks Inc. (US), ZTE Corporation (China), Palo Alto Networks (US), Hewlett Packard Enterprise Company (US), Inventum (India), Carbyne (Israel), Check Point Software Technologies (Israel), Belkin International Inc. (US), Ross Video (Canada), Brocade Communications Systems (US), DriveNets (Israel), Allied Telesis Inc. (Japan), Cisco Systems (US), ACCESS (Japan), Connectify Inc. (US), Huawei Technologies Co., Ltd. (US), 6WIND S.A. (France), TRENDnet Inc. (US), to name a few.
APAC can attain the fastest CAGR in the near future.
The market for virtual router benefits from the rising need for mobility, increasing penetration of software-defined WAN, mounting demand for private cloud along with the surge in applications across a number of industry verticals like manufacturing, BFSI, telecommunication, healthcare, among others.
TABLE OF CONTENTS
1 Executive Summary
2 Scope of the Report
2.1 Market Definition
2.2 Scope of the Study
2.2.1 Research Objectives
2.2.2 Assumptions & Limitations
2.3 Markets Structure
3 Market Research Methodology
3.1 Research Process
3.2 Secondary Research
3.3 Primary Research
3.4 Forecast Model
4 Market Landscape
4.1 Porter’s Five Forces Analysis
4.1.1 Threat of New Entrants
4.1.2 Bargaining power of buyers
4.1.3 Threat of substitutes
4.1.4 Segment rivalry
4.2 Value Chain/Supply Chain of Global Virtual Router Market
5 Industry Overview of Global Virtual Router Market
5.1 Introduction
5.2 Growth Drivers
5.3 Impact Analysis
5.4 Market Challenges
6 Market Trends
6.1 Introduction
6.2 Growth Trends
6.3 Impact analysis
7 Global Virtual Router Market by Component
7.1 Introduction
7.2 Solution
7.2.1 Integrated Solution
7.2.1.1 Market Estimates & Forecast, 2018–2023
7.2.1.2 Market Estimates & Forecast by Region, 2018–2023
7.2.2 Standalone Solution
7.2.2.1 Market Estimates & Forecast, 2018–2023
7.2.2.2 Market Estimates & Forecast by Region, 2018–2023
7.3 Service
7.3.1 Professional Services
7.3.1.1 Market Estimates & Forecast, 2018–2023
7.3.1.2 Market Estimates & Forecast by Region, 2018–2023
7.3.2 Managed Services
7.3.2.1 Market Estimates & Forecast, 2018–2023
7.3.2.2 Market Estimates & Forecast by Region, 2018–2023
8 Global Virtual Router Market by Type
8.1 Introduction
8.2 Custom
8.2.1 Market Estimates & Forecast, 2018–2023
8.2.2 Market Estimates & Forecast, by Region, 2018–2023
8.3 Predefined
8.3.1 Market Estimates & Forecast, 2018–2023
8.3.2 Market Estimates & Forecast, by Region, 2018–2023
9 Global Virtual Router Market by End-User
9.1 Introduction
9.2 Service Providers
9.2.1 Data Center
9.2.1.1 Market Estimates & Forecast, 2018–2023
9.2.1.2 Market Estimates & Forecast, by Region, 2018–2023
9.2.2 Telecom
9.2.2.1 Market Estimates & Forecast, 2018–2023
9.2.2.2 Market Estimates & Forecast, by Region, 2018–2023
9.2.3 Cloud
9.2.3.1 Market Estimates & Forecast, 2018–2023
9.2.3.2 Market Estimates & Forecast, by Region, 2018–2023
9.3 Enterprises
9.3.1 BFSI
9.3.1.1 Market Estimates & Forecast, 2018–2023
9.3.1.2 Market Estimates & Forecast, by Region, 2018–2023
9.3.2 Healthcare
9.3.2.1 Market Estimates & Forecast, 2018–2023
9.3.2.2 Market Estimates & Forecast, by Region, 2018–2023
9.3.3 Manufacturing
9.3.3.1 Market Estimates & Forecast, 2018–2023
9.3.3.2 Market Estimates & Forecast, by Region, 2018–2023
9.3.4 Government
9.3.4.1 Market Estimates & Forecast, 2018–2023
9.3.4.2 Market Estimates & Forecast, by Region, 2018–2023
9.3.5 Education
9.3.5.1 Market Estimates & Forecast, 2018–2023
9.3.5.2 Market Estimates & Forecast, by Region, 2018–2023
9.3.6 Others
9.3.6.1 Market Estimates & Forecast, 2018–2023
9.3.6.2 Market Estimates & Forecast, by Region, 2018–2023
11. Global Virtual Router Market by Region
11.1 Introduction
11.2 North America
11.2.1 Market Estimates & Forecast, by Country, 2018–2023
11.2.2 Market Estimates & Forecast, by Component, 2018–2023
11.2.3 Market Estimates & Forecast, by Type, 2018–2023
11.2.4 Market Estimates & Forecast, by End-User, 2018–2023
11.2.5 US
11.2.5.1 Market Estimates & Forecast, by Component, 2018–2023
11.2.5.2 Market Estimates & Forecast, by Type, 2018–2023
11.2.5.3 Market Estimates & Forecast, by End-User, 2018–2023
11.2.6 Canada
11.2.6.1 Market Estimates & Forecast, by Component, 2018–2023
11.2.6.2 Market Estimates & Forecast, by Type, 2018–2023
11.2.6.3 Market Estimates & Forecast, by End-User, 2018–2023
112.7 Mexico
11.2.7.1 Market Estimates & Forecast, by Component, 2018–2023
11.2.7.2 Market Estimates & Forecast, by Type, 2018–2023
11.2.7.3 Market Estimates & Forecast, by End-User, 2018–2023
11.3 Europe
11.3.1 Market Estimates & Forecast, Country, 2018–2023
11.3.2 Market Estimates & Forecast, by Component, 2018–2023
11.3.3 Market Estimates & Forecast, by Type, 2018–2023
11.3.4 Market Estimates & Forecast, by End-User, 2018–2023
11.3.5 Germany
11.3.5.1 Market Estimates & Forecast, by Component, 2018–2023
11.3.5.2 Market Estimates & Forecast, by Type, 2018–2023
11.3.5.3 Market Estimates & Forecast, by End-User, 2018–2023
11.3.6 France
11.3.6.1 Market Estimates & Forecast, by Component, 2018–2023
11.3.6.2 Market Estimates & Forecast, by Type, 2018–2023
11.3.6.3 Market Estimates & Forecast, by End-User, 2018–2023
11.3.7 Italy
11.3.7.1 Market Estimates & Forecast, by Component, 2018–2023
11.3.7.2 Market Estimates & Forecast, by Type, 2018–2023
11.3.7.3 Market Estimates & Forecast, by End-User, 2018–2023
11.3.8 Spain
11.3.8.1 Market Estimates & Forecast, by Component, 2018–2023
11.3.8.2 Market Estimates & Forecast, by Type, 2018–2023
11.3.8.3 Market Estimates & Forecast, by End-User, 2018–2023
11.3.9 Rest of Europe
11.3.9.1 Market Estimates & Forecast, by Component, 2018–2023
11.3.9.2 Market Estimates & Forecast, by Type, 2018–2023
11.3.9.3 Market Estimates & Forecast by End-User, 2018–2023
11.4 Asia-Pacific
11.4.1 Market Estimates & Forecast, by Country, 2018–2023
11.4.2 Market Estimates & Forecast, by Component, 2018–2023
11.4.3 Market Estimates & Forecast, by Type, 2018–2023
11.4.4 Market Estimates & Forecast, by End-User, 2018–2023
11.4.5 China
11.4.5.1 Market Estimates & Forecast, by Component, 2018–2023
11.4.5.2 Market Estimates & Forecast, by Type, 2018–2023
11.4.5.3 Market Estimates & Forecast, by End-User, 2018–2023
11.4.6 India
11.4.6.1 Market Estimates & Forecast, by Component, 2018–2023
11.4.6.2 Market Estimates & Forecast, by Type, 2018–2023
11.4.6.3 Market Estimates & Forecast, by End-User, 2018–2023
11.4.7 Japan
11.4.7.1 Market Estimates & Forecast, by Component, 2018–2023
11.4.7.2 Market Estimates & Forecast, by Type, 2018–2023
11.4.7.3 Market Estimates & Forecast, by End-User, 2018–2023
11.4.8 Rest of Asia-Pacific
11.4.8.1 Market Estimates & Forecast, by Component, 2018–2023
11.4.8.2 Market Estimates & Forecast, by Type, 2018–2023
11.4.8.3 Market Estimates & Forecast, by End-User, 2018–2023
11.5 Rest of the World
11.5.1 Market Estimates & Forecast, Country, 2018–2023
11.5.2 Market Estimates & Forecast, by Component, 2018–2023
11.5.3 Market Estimates & Forecast, by Type, 2018–2023
11.5.4 Market Estimates & Forecast, by End-User, 2018–2023
11.5.5 Middle East & Africa
11.5.5.1 Market Estimates & Forecast, by Component, 2018–2023
11.5.5.2 Market Estimates & Forecast, by Type, 2018–2023
11.5.5.3 Market Estimates & Forecast, by End-User, 2018–2023
11.5.6 Latin America
11.5.6.1 Market Estimates & Forecast, by Component, 2018–2023
11.5.6.2 Market Estimates & Forecast, by Type, 2018–2023
11.5.6.3 Market Estimates & Forecast, by End-User, 2018–2023
12 Company Landscape
13 Company Profiles
13.1 IBM Corporation
13.1.1 Company Overview
13.1.2 Product/Business Segment Overview
13.1.3 Financial Updates
13.1.4 Key Developments
13.2 Brocade Communications Systems
13.2.1 Company Overview
13.2.2 Product/Business Segment Overview
13.2.3 Financial Updates
13.2.4 Key Developments
13.3 Ericsson
13.3.1 Company Overview
13.3.2 Product/Business Segment Overview
13.3.3 Financial Updates
13.3.4 Key Developments
13.4 Huawei Technologies Co. Ltd.
13.4.1 Company Overview
13.4.2 Product/Business Segment Overview
13.4.3 Financial Updates
13.4.4 Key Developments
13.5 Nokia Corporation
13.5.1 Company Overview
13.5.2 Product/Business Segment Overview
13.5.3 Financial Updates
13.5.4 Key Developments
13.6 Juniper Networks
13.6.1 Company Overview
13.6.2 Product/Business Segment Overview
13.6.3 Financial Updates
13.6.4 Key Developments
13.7 netElastic Systems Inc.
13.7.1 Company Overview
13.7.2 Product/Business Segment Overview
13.7.3 Financial Updates
13.7.4 Key Developments
13.8 Hewlett Packard Enterprise
13.8.1 Company Overview
13.8.2 Product/Business Segment Overview
13.8.3 Financial Updates
13.8.4 Key Developments
13.9 Arista Networks
13.9.1 Company Overview
13.9.2 Product/Business Segment Overview
13.9.3 Financial Updates
13.9.4 Key Developments
13.10 ZTE Corporation
13.10.1 Company Overview
13.10.2 Product/Business Segment Overview
13.10.3 Financial Updates
13.10.4 Key Developments
13.11 Palo Alto Networks
13.11.1 Company Overview
13.11.2 Product/Business Segment Overview
13.11.3 Financial Updates
13.11.4 Key Developments
13.12 Cisco Systems
13.12.1 Company Overview
13.12.2 Product/Business Segment Overview
13.12.3 Financial Updates
13.12.4 Key Developments
13.13 Check Point Software
13.13.1 Company Overview
13.13.2 Product/Business Segment Overview
13.13.3 Financial Updates
13.13.4 Key Developments
13.14 Ross Video
13.14.1 Company Overview
13.14.2 Product/Business Segment Overview
13.14.3 Financial Updates
13.14.4 Key Developments
13.15 Inventum
13.15.1 Company Overview
13.15.2 Product/Business Segment Overview
13.15.3 Financial Updates
13.15.4 Key Developments
14 Conclusion
LIST OF TABLES
Table 1 Global Virtual Router Market Market, by Region, 2018–2023
Table 2 North America: Virtual Router Market Market, by Country, 2018–2023
Table 3 Europe: Virtual Router Market Market, by Country, 2018–2023
Table 4 Asia-Pacific: Virtual Router Market, by Country, 2018–2023
Table 5 Rest of The World: Virtual Router Market, by Country, 2018–2023
Table 6 Global Virtual Router Market, by Component, 2018–2023
Table 7 North America: Virtual Router Market by Component, 2018–2023
Table 8 Europe: Virtual Router Market by Component, 2018–2023
Table9 Asia-Pacific: Virtual Router Market by Component,2018–2023
Table10 Rest of the world: Virtual Router Market by Component, 2018–2023
Table11 Global Virtual Router Market by Type, 2018–2023
Table12 North America: Virtual Router Market by Type, 2018–2023
Table13 Europe: Virtual Router Market by Type, 2018–2023
Table14 Asia-Pacific: Virtual Router Market by Type, 2018–2023
Table15 Rest of the World: Virtual Router Market by Type, 2018–2023
Table16 North America: Virtual Router Market by End-user, 2018–2023
Table17 Europe: Virtual Router Market by End-user, 2018–2023
Table18 Asia-Pacific: Virtual Router Market by End-user, 2018–2023
Table19 Rest of the World: Virtual Router Market by End-user, 2018–2023
LIST OF FIGURES
FIGURE 1 Global Virtual Router Market Segmentation
FIGURE 2 Forecast Methodology
FIGURE 3 Porter’s Five Forces Analysis of Global Virtual Router Market
FIGURE 4 Value Chain of Global Virtual Router Market
FIGURE 5 Share of Global Virtual Router Market in 2017, by Country (in %)
FIGURE 6 Global Virtual Router Market, 2018–2023
FIGURE 7 Global Virtual Router Market Size, by Component, 2018
FIGURE 8 Share of Global Virtual Router Market, by Component, 2018 to 2023
FIGURE 9 Global Virtual Router Market Size, by Type, 2018
FIGURE 10 Share of Global Virtual Router Market, by Type, 2018 to 2023
FIGURE 11 Global Virtual Router Market Size, by End-user, 2018 to 2023
FIGURE 12 Share of Global Virtual Router Market, by End-user, 2018 to 2023